Back to Journals » Journal of Inflammation Research » Volume 19
Single-Cell RNA-Sequencing of Peripheral Blood Reveals Neutrophil Heterogeneity in Childhood ANCA-Associated Vasculitis
Authors Wei S, Tan L, Tang L, Xiong HY, Yang Q, Jiao J, Liu Z, Zhang G, Yang H, Li Q, Zhang A, Wang M
Received 5 June 2025
Accepted for publication 27 December 2025
Published 15 January 2026 Volume 2026:19 545080
DOI https://doi.org/10.2147/JIR.S545080
Checked for plagiarism Yes
Review by Single anonymous peer review
Peer reviewer comments 2
Editor who approved publication: Prof. Dr. Chengming Fan
Shengsen Wei,1,* Liwen Tan,1,* Lin Tang,2 Hua-Ying Xiong,1 Qin Yang,1 Jia Jiao,1 Zilin Liu,1 Gaofu Zhang,1 Haiping Yang,1 Qiu Li,1 Aihua Zhang,3 Mo Wang1
1Department of Nephrology, Children’s Hospital of Chongqing Medical University, National Clinical Research Center for Child Health and Disorders, Ministry of Education Key Laboratory of Child Development and Disorders, Key Laboratory of Children’s Vital Organ Development and Diseases of Chongqing Health Commission, Chongqing Key Laboratory of Pediatric Metabolism and Inflammatory Diseases, Chongqing, 400014, People’s Republic of China; 2Department of Rheumatology and Immunology, The Second Affiliated Hospital of Chongqing Medical University, Chongqing, 400014, People’s Republic of China; 3Department of Nephrology, Children’s Hospital of Nanjing Medical University, Nanjing, 210008, People’s Republic of China
*These authors contributed equally to this work
Correspondence: Mo Wang, Email [email protected] Aihua Zhang, Email [email protected]
Background: The intolerance of the body to neutrophil antigens drives the pathogenesis of childhood anti-neutrophil cytoplasmic autoantibody-associated vasculitis (AAV), making neutrophils a central focus of research on the disease’s underlying mechanisms.
Methods: We performed single-cell RNA sequencing on 18 peripheral blood samples (including three healthy human samples, twelve samples from patients with different types of AAV, and three samples from patients after AAV treatment) to investigate neutrophil heterogeneity in AAV. These bioinformatics findings were subsequently validated through comprehensive experimental approaches, including in vitro cellular assays, in vivo animal studies, clinical sample analyses, and correlation with patient clinical data.
Results: In AAV, neutrophils were reclassified into seven distinct clusters, Neutrophils2 (N2, CD10+CD11B++) exhibited significant expansion (P< 0.01), while Neutrophils5 (N5, CD10−CD11B++) showed a trend toward increase (P> 0.05). This phenomenon has been confirmed by the experimental autoimmune vasculitis model (CD10+CD11B++, P< 0.001; CD10−CD11B++, P< 0.05). The bioinformatics results indicated that both CD10+CD11B++ neutrophils and CD10−CD11B++ neutrophils exhibited dominant pro-inflammatory activities, including neutrophil activation, reactive oxygen species production, neutrophil extracellular trap formation, and degranulation. Pseudotime trajectory and RNA velocity analyses indicated direct differentiation of CD10+CD11B++ neutrophils from CD10−CD11B++ neutrophils. Experiments using HL-60 cells demonstrated that the peripheral blood microenvironment of AAV promotes the generation of CD11B++ neutrophils (P< 0.001). Functionally relevant metabolic profiling revealed a substantial reduction in glutamine metabolism in the CD10+CD11B++ neutrophils of AAV patients compared to controls (P< 0.001), which was restored following treatment (P< 0.001). Experimental results demonstrated that increasing glutamine concentration in the microenvironment of HL-60 cells can decrease the production of CD11B++ neutrophils (P< 0.001). Clinical data demonstrate that peripheral blood GGT concentrations increase in patients following treatment (P< 0.01).
Conclusion: These findings identify two novel pathogenic neutrophil subsets and suggest that modulation of glutamine metabolism is a promising avenue for further investigation as a potential therapeutic strategy in childhood AAV.
Keywords: single-cell RNA sequencing, neutrophil, AAV, heterogeneity, metabolic reprogramming
Introduction
Anti-neutrophil cytoplasmic autoantibody (ANCA)-associated vasculitis (AAV) is a rare but severe systemic vasculitis characterized by inflammation and necrosis of small blood vessels, leading to multi-organ dysfunction, with three main subtypes: granulomatous polyangiitis (GPA), microscopic polyangiitis (MPA), and eosinophilic granulomatosis with polyangiitis (EGPA), each sharing a common pathogenic mechanism centered on neutrophil dysregulation and autoimmunity to neutrophil-derived proteins.1
The pathogenesis of AAV is fundamentally linked to autoantibodies targeting neutrophil granule components, predominantly myeloperoxidase (MPO) and proteinase 3 (PR3). These autoantigens not only serve as diagnostic markers but also play direct roles in mediating vascular injury through complex immunopathological mechanisms. Emerging evidence suggests that neutrophil activation and subsequent effector responses constitute the cornerstone of AAV pathogenesis, bridging innate and adaptive immune dysfunction.2,3 Both pathogenic antigens are produced by autoimmune cells (mainly neutrophils), so a comprehensive elucidation of the immune system’s dynamic alterations during AAV development is of paramount importance.
Neutrophils, as key effector cells of the innate immune system, participate in various immune and inflammatory responses.4 Neutrophil maturation proceeds through a well-defined developmental sequence, originating from hematopoietic stem cells (HSCs) and progressing via myeloid progenitor cells (MPPs), granulocyte-macrophage progenitor cells (GMPs), myeloblasts, promyelocytes, myelocytes, metamyelocytes, band cells, and finally segmented neutrophils.5 During this process, the nucleus undergoes progressive condensation and lobulation, while the cytoplasm sequentially synthesizes primary granules (azurophilic granules containing myeloperoxidase, MPO), secondary granules (specific granules containing lactoferrin and components of NADPH oxidase), and tertiary granules (containing gelatinase and hydrolases). These granules constitute essential functional elements that equip neutrophils with potent bactericidal capabilities.5,6
Concomitantly, the surface marker profile of neutrophils changes dynamically throughout maturation, providing a basis for the identification of distinct maturation stages via flow cytometry. Expression of CD11B (Integrin αM) and CD16 (FcγRIIIb) increases with maturation, and high co-expression of CD10 (neutral endopeptidase) and CD16 is regarded as a reliable indicator of terminal neutrophil maturation.6,7
It has been reported that under conditions such as systemic autoimmune diseases, infections, or cancer-induced bone marrow stress, low-density neutrophils (LDNs) appear in the peripheral blood. LDNs are defined by their physical density characteristics (<1.075 g/mL) rather than specific surface markers, and represent a heterogeneous population. This group typically consists of two main subtypes: immature LDNs and activated/degranulated mature LDNs. However, the mechanisms underlying their generation and their precise pathophysiological significance in disease contexts remain insufficiently studied.8,9
Upon infection or inflammation, TH17 cells stimulate macrophages to produce pro-inflammatory cytokines, activating neutrophils to release autoantigens such as MPO and PR3.10 The pathogenesis of AAV involves the breakdown of immune tolerance in T and B cells toward neutrophil-derived antigens. These lymphocytes bind antigens in an FcγR-dependent manner, leading to excessive neutrophil activation.11 Loss of tolerance results in elevated ANCA levels, which further promote neutrophil migration to the microvasculature, causing endothelial injury. Activated neutrophils release self-antigens that are taken up by antigen-presenting cells (eg, dendritic cells), priming effector T cells and perpetuating vascular damage.12 Neutrophils contribute to AAV progression through multiple mechanisms, including reactive oxygen species (ROS) production, neutrophil extracellular trap (NET) formation, degranulation, protease release, and NETosis-mediated cell death.11
Neutrophil heterogeneity and dysfunction have been increasingly recognized as central elements in the pathogenesis of anti-neutrophil cytoplasmic antibody (ANCA)-associated vasculitis (AAV). Previous foundational studies in immunopathology, along with emerging single-cell transcriptomic analyses in autoimmune and inflammatory diseases, have identified functionally distinct neutrophil subsets in adult AAV patients.13 These subsets exhibit varied roles in inflammation, tissue damage, and immune regulation. However, the metabolic mechanisms underlying neutrophil heterogeneity, particularly in pediatric AAV, remain largely unexplored.
Accumulating evidence underscores the crucial role of glutamine metabolism in modulating neutrophil behavior and broader immune responses. Glutamine is not only a key energy source but also contributes to biosynthetic pathways and redox balance, impacting neutrophil differentiation, activation, and effector functions.14,15 In inflammatory environments, altered metabolic programs can lead to functional diversification among neutrophil subsets. For instance, glutamine deprivation or pharmacological inhibition of its metabolism has been shown to impair neutrophil extracellular trap (NET) formation and reduce reactive oxygen species (ROS) production—processes highly relevant to AAV pathogenesis.16
In addition to metabolic reprogramming, multiple factors are known to drive neutrophil heterogeneity. These include prior infections, systemic inflammatory cues, genetic background, and tissue-specific microenvironments.17–19 Such factors may induce epigenetic remodeling or transcriptional changes that prime neutrophils toward pro-inflammatory, immunosuppressive, or regulatory phenotypes. A comprehensive understanding of these drivers is essential for accurately interpreting neutrophil subset dynamics and their contribution to AAV progression.
The developmental context of the immune system adds another layer of complexity. Recent pediatric immunometabolism reviews highlight that immune cell metabolism is intrinsically linked to ontogeny and maturation.16,20 For example, neonates and children exhibit distinct metabolic requirements and nutrient sensitivities compared to adults, which may influence disease mechanisms and treatment responses. In pediatric AAV, the interplay between developmental metabolism and neutrophil heterogeneity could reveal age-specific pathological pathways.15
Therefore, this study aims to investigate how glutamine metabolism influences neutrophil heterogeneity and function in the context of pediatric AAV. By integrating transcriptional and metabolic analyses, we seek to identify subset-specific and potential immunometabolic therapeutic targets. This research strives not only to advance our mechanistic understanding of AAV but also to pave the way for novel treatment strategies.
Materials and Methods
Patients
Inclusion criteria were as follows: patients who fulfilled the 2012 Chapel Hill Consensus Conference(CHCC) criteria21 or the 2007 European Medicines Agency classification.22 Individuals with systemic lupus erythematosus, medications, infections, or tumors that cause vasculitis were not included. Three healthy donors (mean age: 11 years; 1 female) were included in the analysis. No abnormalities were detected in their peripheral blood ANCA levels, complete blood count, liver and kidney function tests, or abdominal ultrasound examinations. The study was approved by the Ethics Committee of the Children’s Hospital of Chongqing Medical University (Approval Number: 149/2022) (Figure 1).
 |
Figure 1 The flow chart of the study design. |
Rat and Experimental Autoimmune Vasculitis (EAV) Model
We obtained Wistar-Kyoto (WKY) rats from Vital River (Beijing, China). The model was induced by immunization with MPO according to the previous study by Little et al.23 This well-validated model reliably recapitulates key pathological features of human AAV, including neutrophil infiltration, vascular inflammation, and MPO-ANCA production, and has been extensively utilized in AAV pathogenesis studies and therapeutic evaluation.24 Female WKY rats (4 weeks old, representing juvenile status) were used in this study. Rats in the experimental group (N=3) were primarily immunized via intramuscular and subcutaneous injections with an emulsion of human myeloperoxidase (MPO, 1600 μg/kg) and complete Freund’s adjuvant, followed by intraperitoneal booster injections of pertussis toxin (1 μg/rat, P7208, Sigma-Aldrich, St Louis, MO, USA) on days 0 and 2 post-immunization. Control group rats (N=3) received equivalent doses of human serum albumin (HSA) instead of MPO using the same protocol. All animals were euthanized by CO2 asphyxiation at week 8. All these disease model rats exhibited varying degrees of hematuria, proteinuria, pulmonary hemorrhage, and renal glomerular crescent formation. The research was approved by the Ethics Committee of Children’s Hospital of Chongqing Medical University Approval for Research Involving Animals (Number: CHCMU-IACUC20211215001).
Phenotypic Analysis of the EAV Rat Model
Urinalysis in EAV rats was performed using dipsticks (Mission, Hangzhou, China) for semi-quantitative assessment of hematuria (0–4), while proteinuria was measured with an automated urine biochemical analyzer (Cobas c701, Roche, Basel, Switzerland).
Renal function was evaluated by collecting serum samples prior to sacrifice, followed by centrifugation at 1000 × g for 15 min and subsequent analysis of serum creatinine (Scr) and blood urea nitrogen (BUN) levels using an automated blood biochemistry system (Cobas 8000, Roche, Basel, Switzerland).
For histological examination, lung and kidney tissues were fixed in 4% paraformaldehyde, embedded in paraffin, and sectioned at thicknesses of 4 µm and 3 µm, respectively. Pulmonary hemorrhage was confirmed using a Prussian blue staining kit (Solarbio), with hemosiderin-laden cells quantified by averaging counts from three random fields per rat. Pulmonary vasculitis was scored based on gross inspection of lung surface hemorrhages: 0 = none; 1 = single hemorrhage; 2 = 2–5 hemorrhages; 3 = 6–12 hemorrhages; and 4 = >12 hemorrhages. Following PAS staining, the total number of glomeruli in kidney sections was counted, and the percentages of cellular crescents as well as fibrocellular/fibrous crescents relative to all glomeruli were recorded.24
Clinical Sample Collection and Single-Cell Preparation Procedures
Peripheral blood samples (3–5 mL) were collected in EDTA anticoagulant tubes and maintained at 2–8°C during transport to the laboratory, with prior written informed consent obtained from all participants. The blood was diluted 20-fold with phosphate-buffered saline (PBS), followed by the addition of red blood cell lysis buffer (RCLB; Singleron) at a 1:3 (v/v) ratio. After 10–12 min incubation at room temperature (20–25°C), the suspension was centrifuged (450 × g, 10 min) and the supernatant aspirated. The cellular pellet was sequentially processed by: (1) resuspension in 1 mL PBS, (2) volume adjustment to 5 mL with PBS, (3) centrifugation (300 × g, 5 min), and (4) supernatant removal. This washing cycle was repeated once before final resuspension in an appropriate PBS volume. Cell viability and concentration were determined using AO/PI (acridine orange/propidium iodide) staining quantified with a Countstar® Rigel automated fluorescence cell counter.
RT & Amplification & Library Construction
The Singleron Matrix® Single Cell Processing System was used to load single-cell suspensions (2×10⁵ cells/mL) with PBS (HyClone) onto microwell chips. After the Barcoding Beads are removed from the microwell chip, PCR amplification and reverse transcription of the mRNA they have captured are performed to produce cDNA. Sequencing adapters are then used to fragment and ligate the amplified cDNA. The GEXSCOPE® Single Cell RNA Library Kits (Singleron, 2 RXNs/16 RXNs, November 2023/11) protocol was followed in the construction of the scRNA-seq libraries. After being diluted to 4 nM, the individual libraries were combined and sequenced using 150 bp paired end reads on an Illumina Novaseq 6000.
Primary Analysis of Raw Read Data (scRNA-Seq)
Gene expression profiles were produced from raw reads using CeleScope v1.5.2 with default settings. In a nutshell, R1 reads were used to extract and correct barcodes and UMIs. R2 reads had their adapter sequences and poly-A tails removed before being aligned using STAR (v2.6.1b) against the GRCh38 (hg38) transcriptome. Subsequently, Uniquely mapped reads were then assigned to exons with FeatureCounts (v2.0.1). Successfully Assigned Reads were grouped together to create the gene expression matrix for additional analysis if they shared the same gene, cell barcode, and UMI.
Quality Control, Dimension-Reduction, and Clustering (Scanpy)
Under Python 3.7, Scanpy v1.8.1 was utilized for clustering, dimensionality reduction, and quality control. We used the following criteria to filter the expression matrix for each sample dataset: 1) Excluded were cells with a gene count of less than 200 or in the top 2%; 2) excluded were cells with a UMI count of less than 2%; 3) excluded were cells with a mitochondrial content of less than 10%; 4) excluded were genes expressed in fewer than 5 cells. The raw counts in each cell were used to normalize the raw count matrix, which was then logarithmically transformed into a normalized data matrix. The top 2000 variable genes were chosen using the flavor = “Seurat” setting. The scaled variable gene matrix underwent Principle Component Analysis (PCA), with the top 20 principal components being utilized for dimensional reduction and clustering. Cell clusters were visualized using Uniform Manifold Approximation and Projection (UMAP).25
Differentially Expressed Genes (DEGs) Analysis (Scanpy)
Using the scanpy.tl.rank_genes_groups() function, which is based on the Wilcoxon rank sum test with default parameters and selecting the genes expressed in more than 10% of the cells in either of the compared groups of cells and with an average log(Fold Change) value greater than 0.25 as differentially expressed genes (DEGs), we were able to identify DEGs. The value of 0.05 was used as the cutoff to assess the statistical significance of the adjusted p-value, which was determined using the Benjamin-Hochberg correction.
Pathway Enrichment Analysis
Using the “clusterProfiler” R package v4.0.0,26 Gene Ontology (GO) and Kyoto Encyclopedia of Genes and Genomes (KEGG) analysis were performed to look into the potential functions of neutrophils. The pathways with a p adj value of less than 0.05 were considered substantially enriched. Bar plots were used to display significant pathways that were chosen. Gene Ontology gene sets encompassing the categories of cellular component (CC), biological process (BP), and molecular function (MF) were utilized as a point of reference.
Cell Type Annotation
Cell-ID was used recognize Cell type. Cell-ID is a multivariate approach that uses hypergeometric tests (HGT) to identify the identity of each cell by extracting its gene signature. By projecting both genes and cells into the same low-dimensional space, multiple correspondence analysis was used to perform dimensionality reduction on the normalized gene expression matrix. To obtain each cell’s most featured gene sets, a gene ranking was then computed for each cell. HGT was performed on these gene sets in comparison to the brain reference from the SynEcoSys database, which includes the featured genes of every cell type. Due to each cell type having a minimal HGT p-value, the identity of each cell was determined. Each cell type’s frequency within a cluster was determined for cluster annotation, and the cell type with the highest frequency was selected as the cluster’s identity.27
Subtyping of Major Cell Types
Using the same techniques outlined above, cells from the particular cluster were extracted and reclustered for a more thorough examination to produce a high-resolution map of B cells, neutrophils, monocytes, T cells, and NK cells.
Filtering Cell Doublets
The expression pattern of canonical cell markers was used to estimate the number of cell doublets. Any clusters enriched with more than one marker specific to a particular cell type were disregarded for further examination.
UCell Gene Set Scoring
Scores for gene sets UCell v 2.2.0[1], an R package, were used to score gene sets. The Mann–Whitney U statistic, which ranks query genes according to their levels of expression in distinct cells, serves as the foundation for UCell scores. UCell is a rank-based scoring technique, making it appropriate for usage in sizable datasets with numerous samples and batches.28
Transcription Factor Regulatory Network Analysis (pySCENIC)
The transcription factor network was built with Pyscenic (v0.11.0) using the transcription factors in AnimalTFDB and the scRNA expression matrix. Initially, a regulatory network was predicted by GRNBoost2 using the co-expression of targets and regulators. After that, CisTarget was used to look for transcription factor binding motifs and eliminate indirect targets. Subsequently, AUCell was used to quantify the regulon activity for every cell. Regulon Specificity Scores (RSS) were used to identify cluster-specific TF regulons, and heatmaps were used to display their activity.29
Pseudotime Trajectory Analysis: Monocle2
By using Monocle2 v2.10.0, the cell differentiation trajectory of various monocyte subtypes was recreated. Seurat (v3.1.2) FindVairableFeatures() was used to select the top 2000 highly variable genes for the trajectory, and DDRTree() was used to reduce the dimensions. The plot_cell_trajectory() function in Monocle2 displayed the trajectory.30
RNA Velocity
RNA velocity For RNA velocity, BAM file containing neutrophil cells and reference genome GRCh38 were used in the analysis with velocyto (v0.17.17) and scVelo (v 0.2.3) in python. The analysis process included: (1) genes were first normalized, selecting the top 2000 genes, (2) principal components, nearest neighbors in PCA space, and first and second-order moments of the nearest neighbors were calculated (n_pcs = 30, n_neighbors = 30), (3) using the dynamical model from scVelo, RNA velocities were then estimated and (4) used to compute the velocities and velocity graph.31
Flow Cytometry
To identify CD10+CD11B++NEU and CD10−CD11B++NEU, we collected peripheral blood from control rats and EAV model rats. The blood of rats anesthetized with sodium pentobarbital was drawn via the abdominal aorta and subsequently placed into EDTA tubes. We took 250 μL of fresh blood, lysed the red blood cells using Lysing Buffer (555899, BD, USA) for 15 minutes at room temperature. The lysis reaction was terminated by adding PBS, and the samples were washed twice. The samples were then centrifuged at 400 g for 5 minutes, and the cell pellets were resuspended in 250 μL of PBS. Next, the samples were blocked with purified mouse anti-rat CD32 antibody (550270, BD, USA) for 10 minutes at 4°C. Following the blocking step, the cells were stained with flow cytometry antibodies CD45 (561586, BD, USA), CD11B (566867, BD, USA), CD10 (sc-46656PE, SantaCruz, USA), and RP-1 (566868, BD, USA) for 30 minutes at 4°C. After staining, the cells were washed with PBS to terminate the reaction. Finally, cells were resuspended with 300 μL PBS and 7-AAD (abs9104, Absin, China) was added to detect cell activity (percentage of live cells >85%) for subsequent flow cytometry analysis. The prepared samples were then analyzed using a flow cytometer (BD, USA) with appropriate excitation and emission wavelengths for each antibody, and the data were processed with FlowJo software to quantify the percentages of CD10+CD11B++NEU and CD10−CD11B++NEU cells in the samples.18
Cell Culture
The HL-60 cell line was obtained from Hysigen company. The cell line was tested to be free of mycoplasma contamination by culture. The HL-60 promyelocytic leukemia cell line, which differentiates into neutrophil-like cells upon dimethyl sulfoxide (DMSO) stimulation, was utilized for in vitro experiments. This well-established model has been extensively employed in AAV research to study neutrophil activation mechanisms.24 This model is also used to study the effects of the tumor microenvironment on neutrophil differentiation.32 To evaluate the effect of AAV serum on cell differentiation, HL-60 cells were cultured for 4 days in RPMI-1640 (C11875500BT, Gibco) basal medium supplemented with 1.3% DMSO (D8371, Solarbio) and 0.5% FBS (10091148, Gibco). After the initial differentiation period, the culture was continued for an additional 24 hours following the addition of 10% serum from either healthy pediatric donors (N=4) or pediatric AAV patients (N=4).
To investigate the role of glutamine metabolism in cell differentiation within an AAV microenvironment, the HL-60 cell line was cultured for 4 days in either complete RPMI-1640 medium (C11875500BT, Gibco) (N=4) or glutamine-free RPMI-1640 medium (21870076, Gibco)(N=4), both supplemented with 1.3% DMSO (D8371, Solarbio) and 0.5% FBS (10091148, Gibco). After the initial 4-day culture period, the cells were further incubated for an additional 24 hours following the addition of 10% serum from pediatric AAV patients to the culture medium.
CD11B (561690, BD, USA) levels were measured by flow cytometry to show the differentiation of HL-60 cells.
Glutamine Concentration Test
We measured glutamine concentrations in human blood plasma using a glutamine colorimetric kit (E-BC-K853-M, Elabscience).33
Gamma-Glutamyl Transpeptidase Test
The gamma-glutamyl transpeptidase in peripheral blood serum was measured using Gomma-Glutamyl Transferase Reagents (Siemens Healthineers).
Statistical Analysis
All statistical analyses were conducted using R and GraphPad Prism. The distribution of data was assessed for normality using appropriate methods. For conventional analyses (excluding single-cell sequencing), GraphPad Prism was used. Two-group comparisons were performed using either Student’s t-tests (paired or unpaired) or the nonparametric Wilcoxon signed-sum tests (paired or unpaired). Single-cell sequencing data were processed and analyzed entirely in R software. Specifically, gene expression comparisons between two groups were analyzed using unpaired two-tailed Wilcoxon rank-sum tests. Spearman correlation analysis was applied to evaluate associations between gene expression levels, gene feature scores, and cellular functions. Comparisons of cell distribution between paired control and AAV groups were conducted using paired two-tailed Wilcoxon rank-sum tests. Statistical significance is indicated by *p < 0.05, **p < 0.01 and ***p < 0.001.
Results
No Significant Change in the Proportion of Immune Cells in AAV
To study the changes in the immune system of AAV patients (The schematic diagram of the overall research workflow is presented in Figure 1), we collected a total of 18 blood samples from 3 healthy individuals and 12 patients with different types of AAV (Table 1 and Supplementary Table 1) for ScRNA-seq (Figure 2A). The cohort comprised 15 AAV samples, including 12 pediatric cases (aged 5–17 years) and 3 adult cases (aged 19–72 years). The pediatric samples consisted of: 6 MPO-ANCA-positive peripheral blood samples (3 without clinical evidence of renal involvement and 3 exhibiting renal manifestations including hematuria and proteinuria), 3 PR3-ANCA-positive peripheral blood samples, and 3 peripheral blood samples from MPO-ANCA-positive patients in treatment-induced remission. Following the filtering process, 125350 cells with an average of 2588 UMIs and 946 genes per cell were kept for the subsequent analyses. Based on typical marker genes, including T cells and Natural killer (NK) cells, B cells, Neutrophils, Monocytes, Plasma cells, Classical dendritic cells (cDCs), Platelets, and Erythrocytes34–39 (Figure 2B and C). We show the proportions of the different subpopulations in each sample (Figure 2D), with weak heterogeneity in blood samples from healthy individuals. In contrast, the cellular composition in AAV patient samples showed high heterogeneity, representing the complex peripheral blood microenvironment of different types of AAV patients. We grouped 18 samples according to different clinical phenotypes. The three normal control samples (from subjects C01, C02, and C03) were designated as the control(CON) group, while the 12 AAV samples of varying subtypes (from subjects P01-P12) were classified as the AAV group. Among these, six MPO-ANCA-positive samples (from P01-P06) were categorized as the AAV-before treatment (AAV-BT) group, and three post-treatment samples (from treated patients P01-P03) were assigned to the AAV-after treatment (AAV-AT) group (Supplementary Table 1 and Supplementary Figure 1). The samples were clinically typed (CON group, AAV group, AAV-BT group, AAV-AT group) for within-group comparisons of the percentages of different clusters did not reveal any significant differences (Figure 2E and F) (B cells were not extracted from 2 post-treatment AAV blood samples due to the use of rituximab40).
 |
Table 1 Clinical Characteristics of AAV Patients and Three Normal Controls |
 |
Figure 2 Transcriptional atlas of peripheral blood immune cells from healthy controls and AAV patients. (A) Schematic of the study design. A total of 18 study subjects were included in this study, including 3 blood samples from healthy donors, 12 blood samples from patients with different types of AAV, and 3 blood samples from patients after treatment. (B) Umap of 125350 cells from 18 donors. Each dot represents a single cell, colored according to cell type. (C) Bubble plots showing marker genes for different cell types. Colored by the average proportion of each gene in each subgroup across all clusters. Dot size represents the percentage of cells in each cluster that contain more than one corresponding gene read. (D) The bar graphs show the proportion of the population with the cell type shown for each patient and the number of cells of the different cell types. (E) The histogram shows intra-group comparisons between the AAV and CON groups for different cell types. (F) The histogram shows intra-group comparisons between AAV-before treatment (AAV-BT) and AAV-after treatment (AAV-AT) groups for different cell types. *P ≤ 0.05. |
Two Neutrophil Subsets Associated with AAV Pathogenesis Were Identified
We reclustered the neutrophils to obtain a total of 46623 high-quality cells, an unsupervised Umap of all cells (Figure 3A and Supplementary Figure 2), and received seven clusters, namely Neutrophils1-7. Bubble plots of labeled genes in each cluster are shown18,41 (Figure 3B). We found a high degree of similarity between the marker genes of Neutrophils2 and Neutrophils5. Based on membrane metalloendopeptidase (MME/CD10) expression42 (Figure 3C). Neutrophils5 were identified as a group of immature neutrophil subpopulations and the rest as mature neutrophil subpopulations. Next, the percentages of the different subpopulations in the CON and AAV groups were analyzed (Figure 3D).
 |
Figure 3 Two neutrophil subsets associated with AAV pathogenesis were identified. (A) Umap of 46623 cells coming from neutrophils. Each dot represents a single cell, colored according to different cell subpopulations. (B) Bubble plots showing marker genes for different neutrophil subclusters. Compared to other subgroups, these two subgroups show significantly higher expression of the ITGAM (CD11B) gene (as indicated within the red box in the figure). Colored by the average proportion of each gene in all clusters in each subpopulation. Dot size represents the percentage of cells containing more than one corresponding gene read in each cluster. (C) UMAP shows the expression of MME (CD10) in different neutrophil subsets. Each dot represents a cell, and the redder the color, the higher the expression. (D) The bar graphs demonstrate within-group comparisons of the AAV and CON groups for different subgroups of neutrophils. **P ≤ 0.01. (E) Heatmap showing analysis of differentially expressed genes of different neutrophil subsets. The red font represents the enriched pathways in Neutrophils2 and Neutrophils5. (F) An enrichment analysis of differentially expressed genes was obtained by comparing the CON and AAV groups of different neutrophil clusters. The circle size represents gene enrichment, and the redder color indicates greater functional significance. The red font indicates that Neutrophils2 and Neutrophils5 share the same enriched pathways. (G) Quantifying CD10+CD11B++ Neutrophils and CD10−CD11B++ Neutrophils from the peripheral blood of control rats (N=3) and experimental autoimmune vasculitis rats (N=3), which were obtained from flow cytometry. ***P ≤ 0.001; *P ≤ 0.05. |
In the percentage comparison between the CON and AAV groups, neutrophils2 were significantly increased in the different subpopulations, whereas neutrophils5 tended to increase. Analyzing the gene expression of Neutrophils5 and Neutrophils2, These 2 subsets of cells highly expressed migration and inflammatory-related factors, such as Integrin Subunit Alpha M (ITGAM(CD11B)), S100 Calcium Binding Protein A12 (S100A12), Matrix Metallopeptidase 9 (MMP9), High Mobility Group Box 2 (HMGB2), Peptidyl Arginine Deiminase 4 (PADI4), Arginase 1 (ARG1, immunosuppression-associated gene), and that Neutrophils5 expresses immature neutrophil signature markers (LCN2, CAMP, LTF). Neutrophils2 is a subset associated with immune responses (Figure 3E). The Gene Ontology (GO) pathways enriched in Neutrophils5 are all metabolism-related pathways, indicating that Neutrophils5 have high metabolic properties (Figure 3E). Enrichment analysis of DEGs obtained from within-group comparisons between the CON and AAV groups (Figure 3F) showed that Neutrophils2 and Neutrophils5 were enriched in granules-related pathways. In the condition of AAV, the observed increase in granular content in both Neutrophils2 and Neutrophils5 suggests an enhancement of their effector functions, including degranulation and neutrophil extracellular trap (NET) formation.5 Furthermore, the upregulation of ribosomal-related pathways in Neutrophils5 indicates a state of heightened metabolic and biosynthetic activity, facilitating large-scale protein production that may support proliferation, differentiation, or the execution of specific immune functions.
CD11B acts as a membrane protein and is a key gene in the degranulation, reactive oxygen species (ROS), and neutrophil extracellular traps (NETs) pathways (Supplementary Figures 3–4). To validate this data, we established a rat EAV model. The same phenomenon in the Experimental autoimmune vasculitis model of Rats, with an increased proportion of CD10+CD11B++ neutrophils and CD10−CD11B++ neutrophils in peripheral blood (Figure 3G and Supplementary Figure 5). In conclusion, we identified 2 groups (CD10−CD11B++ neutrophils and CD10+CD11B++ neutrophils) of pathogenic subsets of AAV.
The Increased Subset of Immature Neutrophils Suggests Enhancement of the Non-Classical Differentiation Pathway of Neutrophil
The classical view describes neutrophil development as originating from hematopoietic stem cells in the bone marrow, where they undergo granulopoiesis. During terminal maturation, the CXCR2-high immature neutrophil subset significantly upregulates CXCR2 expression. These cells subsequently egress into peripheral circulation through CXCR2-mediated chemotaxis in response to CXCL8 gradients.43 A minimal number of immature neutrophils are present in the peripheral blood.18 Neutrophils undergo terminal differentiation in the bone marrow before being released into the peripheral blood, but it has been demonstrated that “Neutrophil rejuvenation” can occur during inflammatory emergencies.44 This means that immature neutrophils can also be present in the peripheral blood, but the significance of the process here is not yet clear.
This phenomenon is also present in AAV. Then, we subjected neutrophils to a mimetic time-series analysis, and differentiation and maturation of concurrent neutrophils occurred in a tightly organized trajectory (Figure 4A and B). CD10−CD11B++ neutrophils are located at the beginning of the trajectory, and CD10+CD11B++ neutrophils show continuity with CD10−CD11B++ neutrophils. Next, we traced cell fate and reconstructed cell lineage direction using the RNA velocity approach (Figure 4C). We found that CD10+CD11B++ neutrophils are directly differentiated from CD10−CD11B++ neutrophils.
 |
Figure 4 The increased subset of immature neutrophils manifests enhancement of the non-classical differentiation pathway. (A and B) Monocle trajectories of neutrophil clusters. Each point corresponds to a single cell. (C) Velocity analysis reveals the origin and interrelationships of neutrophil subsets. Velocity fields were projected onto UMAP plots. (D) Heatmap showing the expression of transcription factors in neutrophils. (E) Heatmap showing the expression of transcription factors in the CON group and the AAV group. (F) Bubble plots showing the expression of CEBP family-related genes in different neutrophil clusters. (G) Bubble plots showing the expression of CEBP family-related genes in different neutrophil clusters in the CON group and the AAV group. (H) Identification of increased neutrophil marker CD11B of differentiated HL-60 cells. ***P ≤ 0.001. (I) Quantification of HL-60 cells CD11B++ neutrophils after stimulation by normal children’s serum (left, N=4) or in serum from pediatric AAV patients (right, N=4), data from flow analysis. The black box in the flow cytometry plot indicates the CD11B++ subpopulation. ***P ≤ 0.001. |
Next, we sought to analyze the transcription factor changes in neutrophils from AAV patients. We found that three new transcription factors, POU6F1, ZNF217, and ZNF788, were significantly expressed in CD10−CD11B++ neutrophils and CD10+CD11B++ neutrophils, suggesting that these factors are essential for subsets.
Meanwhile, the significant expression of the differentiation transcription factor CEBPA (CCAAT Enhancer Binding Protein Alpha) was detected in both CD10−CD11B++ neutrophils and CD10+CD11B++ neutrophils, which belongs to the CEBP family of transcription factors and plays an important role in homeostatic granulopoiesis. This also represents that CD10−CD11B++ neutrophils and CD10+CD11B++ neutrophils share the same direction of differentiation, and CEBPA-deficient progenitors produce a large number of granulocytes,45 and the reduced expression of CEBPA in CD10−CD11B++ neutrophils in the AAV condition also suggests that this is an abnormal differentiation. (Figure 4D and E). We complemented a set of CEBP family gene sets (Figure 4F and G), and we found that the expression of CEBPD (CCAAT Enhancer Binding Protein Delta, an important transcriptional activator of genes related to the regulation of immune and inflammatory responses) was significantly increased in CD10−CD11B++ neutrophils and CD10+CD11B++ neutrophils which implies that CEBPD is an important AAV-causing transcription factor.
By analyzing the transcription factors of different neutrophil subpopulations, we found significant changes in the transcription factors of the AAV groups of CD10−CD11B++ neutrophils and CD10+CD11B++ neutrophils compared to the CON group.
To investigate whether external microenvironmental factors influence abnormal neutrophil differentiation, we established a cell model using HL-60 cells (Figure 4H). Subsequently, DMSO-induced HL-60 cells were stimulated with 10% serum for 24 hours. Compared to serum from healthy children, treatment with serum from AAV patients resulted in an increased proportion of CD11B++ cells (Figure 4I).
We hypothesized that in the AAV setting, there would be an excess of immature CD10−CD11B++ neutrophil subsets in the peripheral blood and that the peripheral blood microenvironment promotes the differentiation of immature neutrophils toward CD10+CD11B++ neutrophils. We speculate that the non-classical differentiation can rapidly increase the proportion of CD10−CD11B++ neutrophils and CD10+CD11B++ neutrophils in the peripheral blood.
CD10−CD11B++ and CD10+CD11B++ Neutrophils are the Major Pathogenic Neutrophil Subsets in the AAV Condition
To further predict the function of individual neutrophils, we analyzed some specific DEGs and functional scores (Table 2). We made a gene set of genes involved in various antigen production by neutrophils (Figure 5A). Compared to other mature neutrophils, CD10−CD11B++ neutrophils significantly expressed antigen-related genes, which included MPO and PR3. We made a functional set of scores for the bacterial defense response pathways (Figure 5B), and we found that CD10−CD11B++ neutrophils scored significantly higher than the other subsets. We hypothesized that CD10−CD11B++ neutrophils were the first neutrophil subset to respond in the AAV situation. Only immature neutrophils can produce the antigens MPO and PR3; mature neutrophils use antigens produced and stored during immaturity.
 |
Table 2 List of Pathways Used to Calculate Neutrophil Functional Scores |
 |
Figure 5 Characteristics of the functions of CD10−CD11B++ neutrophils and CD10+CD11B++ neutrophils. (A) Bubble plots showing gene expression of antigenic gene sets in different neutrophil subsets. (B) Functional scoring of bacterial defense responses by different neutrophil subsets. (C) Heatmap showing the expression of neutrophil granule-associated genes in all neutrophil subsets. (D) Functional scores for azurophil granules, specific granules, tertiary granules, and secretory vesicles of different neutrophil clusters. Functional scores of NADPH oxidase complex (E), neutrophil activation (F), neutrophil degranulation (G), neutrophil extracellular trap formation (H), reactive oxygen species biosynthetic process (I), neutrophil chemotaxis (J), phagocytosis (K), apoptosis (L), and cell adhesion (M) of different neutrophil clusters. |
Granules are essential for neutrophils to function. Granule membranes contain proteins that respond to environmental cues, direct neutrophils to sites of infection, and initiate the production of bactericidal oxides.5 For this reason, we examined the expression of different granule genes in neutrophils including azurophil granules (primary granules), specific granules (secondary granules), gelatinase granules (tertiary granules), and secretory vesicles. We found that CD10−CD11B++ neutrophils were the granule functionally highest scoring subset, and CD10−CD11B++ neutrophils were the highest scoring subset of granule function among mature neutrophils (Figure 5C and D).
Next, we performed a series of functional scores for all neutrophil clusters and found that CD10−CD11B++ neutrophils and CD10+CD11B++ neutrophils had higher functional scores of NADPH oxidase, ROS, neutrophil activation, degranulation, phagocytosis, cell adherence, NETs, and apoptotic than the other subsets. The CD10+CD11B++ neutrophils had the highest chemotactic function score (Figure 5E–M).
To understand the functional changes of neutrophils in the disease situation, we also compared the changes in functional scores in the healthy situation and the AAV condition. We found that the granule function scores of these 2 groups of neutrophils increased significantly in the AAV condition. The functional scores for NADPH oxidase, ROS, neutrophil activation, neutrophil chemotaxis, neutrophil degranulation, phagocytosis, cellular adhesion, and neutrophil extracellular trapping networks (NETs) were all elevated (apoptosis scores of CD10−CD11B+ neutrophils and NADPH functional scores of CD10+CD11B++ neutrophils only tended to be elevated) (Figure 6A–J). Of these functions, ROS, degranulation, and NETs are closely associated with antigen production and endothelial injury.
 |
Figure 6 Functional changes of neutrophils in the AAV condition. (A) Changes in functional scores of azurophil granules, specific granules, tertiary granules, and secretory vesicles in different neutrophils comparing healthy and AAV conditions. Comparison of changes in functional scores of NADPH oxidase complex (B), neutrophil activation (C), neutrophil degranulation (D), neutrophil extracellular trap formation (E), reactive oxygen species biosynthetic process (F), neutrophil chemotaxis (G), phagocytosis (H), apoptosis (I), and cell adhesion (J) of different neutrophils in the healthy situation and the AAV condition. |
Metabolic Analysis of Neutrophil Subsets
Considering that neutrophil heterogeneity is multifactorial, in which intracellular metabolic changes play a crucial role, we explored the glucose metabolism, tricarboxylic acid metabolism, and lipid metabolism of neutrophils. We found that CD10−CD11B++ and CD10+CD11B++ neutrophils exhibited higher functional scores in glycolysis-gluconeogenesis, tricarboxylic acid cycle, oxidative phosphorylation, pentose phosphate pathway, the electron transport chain, and lipid metabolism compared to other neutrophil subsets, except for lower glutamine metabolic process (Figure 7A–G).
 |
Figure 7 Metabolic characteristics of neutrophil in AAV patients. Functional scores for Glycolysis-Gluconeogenesis (A), tricarboxylic acid cycle (B), oxidative phosphorylation (C), Pentose phosphate pathway (D), electron transport chain (E), lipid metabolic process (F), and glutamine metabolism (G) of different neutrophil subsets. Comparison of changes in functional scores for Glycolysis-Gluconeogenesis (H), tricarboxylic acid cycle (I), oxidative phosphorylation (J), Pentose phosphate pathway (K), electron transport chain (L), lipid metabolic process (M), and glutamine metabolism process (N) of different neutrophils in the healthy and AAV conditions. |
In the AAV condition, CD10+CD11B++ neutrophils showed a significant increase in metabolic scores in the above pathways, and CD10−CD11B++ neutrophils showed a significant increase in functional scores in the metabolic pathways: Oxidative phosphorylation, Pentose phosphate pathway, Electron transport chain, Lipid metabolic (Figure 7H–N). We also found that glutamine metabolic process scores (glutamine and cystine are necessary for glutathione synthesis) were significantly decreased in the AAV situation.
Increasing Neutrophil Glutamine Metabolism May Be a Strategy for AAV Treatment
Continuing to analyze the changes in the different metabolic pathways of CD10+CD11B++ neutrophils among the CON group, AAV group, and AAV-AT group. We found that glutamine metabolism was significantly lower in CD10+CD11B++ neutrophils in the AAV group compared to the CON group. Glutamine metabolism was significantly higher in the AAV-AT group compared to the AAV group (Figure 8A–C).
 |
Figure 8 Glutamine metabolism analysis of CD10+CD11B++ neutrophils. (A) Heatmap showing changes in different metabolic pathways of CD10+CD11B++(N2) in different subgroups (CON group, AAV group, AAV-after treatment(AAV-AT)). (B) Functional scores of glutamine metabolism in different subgroups (CON group, AAV group, AAV-AT group) for CD10−CD11B++(N5) neutrophils. (C) Functional scores of glutamine metabolism in different subgroups (CON group, AAV group, AAV-AT) for CD10+CD11B++(N2) neutrophils. (D) Plasma glutamine concentrations were measured by colorimetric assay in normal children (N=6) and in pediatric AAV patients (N=6). *P≤0.05. (E) Comparison of Gamma-glutamyl transpeptidase(GGT) levels between acute phase and final post-treatment follow-up in single-cell sequenced patients with available follow-up (Supplementary Table 1, N=6). **P≤0.01. (F) Comparison of GGT levels between acute phase and final post-treatment follow-up in clinically treated patients (excluding single-cell sequenced cohort, Supplementary Table 2, N=21). **P≤0.01. (G) Quantification of CD11B++ neutrophils in HL-60 cells after stimulation with glutamine-containing medium (N=4) or without glutamine-containing medium (N=4), data from flow experiments. The black box in the flow cytometry plot indicates the CD11B++ subpopulation. ***P≤0.001. |
We have validated this finding by testing plasma samples and clinical data. Plasma glutamine concentrations in pediatric AAV patients were lower than those in normal children (Figure 8D). Among the 12 AAV patients whose samples were used for single-cell sequencing, 6 cases with available follow-up data showed significantly increased gamma-glutamyl transpeptidase (GGT) levels after treatment. To further validate this clinical observation, we retrospectively analyzed 21 additional AAV cases (excluding the original single-cell sequenced cohort) treated at our institution. The results consistently demonstrated marked increases in GGT levels post-therapy (Figure 8E and F and Supplementary Tables 1–2).
To explore the significance of increasing neutrophil glutamine metabolism levels, HL-60 cells were cultured in either glutamine-containing or glutamine-free medium. We found that the proportion of the CD11B++ subset was reduced in HL-60 cells cultured in glutamine-containing medium compared with those cultured in glutamine-free medium. These results suggest that enhancing neutrophil glutamine metabolism could serve as a potential therapeutic target for AAV. (Figure 8G).
Discussion
AAV is a systemic severe autoimmune vasculitis involving multiple organs. The study of pediatric AAV presents a unique challenge due to its rarity and the variability in clinical manifestations across different regions, races, and age groups.46–48 Neutrophils are the effector cells of the innate immune system, but their inherent fragility and tendency to undergo cell death in vitro have limited our understanding of their heterogeneity in infection diseases, as well as in immune-associated diseases.11 Given that neutrophils are increasingly being acknowledged for their pathogenicity in AAV, we recruited healthy individuals and AAV patients to comprehensively explore the peripheral blood neutrophil heterogeneity in AAV situation by single-cell sequencing. Until now, our study is the first exploration of neutrophils in pediatric AAV by single-cell sequencing (Figure 9).
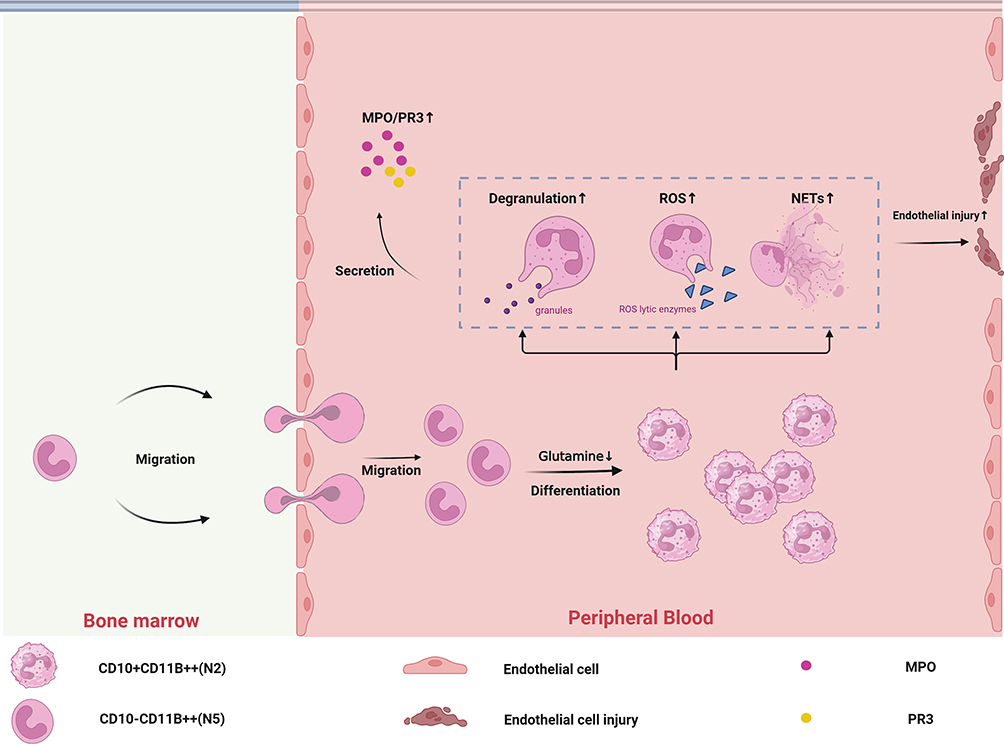 |
Figure 9 Schematic outline showing the heterogeneity of neutrophils in the AAV condition. 1. In the AAV setting, there is an excess of immature CD10−CD11B++ neutrophil subpopulations present in the peripheral blood, and the peripheral blood microenvironment promotes the differentiation of immature neutrophils toward CD10+CD11B++. 2. This differentiation pathway leads to an increased percentage of CD10+CD11B++ neutrophils in peripheral blood. 3.CD10+CD11B++ neutrophils showed more substantial functions (ROS, NETs, degranulation) than other mature neutrophils. 4. An increased proportion of CD10+CD11B++ neutrophils leads to an increased ability of neutrophils to produce antigens and damage endothelial cells. 5. The low glutamine microenvironment in peripheral blood promotes differentiation of CD10−CD11B++ neutrophils toward CD10+CD11B++ neutrophils. |
We found no significant change in the overall percentage of neutrophils in the AAV condition. However, we reclustered neutrophils and found 2 subsets (CD10+CD11B++ and CD10−CD11B++) of neutrophils elevated in AAV disease. These 2 subsets of cells are present in different types of AAV. While our study primarily focuses on pediatric AAV, we unexpectedly discovered that these two cell populations also exhibit pathogenic significance in adult AAV. Neutrophils2 (CD10+CD11B++) are a subset of inflammatory and migration-associated mature neutrophils.49–55 Neutrophils5 (CD10−CD11B++) is a subset of immature neutrophils that enter the peripheral blood in excess in the AAV situation. The phenomenon of excess immature neutrophils appearing in the peripheral blood is not only seen in AAV, but we also find it in inflammatory and immunologic diseases such as systemic lupus erythematosus (SLE) and sepsis.56,57 However, the significance of this phenomenon has not been fully explored. Physiologically, immature neutrophils complete terminal differentiation in the bone marrow. This process is accomplished in the bone marrow microenvironment. The presence of immature neutrophils in the peripheral blood causes his differentiation to be influenced by the peripheral blood microenvironment. By exploring AAV single-cell data, we found that the microenvironment created by AAV disease promotes immature neutrophils that will differentiate in a specific direction. This result leads to an increased proportion of CD10+CD11B++ neutrophils.
CD10−CD11B++ neutrophils and CD10+CD11B++ neutrophils showed more substantial functions than other neutrophil subsets, including neutrophil activation, ROS, NETs, degranulation, NADPH oxidative complexes, phagocytosis, cell adhesion, apoptosis. CD10−CD11B++ neutrophils still have the ability to express the antigenic genes MPO and PR3 capacity (This may be an important reason why the function associated with antigen production by CD10−CD11B++ neutrophils is the strongest). CD10+CD11B++ neutrophils had the strongest chemotaxis scores. ROS, NETs, and degranulation are key functions of neutrophils in antigen production and damage to endothelial cells. This implies that CD10−CD11B++ neutrophils and CD10+CD11B++ neutrophils are key subsets of antigen production and endothelial cell damage in AAV disease.11 The proportion of CD10−CD11B++ in peripheral blood is small and its contribution to AAV pathogenicity is uncertain. In addition, there is leukocyte transendothelial migration in the CD10+CD11B++ neutrophils enrichment pathway, which may result in CD10+CD11B++ neutrophils being more likely to cross endothelial cells to localized tissues causing vasculitis in AAV.
We found that CD10−CD11B++ neutrophils and CD10+CD11B++ neutrophils metabolism and function are significantly similar. This may be inextricably linked to the fact that the 2 subsets are directly differentiated. Metabolism is the basis of function.58 For example, we know that neutrophil ROS production is mainly through anaerobic metabolism, including glycolytic metabolism and pentose phosphate metabolism. Glutathione is required to neutralize ROS.59 CD10+CD11B++ neutrophils have a more substantial ROS function because of increased glycolytic metabolism, pentose phosphate metabolism, and decreased glutamine metabolism.
In the AAV situation, we observed that there would be an excess of immature CD10−CD11B++ neutrophil subpopulations in the peripheral blood and that the peripheral blood microenvironment promotes the differentiation of immature neutrophils toward CD10+CD11B++. This is the nonclassical differentiation pathway that distinguishes it from the classical differentiation pathway (where differentiation is completed in the bone marrow18). We also found significant changes in the intracellular differentiation-related transcription factors CEBPA and CEBPD. Thus, the pathogenic subset may arise as a result of a combination of the AAV peripheral blood microenvironment (eg, low-glutamine microenvironment) and intracellular factors (eg, CEBPA and CEBPD). These factors promote a nonclassical differentiation pathway. We speculate that investigating methods to block this non-canonical pathway may hold significant therapeutic implications for AAV treatment. It was found that low glutamine might be one of the key pathogenic factors in the peripheral blood microenvironment, which have also demonstrated in vitro experiments: increasing neutrophil glutamine metabolism reduces the production of pathogenic neutrophil subpopulations. This suggests that increasing neutrophil glutamine metabolism by increasing peripheral blood glutamine concentrations and GGT levels may be an important potential target of AAV.
The presence of immature neutrophils in peripheral blood has been previously documented in AAV, as evidenced by prior single-cell sequencing studies in adult AAV patients.13 However, these studies only provided limited characterization, primarily associating them with low-density neutrophils without further mechanistic exploration. Notably, a dedicated single-cell study on inflammatory conditions systematically investigated neutrophil differentiation trajectories, revealing that immature neutrophils exhibit distinct differentiation pathways in bone marrow versus peripheral blood under physiological conditions. Under inflammatory states, this study observed both an expansion of immature neutrophils and their preferential differentiation toward an interferon-stimulated gene (ISG)-associated neutrophil phenotype.18 Complementary findings from cancer single-cell sequencing studies further demonstrate that metabolic reprogramming within the tumor microenvironment can drive neutrophil differentiation along alternative pathways. These collective findings suggest that neutrophil heterogeneity is dynamically regulated by microenvironmental cues across disease contexts.32
Although we showed a large number of gene expression and signaling pathway changes in AAV by bioinformatics analysis, the specific biological significance of these changes was not fully clarified; on the other hand, pediatric AAV is a rare disease, and the scarcity of samples may lead to unstable or biased results of the analyses, so it is also necessary to obtain a sufficient number and quality of biological samples (eg, blood, tissues, etc.) for in-depth experimental validation and biological studies to elucidate the underlying mechanisms of these changes. A noted limitation is the variability in neutrophil percentages (from <5% to ~50%), likely due to the selective loss of these fragile cells during whole blood processing. This inherent technical issue may bias analyses based on these measures. While the data provide strong preliminary evidence for the proposed mechanistic model, further validation in larger, multi-centre pediatric cohorts are warranted to confirm these observations and evaluate the generalizability of the findings.
Conclusion
In conclusion, this study used scRNA-seq to characterize the immune cell profile in the peripheral blood of AAV patients and delineate neutrophil heterogeneity within this context. Our results suggest that blocking the non-classical neutrophil differentiation pathway may represent a potential therapeutic strategy for AAV, while enhancing glutamine metabolism in neutrophils could offer a means to reverse this pathogenic differentiation process. However, given the exploratory nature of this research, these findings should be interpreted as preliminary. Nonetheless, this work provides valuable data for further investigation into neutrophil heterogeneity across different pathological conditions and proposes novel directions for targeted therapy in immune-mediated diseases.
Data Sharing Statement
The raw data supporting the conclusions of this article will be made available by the authors, without undue reservation.
Ethics Approval Statement
The study was approved by the Ethics Committee of the Children’s Hospital of Chongqing Medical University (Approval Number: 149/2022). Animal experiments complied with the 3R Principles, and human studies followed the Declaration of Helsinki.
Acknowledgments
Written informed consent was obtained from each participant (and/or their parent or legal guardian in the case of minors) after a detailed explanation of the study’s purpose, procedures, potential risks, and benefits.
Author Contributions
All authors made a significant contribution to the work reported, whether that is in the conception, study design, execution, acquisition of data, analysis and interpretation, or in all these areas; took part in drafting, revising or critically reviewing the article; gave final approval of the version to be published; have agreed on the journal to which the article has been submitted; and agree to be accountable for all aspects of the work.
Funding
This research was sponsored by the National Key R&D Program of China (Grant Number: 2021YFC2702002).
Disclosure
The authors report no conflicts of interest in this work.
References
1. Nakazawa D, Masuda S, Tomaru U, Ishizu A. Author correction: pathogenesis and therapeutic interventions for ANCA-associated vasculitis. Nat Revi Rheumatol. 2019;15(2):123. doi:10.1038/s41584-019-0168-z
2. Falk RJ, Jennette JC. Anti-neutrophil cytoplasmic autoantibodies with specificity for myeloperoxidase in patients with systemic vasculitis and idiopathic necrotizing and crescentic glomerulonephritis. New England J Med. 1988;318(25):1651–23. doi:10.1056/NEJM198806233182504
3. Lüdemann J, Utecht B, Gross WL. Anti-neutrophil cytoplasm antibodies in Wegener’s granulomatosis recognize an elastinolytic enzyme. J Exper Med. 1990;171(1):357–362. doi:10.1084/jem.171.1.357
4. Mócsai A. Diverse novel functions of neutrophils in immunity, inflammation, and beyond. J Exper Med. 2013;210(7):1283–1299.
5. Cowland JB, Borregaard N. Granulopoiesis and granules of human neutrophils. Immunol Rev. 2016;273(1):11–28. doi:10.1111/imr.12440
6. Lawrence SM, Corriden R, Nizet V. The ontogeny of a neutrophil: mechanisms of granulopoiesis and homeostasis. Microbiol Mol Biol Rev. 2018;82(1). doi:10.1128/MMBR.00057-17
7. Marini O, Costa S, Bevilacqua D, et al. Mature CD10(+) and immature CD10(-) neutrophils present in G-CSF-treated donors display opposite effects on T cells. Blood. 2017;129(10):1343–1356. doi:10.1182/blood-2016-04-713206
8. Sagiv JY, Michaeli J, Assi S, et al. Phenotypic diversity and plasticity in circulating neutrophil subpopulations in cancer. Cell Rep. 2015;10(4):562–573. doi:10.1016/j.celrep.2014.12.039
9. Ui Mhaonaigh A, Coughlan AM, Dwivedi A, et al. Low density granulocytes in ANCA vasculitis are heterogenous and hypo-responsive to anti-myeloperoxidase antibodies. Front Immunol. 2019;10:2603. doi:10.3389/fimmu.2019.02603
10. Abdulahad WH, Lamprecht P, Kallenberg CG. T-helper cells as new players in ANCA-associated vasculitides. Arthritis Res Ther. 2011;13(4):236. doi:10.1186/ar3362
11. Kitching AR, Anders H-J, Basu N, et al. ANCA-associated vasculitis. Nat Rev Dis Primers. 2020;6(1). doi:10.1038/s41572-020-0204-y
12. Williams JM, Ben-Smith A, Hewins P, et al. Activation of the G(i) heterotrimeric G protein by ANCA IgG F(ab’)2 fragments is necessary but not sufficient to stimulate the recruitment of those downstream mediators used by intact ANCA IgG. J Am Soc Nephrol. 2003;14(3):661–669. doi:10.1097/01.ASN.0000050223.34749.F4
13. Nishide M, Nishimura K, Matsushita H, et al. Neutrophil single-cell analysis identifies a type II interferon-related subset for predicting relapse of autoimmune small vessel vasculitis. Nat Commun. 2025;16(1):3581. doi:10.1038/s41467-025-58550-7
14. Cruzat V, Macedo Rogero M, Noel Keane K, Curi R, Newsholme P. Glutamine: metabolism and immune function, supplementation and clinical translation. Nutrients. 2018;10(11):1564. doi:10.3390/nu10111564
15. Hellenthal KEM, Thomas K, Ludwig N, et al. Glutamine modulates neutrophil recruitment and effector functions during sterile inflammation. J Leukoc Biol. 2025;117(3). doi:10.1093/jleuko/qiae243
16. Thind MK, Uhlig HH, Glogauer M, et al. A metabolic perspective of the neutrophil life cycle: new avenues in immunometabolism. Front Immunol. 2023;14:1334205. doi:10.3389/fimmu.2023.1334205
17. Willcocks LC, Lyons PA, Rees AJ, Smith KG. The contribution of genetic variation and infection to the pathogenesis of ANCA-associated systemic vasculitis. Arthritis Res Ther. 2010;12(1):202. doi:10.1186/ar2928
18. Xie X, Shi Q, Wu P, et al. Single-cell transcriptome profiling reveals neutrophil heterogeneity in homeostasis and infection. Nature Immunology. 2020;21(9):1119–1133. doi:10.1038/s41590-020-0736-z
19. Qi X, Yu Y, Sun R, et al. Identification and characterization of neutrophil heterogeneity in sepsis. Crit Care. 2021;25(1):50. doi:10.1186/s13054-021-03481-0
20. Holm SR, Jenkins BJ, Cronin JG, Jones N, Thornton CA. A role for metabolism in determining neonatal immune function. Pediatr Allergy Immunol. 2021;32(8):1616–1628. doi:10.1111/pai.13583
21. Takahashi K, Oharaseki T, Yokouchi Y, Katsuzaki J, Enomoto Y. Overview of the 2012 revised international chapel hill consensus conference nomenclature of vasculitides (CHCC2012). Nihon Jinzo Gakkai Shi. 2014;56(2):70–79.
22. Watts R, Lane S, Hanslik T, et al. Development and validation of a consensus methodology for the classification of the ANCA-associated vasculitides and polyarteritis nodosa for epidemiological studies. Ann Rheum Dis. 2007;66(2):222–227. doi:10.1136/ard.2006.054593
23. Little MA, Smyth L, Salama AD, et al. Experimental autoimmune vasculitis: an animal model of anti-neutrophil cytoplasmic autoantibody-associated systemic vasculitis. Am J Pathol. 2009;174(4):1212–1220. doi:10.2353/ajpath.2009.080458
24. Wang RX, Wang LY, Han XY, et al. FTY720 ameliorates experimental MPO-ANCA-associated vasculitis by regulating fatty acid oxidation via the neutrophil PPARα-CPT1a pathway. Rheumatology. 2024;63(9):2578–2589. doi:10.1093/rheumatology/keae320
25. Wolf FA, Angerer P, Theis FJ. SCANPY: large-scale single-cell gene expression data analysis. Genome Biology. 2018;19(1). doi:10.1186/s13059-017-1382-0
26. Yu G, Wang LG, Han Y, He QY. clusterProfiler: an R package for comparing biological themes among gene clusters. Omics. 2012;16(5):284–287. doi:10.1089/omi.2011.0118
27. Cortal A, Martignetti L, Six E, Rausell A. Gene signature extraction and cell identity recognition at the single-cell level with Cell-ID. Nat Biotechnol. 2021;39(9):1095–1102. doi:10.1038/s41587-021-00896-6
28. Andreatta M, Carmona SJ. UCell: robust and scalable single-cell gene signature scoring. Comput Struct Biotechnol J. 2021;19:3796–3798. doi:10.1016/j.csbj.2021.06.043
29. Van de Sande B, Flerin C, Davie K, et al. A scalable SCENIC workflow for single-cell gene regulatory network analysis. Nat Protoc. 2020;15(7):2247–2276. doi:10.1038/s41596-020-0336-2
30. Qiu X, Hill A, Packer J, Lin D, Ma YA, Trapnell C. Single-cell mRNA quantification and differential analysis with Census. Nat Methods. 2017;14(3):309–315. doi:10.1038/nmeth.4150
31. Bergen V, Lange M, Peidli S, Wolf FA, Theis FJ. Generalizing RNA velocity to transient cell states through dynamical modeling. Nat Biotechnol. 2020;38(12):1408–1414. doi:10.1038/s41587-020-0591-3
32. Wang L, Liu Y, Dai Y, et al. Single-cell RNA-seq analysis reveals BHLHE40-driven pro-tumour neutrophils with hyperactivated glycolysis in pancreatic tumour microenvironment. Gut. 2023;72(5):958–971. doi:10.1136/gutjnl-2021-326070
33. Wan Y, Chen M, Li X, et al. Single-cell RNA sequencing reveals XBP1-SLC38A2 axis as a metabolic regulator in cytotoxic T lymphocytes in multiple myeloma. Cancer Lett. 2023;562:216171. doi:10.1016/j.canlet.2023.216171
34. Gong L, Kwong DL, Dai W, et al. Comprehensive single-cell sequencing reveals the stromal dynamics and tumor-specific characteristics in the microenvironment of nasopharyngeal carcinoma. Nat Commun. 2021;12(1):1540. doi:10.1038/s41467-021-21795-z
35. Wu F, Fan J, He Y, et al. Single-cell profiling of tumor heterogeneity and the microenvironment in advanced non-small cell lung cancer. Nat Commun. 2021;12(1):2540. doi:10.1038/s41467-021-22801-0
36. Nath A, Cosgrove PA, Mirsafian H, et al. Evolution of core archetypal phenotypes in progressive high grade serous ovarian cancer. Nat Commun. 2021;12(1):3039.
37. Arazi A, Rao DA, Berthier CC, et al. The immune cell landscape in kidneys of patients with lupus nephritis. Nat Immunol. 2019;20(7):902–914. doi:10.1038/s41590-019-0398-x
38. Li Q, Zhu Z, Wang L, et al. Single-cell transcriptome profiling reveals vascular endothelial cell heterogeneity in human skin. Theranostics. 2021;11(13):6461–6476. doi:10.7150/thno.54917
39. Saichi M, Ladjemi MZ, Korniotis S, et al. Single-cell RNA sequencing of blood antigen-presenting cells in severe COVID-19 reveals multi-process defects in antiviral immunity. Nat Cell Biol. 2021;23(5):538–551.
40. Pendergraft WF, Cortazar FB, Wenger J, et al. Long-term maintenance therapy using rituximab-induced continuous B-cell depletion in patients with ANCA vasculitis. Clin J Am Soc Nephrol. 2014;9(4):736–744. doi:10.2215/CJN.07340713
41. Schulte-Schrepping J, Reusch N, Paclik D, et al. Severe COVID-19 Is Marked by a Dysregulated Myeloid Cell Compartment. Cell. 2020;182(6):1419–1440.e1423. doi:10.1016/j.cell.2020.08.001
42. Quail DF, Amulic B, Aziz M, et al. Neutrophil phenotypes and functions in cancer: a consensus statement. J Exp Med. 2022;219(6). doi:10.1084/jem.20220011
43. Németh T, Sperandio M, Mócsai A. Neutrophils as emerging therapeutic targets. Natu Rev Drug Discovery. 2020;19(4):253–275. doi:10.1038/s41573-019-0054-z
44. Hidalgo A, Chilvers ER, Summers C, Koenderman L. The Neutrophil Life Cycle. Trends Immunol. 2019;40(7):584–597. doi:10.1016/j.it.2019.04.013
45. Avellino R, Havermans M, Erpelinck C, et al. An autonomous CEBPA enhancer specific for myeloid-lineage priming and neutrophilic differentiation. Blood. 2016;127(24):2991–3003. doi:10.1182/blood-2016-01-695759
46. Calatroni M, Consonni F, Allinovi M, et al. Prognostic factors and long-term outcome with ANCA-associated kidney vasculitis in childhood. Clin J Am Soc Nephrol. 2021;16(7):1043–1051. doi:10.2215/CJN.19181220
47. Jariwala M, Laxer RM. Childhood GPA, EGPA, and MPA. Clin Immunol. 2020;211:108325. doi:10.1016/j.clim.2019.108325
48. Hirano D, Ishikawa T, Inaba A, et al. Epidemiology and clinical features of childhood-onset anti-neutrophil cytoplasmic antibody-associated vasculitis: a clinicopathological analysis. Pediatr Nephrol. 2019;34(8):1425–1433. doi:10.1007/s00467-019-04228-4
49. Feng Q, Guo Q, Yu W, et al. PADI4 negatively regulates RIG-I-mediated antiviral response through deacetylation of IFN-β promoter via HDAC1. Biochim Biophys Acta Mol Basis Dis. 2024;1870(4):167092. doi:10.1016/j.bbadis.2024.167092
50. Zhang Y, Zhao Z, Zhao X, et al. HMGB2 causes photoreceptor death via down-regulating Nrf2/HO-1 and up-regulating NF-κB/NLRP3 signaling pathways in light-induced retinal degeneration model. Free Radic Biol Med. 2022;181:14–28. doi:10.1016/j.freeradbiomed.2022.01.018
51. Takino T, Koshikawa N, Miyamori H, et al. Cleavage of metastasis suppressor gene product KiSS-1 protein/metastin by matrix metalloproteinases. Oncogene. 2003;22(30):4617–4626. doi:10.1038/sj.onc.1206542
52. Yang Z, Yan WX, Cai H, et al. S100A12 provokes mast cell activation: a potential amplification pathway in asthma and innate immunity. J Allergy Clin Immunol. 2007;119(1):106–114. doi:10.1016/j.jaci.2006.08.021
53. Schleiffenbaum B, Moser R, Patarroyo M, Fehr J. The cell surface glycoprotein Mac-1 (CD11b/CD18) mediates neutrophil adhesion and modulates degranulation independently of its quantitative cell surface expression. J Immunol. 1989;142(10):3537–3545. doi:10.4049/jimmunol.142.10.3537
54. Silva JC, Rodrigues NC, Thompson-Souza GA, Muniz VS, Neves JS, Figueiredo RT. Mac-1 triggers neutrophil DNA extracellular trap formation to Aspergillus fumigatus independently of PAD4 histone citrullination. J Leukoc Biol. 2020;107(1):69–83. doi:10.1002/JLB.4A0119-009RR
55. Siddiqi M, Garcia ZC, Stein DS, Denny TN, Spolarics Z. Relationship between oxidative burst activity and CD11b expression in neutrophils and monocytes from healthy individuals: effects of race and gender. Cytometry. 2001;46(4):243–246. doi:10.1002/cyto.1134
56. Kwok AJ, Allcock A, Ferreira RC, et al. Neutrophils and emergency granulopoiesis drive immune suppression and an extreme response endotype during sepsis. Nat Immunol. 2023;24(5):767–779. doi:10.1038/s41590-023-01490-5
57. Tay SH, Celhar T, Fairhurst AM. Low-density neutrophils in systemic lupus erythematosus. Arthritis Rheumatol. 2020;72(10):1587–1595. doi:10.1002/art.41395
58. Ng LG, Ostuni R, Hidalgo A. Heterogeneity of neutrophils. Nat Rev Immunol. 2019;19(4):255–265. doi:10.1038/s41577-019-0141-8
59. Koppula P, Zhang Y, Zhuang L, Gan B. Amino acid transporter SLC7A11/xCT at the crossroads of regulating redox homeostasis and nutrient dependency of cancer. Cancer Commun. 2018;38(1):12. doi:10.1186/s40880-018-0288-x
 © 2026 The Author(s). This work is published and licensed by Dove Medical Press Limited. The
full terms of this license are available at https://www.dovepress.com/terms
and incorporate the Creative Commons Attribution
- Non Commercial (unported, 4.0) License.
By accessing the work you hereby accept the Terms. Non-commercial uses of the work are permitted
without any further permission from Dove Medical Press Limited, provided the work is properly
attributed. For permission for commercial use of this work, please see paragraphs 4.2 and 5 of our Terms.
© 2026 The Author(s). This work is published and licensed by Dove Medical Press Limited. The
full terms of this license are available at https://www.dovepress.com/terms
and incorporate the Creative Commons Attribution
- Non Commercial (unported, 4.0) License.
By accessing the work you hereby accept the Terms. Non-commercial uses of the work are permitted
without any further permission from Dove Medical Press Limited, provided the work is properly
attributed. For permission for commercial use of this work, please see paragraphs 4.2 and 5 of our Terms.
Recommended articles
PI3 as a Common Hub Gene Linking Atopic Dermatitis and Ulcerative Colitis Through Immune Cell Recruitment Mechanisms
Jian D, Chen J, Yuan J, Namrata K, Su D, Bai B
Journal of Inflammation Research 2025, 18:11853-11868
Published Date: 27 August 2025