Back to Journals » Neuropsychiatric Disease and Treatment » Volume 16
Similar and Different Regional Homogeneity Changes Between Bipolar Disorder and Unipolar Depression: A Resting-State fMRI Study
Authors Liu P ![]() , Li Q
, Li Q ![]() , Zhang A, Liu Z, Sun N, Yang C
, Zhang A, Liu Z, Sun N, Yang C ![]() , Wang Y, Zhang K
, Wang Y, Zhang K ![]()
Received 12 February 2020
Accepted for publication 9 April 2020
Published 28 April 2020 Volume 2020:16 Pages 1087—1093
DOI https://doi.org/10.2147/NDT.S249489
Checked for plagiarism Yes
Review by Single anonymous peer review
Peer reviewer comments 2
Editor who approved publication: Dr Jun Chen
Penghong Liu,1,2 Qi Li,1,2 Aixia Zhang,1 Zhifen Liu,1 Ning Sun,1 Chunxia Yang,1 Yanfang Wang,1 Kerang Zhang1
1Department of Psychiatry, First Hospital of Shanxi Medical University, Taiyuan 030001, People’s Republic of China; 2Department of Psychiatry, Shanxi Medical University, Taiyuan 030001, People’s Republic of China
Correspondence: Yanfang Wang; Kerang Zhang
Department of Psychiatry, First Hospital of Shanxi Medical University, Taiyuan 030001, People’s Republic of China
Tel +86-13934556065
; +86-18834180209
Email [email protected]; [email protected]
Objective: To investigate the regional homogeneity (ReHo) between unipolar depression (UD) and bipolar disorder (BD), and to search for brain imaging markers for distinguishing UD and BD.
Methods: A total of 58 patients who met the diagnosis criteria of UD in DSM–Ⅳ, 40 patients who met the diagnosis criteria of BD in DSM-Ⅳ and 54 healthy controls (HC) completed the resting-state functional magnetic resonance (rs-fMRI) scans. The ReHo of the three groups was compared and Pearson correlation analysis was performed between the ReHo values and the clinical symptoms.
Results: (1) Significant differences were found in the right hippocampus, right parahippocampal gyrus, right Inferior orbitofrontal gyrus, right superior temporal gyrus, right inferior temporal gyrus, and right middle occipital gyrus across the three groups. (2) Compared to HC, the ReHo in the right parahippocampal gyrus in UD significantly increased. (3) When compared to HC, the ReHo in the right hippocampus in BD significantly increased. The ReHo in the right middle occipital gyrus decreased. (4) Compared to UD, BD exhibited significantly decreased ReHo in the right inferior temporal gyrus. No correlations were observed between the scores of 24-item Hamilton Depression Rating Scale (HDMD-24), Hamilton Anxiety Scale (HAMA), Young Mania Rating Scale (YMRS), and the ReHo values of altered brain regions between BD and UD.
Conclusion: The results suggest that there was a considerable difference in the ReHo of brain among UD, BD, and HCs. ReHo in the right inferior temporal gyrus showed significant differences between BD and UD that might serve as neuroimaging markers to identify BD and UD.
Keywords: bipolar depression, unipolar depression, rs-fMRI, regional homogeneity
Introduction
Bipolar disorder (BD) is a debilitating illness in which individuals experiencing both manic and depressed moods, causing impaired social functioning, diminished quality of life, and increased mortality due to suicide.1 Unipolar depression (UD) and BD are both characterized by depressive moods. Therefore, it is difficult to distinguish BD from UD in clinical practice and often resulting in misdiagnosed BD.2 Studies report that nearly 60% of patients with BD have been previously misdiagnosed for recurrent UD and the average duration of misdiagnosis is 7.5 to 9.8 years.3,4 Improper treatment of these patients increases the risk of manic episodes as well as the possibility of progressing to Rapid-Cycling Disorder, which is more difficult to treat.5,6 It may take 10 years or even longer to correct the diagnosis, in which case the patient will have spent a significant amount of money on medical expenses targeting the wrong condition. Misdiagnosis and incorrect treatment. Misdiagnosis and incorrect treatment causes significant distress to the patient and likewise a heavy burden on family and society.7,8 In order to provide proper treatment, it is thus necessary to search for reliable biological markers to promote early and accurate identification of the two diseases.
Resting-state functional magnetic resonance imaging (rs-fMRI) is a non-invasive procedure based on blood-oxygen-level-dependent (BOLD) neuroimaging technology. Studies have shown that rs-fMRI can be used to study the pathophysiology of mental illnesses.5 Regional homogeneity (ReHo) is a commonly used method of rs-fMRI data analysis, which reflects the synchronized neural activity in functionally related brain regions. Many studies have reported that changes in ReHo values are related to abnormal brain activity.9 ReHo is widely used in the study of various mental disorders and has been demonstrated to have a high test–retest reliability in the study of the consistency of brain activity.10,11 A large amount of evidence has shown a correlation between the ReHo value of abnormal brain areas and clinical symptoms, as well as scores of the Hamilton Rating Scale for Depression (HRSD). Therefore, ReHo values can be used as an effective indicator to evaluate depression severity.9
There have been some studies comparing the ReHo values of BD and UD. Liu et al showed that compared to UD patients, BD patients exhibited increased ReHo values of in the right dorsal anterior insular, right middle frontal gyrus, right cerebellum posterior gyrus and the left cerebellum anterior gyrus, and decreased ReHo values in the right parahippocampal gyrus, right ventral anterior insular.12 Liang et al indicated that compared UD patients, BD subjects showed a significant increase of ReHo values in the thalamus.11 To date, various studies have reported the neuroimaging differences between BD and UD. However, the results have been inconsistent.
The purpose of our study is to investigate the similarities and differences in ReHo values of patients with UD and BD in order to isolate biological markers necessary for identification.
Methods
Participants
The participants consisted of 58 UD patients and 40 BD patients were recruited from the Department of Psychiatry in the First Hospital of Shanxi Medical University between December 2018 and July 2019. Confirmation of the diagnosis of BD or UD was made by two experienced psychiatrists using the structured Clinical Interview for DSM-IV (SCID). All of the subjects included in this study meet the following criteria: (1) aged from 18 to 55 years old; (2) The total score of the 24-item Hamilton Depression Rating Scale (HDMD-24)≥20; (3) right-handed; (4) have no history of neurological illnesses or other severe diseases; (5) have no history of head injury or other comorbid DSM-IV axis I psychiatric disorders; (6) without manic and mixed episodes; (7) not pregnant or contraindications for MRI scans.
A total of 27 patients who matched the age, gender, education, and health controls (HCs group) were recruited from the Physical Examination Center of the First Hospital of Shanxi Medical University. Excluded subjects were those who were left-handed, had mental disorders, a neurological illness, other severe diseases, or who showed abnormalities in brain images.
After receiving a thorough description of the study, all participants provided their written informed consent. This study was approved by the Ethical Committee for Medicine of First Hospital of Shanxi Medical University in Taiyuan, China, and conducted in accordance with the Declaration of Helsinki.
Image Acquisition
All of the subjects were scanned on an A MAGNETOM Trio Tim 3.0 T (Siemens Medical Solutions, Germany) with a 12-channel birdcage head coil located at the First Hospital of Shanxi Medical University. The rs-fMRI was performed using an echo-planar imaging (EPI) sequence with the following parameters: TR = 2000 ms, TE = 30 ms, Flip angle = 70°, FOV = 24 × 24 cm, matrix = 64 × 64, section thickness = 3 mm, slice gap =2 mm, acquired over 6 min and 212 volumes were obtained. During the scan, participants were instructed to keep their eyes closed and all participants reported that they did not fall asleep.
Image Processing
Data preprocessing was conducted using the Data Processing & Analysis for Brain Imaging (DPABI 2.2)13 and the Resting-State fMRI Data Analysis Toolkit (REST).14 The first 10 volumes of functional time points that allowed the participants to adapt to scanning noises were discarded. The rest of the volumes were processed using the following six steps: (1) slice-timing; (2) realignment to reduce head motion (all head movements exceeding 2.5 mm were excluded); (3) spatial normalization to the Montreal Neurological Institute (MNI) coordinate space with 3×3×3 mm; (4) linear detrending; (5) temporal band-pass filtering (0.01–0.08 Hz); (6) nuisance signals were regressed out, including Friston 24 head motion parameters, global signal, white matter signal, and cerebrospinal fluid signal. Finally, the standardized ReHo map of each participant was smoothed with a Gaussian kernel of 6 mm FWHM to decrease spatial noise. For subsequent statistical analysis, Fisher’s r-to-z transformation was applied to improve the normality of the correlation.15
Data with a head motion of more than 2.5 mm or an angular rotation greater than 2.5° in any direction were excluded from the analysis.
Statistical Analyses
All analyses were performed using SPSS Statistics Version 23.0 (SPSS23.0). One-way analyses of variance (ANOVA) were conducted to detect the differences among the three groups in age, years of education, and the total score of the HAMD-24, Hamilton Anxiety Scale (HAMA), and Young Mania Rating Scale (YMRS). An x2-test was used to estimate group differences in gender. P-values of 0.05 were considered statistically significant (two-tailed).
An ANOVA model was performed to compare whole-brain ReHo to identify abnormalities across three groups. The model was followed by post hoc t-tests to identify the differences between each pair of groups in DPABI 2.2, which would ensure that the effects were not accounted for by other factors. Age, gender, and years of education were selected as covariates. DPABI 2.2 was used to report the results. The brain areas were considered significant by the AlphaSim correction, voxel-P < 0.01, cluster-P < 0.05 (http://afni.nih.gov/afni/docpdf/AlphaSim.pdf). From the preprocessed resting-state fMRI data, we extracted the mean ReHo value for these abnormality clusters. Following this step, Pearson correlation analyses were conducted to calculate the correlation between the abnormality clusters and the total score of the HAMD, HAMA, YMRS in the UD and BD.
Results
Demographic Data Comparisons
There were no statistical differences among the three groups in terms of age (F= 1.530, p = 0.220), gender (x2=0.428, p = 0.807), and years of education (F= 0.945, p = 0.391). The total scores of the HAMD-24 (t= 1.052, p = 0.298), HAMA (t= 0.107, p = 0.766), and YMRS (t= 0.072, p = 0.201) in the UD and BD had no significant differences (Table 1).
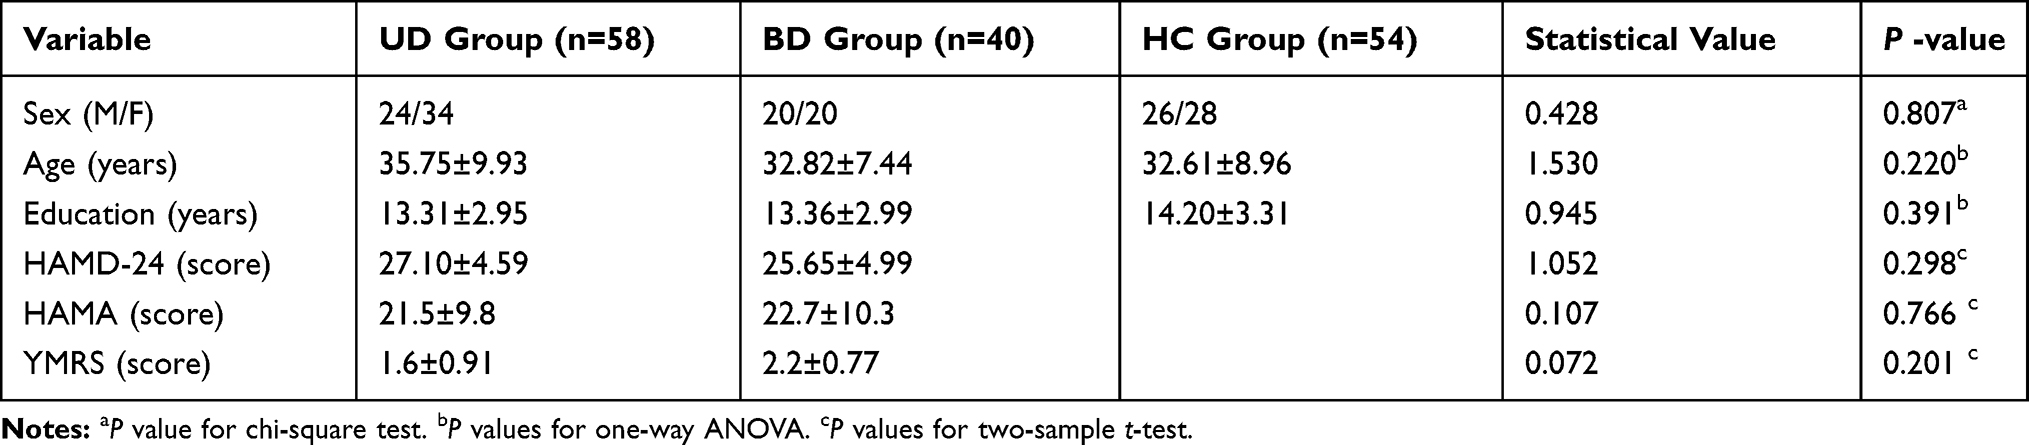 |
Table 1 Demographic and Clinical Characteristics of All Participants |
ReHo Regions Differences in UD Group, BD Group, and HCs Group
Significant differences in ReHo were observed among the three groups for the right hippocampus, right parahippocampal gyrus, right Inferior orbitofrontal gyrus, right superior temporal gyrus, right inferior temporal gyrus and right middle occipital gyrus (See Table 2 and Figure 1).
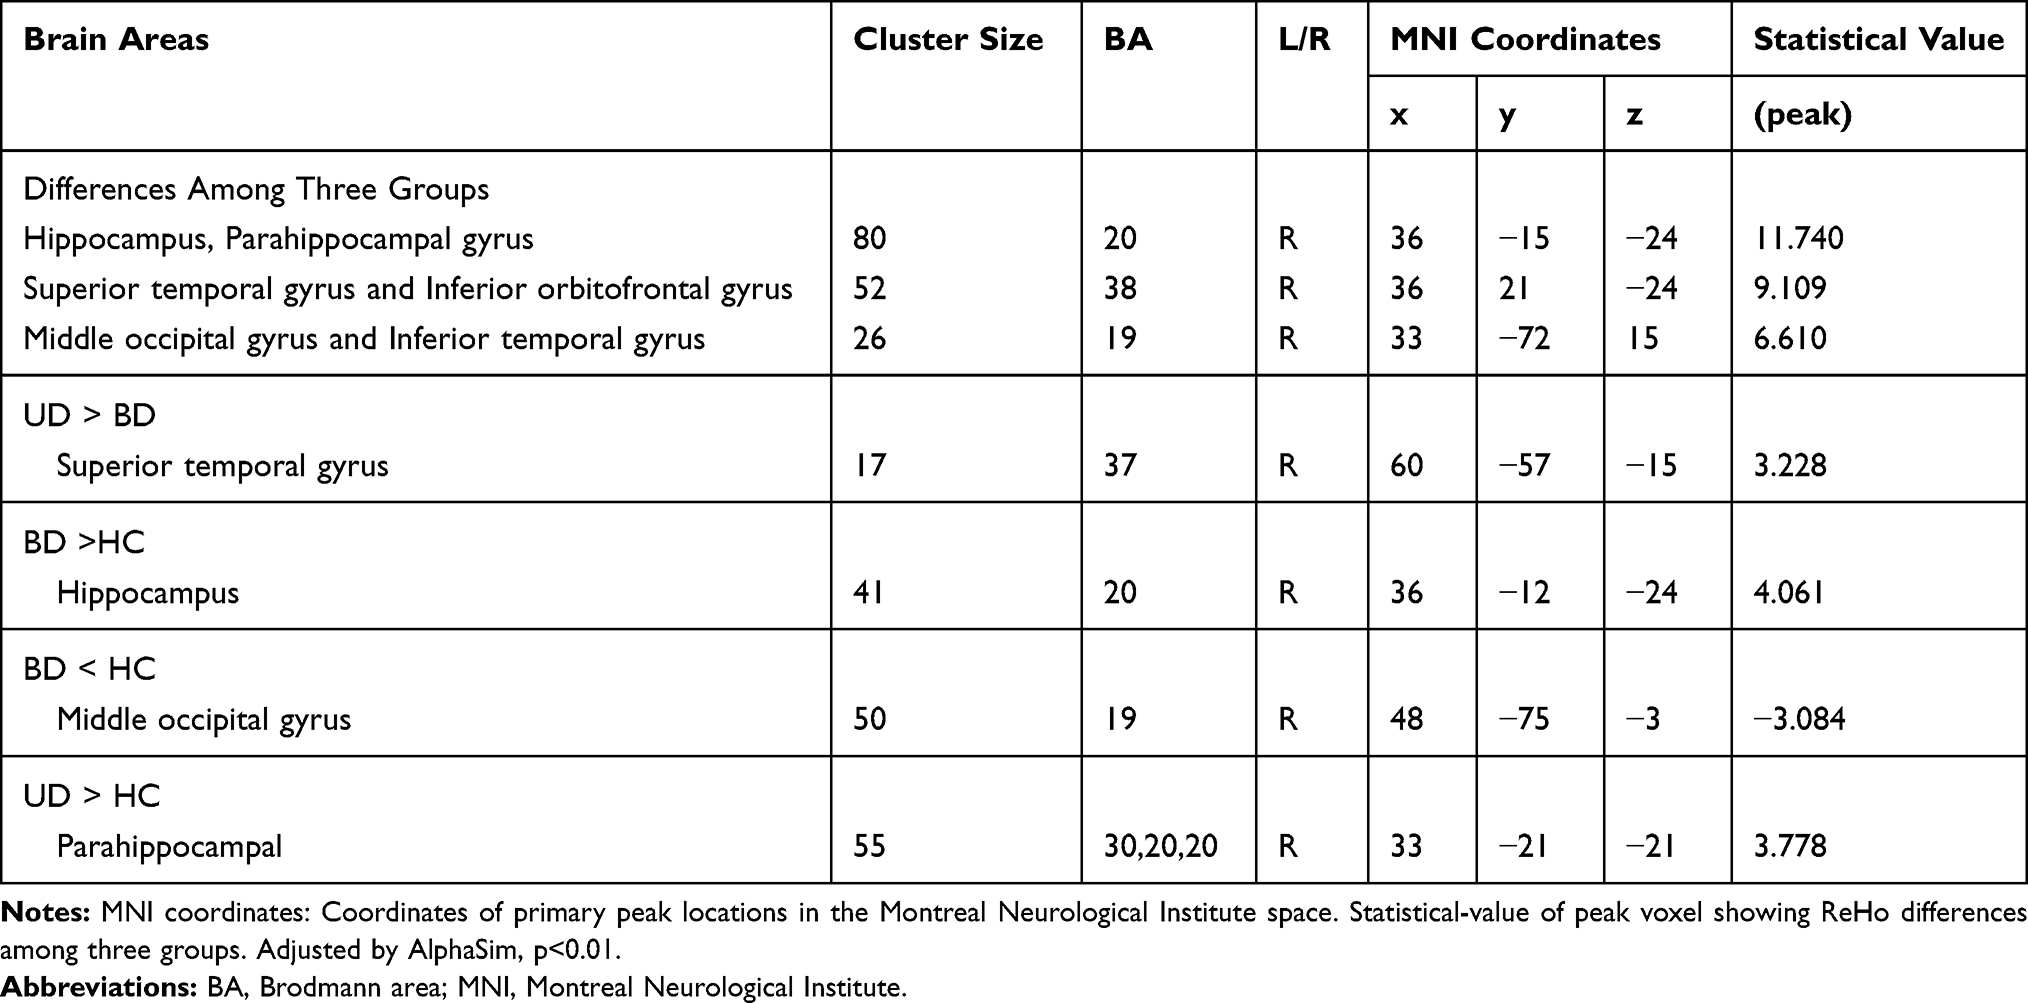 |
Table 2 ReHo Region Differences in UD Groups, BD Groups, and HC Groups |
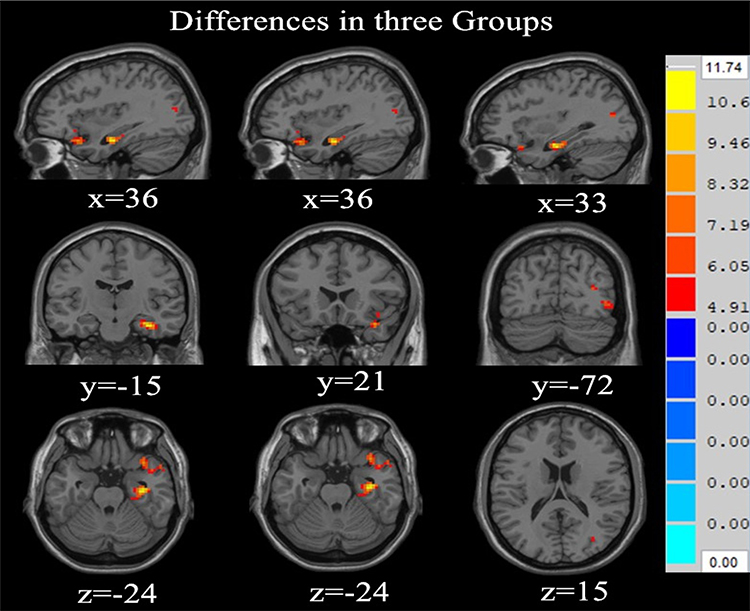 |
Figure 1 ReHo maps showing significant differences among the three groups displayed on axial, coronal, and sagittal slices. Numbers indicate x, y, and z slices, and are displayed in MNI coordinates. Red colors denote increased activity. The color bars indicate the F-value based on one-way ANOVA. (p<0.01 AlphaSim correction). |
Relative to the HCs group, increased brain activity was observed in the UD group in the right parahippocampal gyrus (See Table 2 and Figure 2).
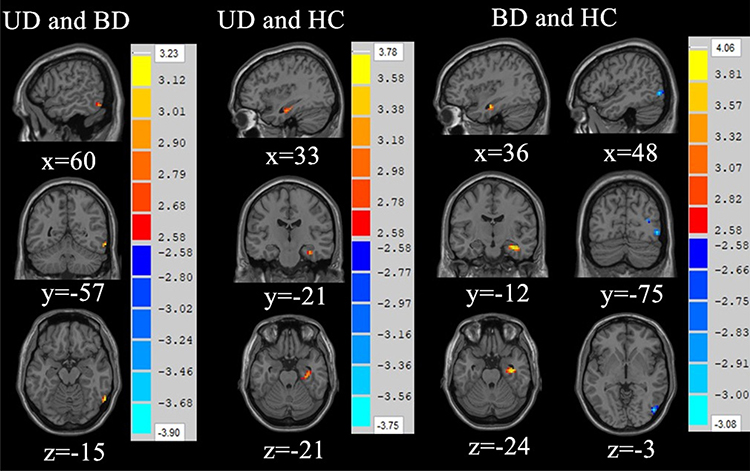 |
Figure 2 ReHo maps showing significant differences in brain activity between UD group and BD group, UD group and HC group, and BD group and HC group displayed on axial, coronal, and sagittal slices. Numbers indicate x, y, and z slices, and are displayed in MNI coordinates. Red and blue colors denote increased and decreased activity. The color bars indicate the T-value based on two-sample t-test. (p<0.01 AlphaSim correction). |
Compared with the HCs group, increased brain activity in the BD group was observed in the right hippocampus and decreased brain activity in the right middle occipital gyrus (See Table 2 and Figure 2).
Relative to the UD group, increased brain activity was observed in the BD group in the right inferior temporal gyrus (See Table 2 and Figure 2). No correlations were observed between the scores of HAMD, HAMA, YMRS, and the ReHo values of altered brain regions between BD and UD (−0.2 < r < 0.2, P > 0.05).
Discussion
Our study showed that compared to HC, patients with UD and BU demonstrated increased ReHo values in the right parahippocampal and right hippocampus gyrus. Previous studies have found significant functional and structural abnormalities in the hippocampus and parahippocampal gyrus in patients with depression.12,16 Using meta-analysis, Wise et al determined that patients with UD have reduced gray matter volume in both the hippocampus and parahippocampus in comparison to the control group. Additionally, patients experiencing a depressive episode show a reduction in hippocampal volume when compared to patients in remission.17 Yao et al found that the ReHo values of BD patients were significantly different from healthy subjects in the right hippocampus, right amygdala, right parahippocampal gyrus, and right orbital inferior frontal gyrus5 Tannous et al reported that patients with UD and BD exhibited decreased gray matter volume (GMV) in the hippocampus and parahippocampal gyrus which have a significant impact on executive function, stress regulation and learning processes.18 The hippocampus located below the cerebral cortex and inside the temporal lobe contains the hippocampus proper and the dentate gyrus. As a component of the limbic system, the hippocampus plays an important role in learning, memory, spatial orientation, and emotional management.19 Hippocampus is likewise an important part of the Default Mode Network (DMN) of the brain, which has been considered to play a key role in the pathophysiology of mood disorders.19
This study also found that when compared to HCs, patients with BD had lower ReHo values in the right middle occipital gyrus. Previous studies have shown structural and functional abnormalities in the occipital gyrus lobe and temporal lobe of patients with BD, such as significantly decreased GMV in the middle occipital gyrus and middle temporal gyrus.20 The degree of metabolism of these brain regions in patients with BD has a negative correlation with depressive symptoms.21 These studies indicate that structural and functional impairment of the occipital gyrus and temporal gyrus may be one of the pathological bases of emotional disorders and cognitive impairment. The anterior part of the temporal gyrus is the mental cortex, which is connected to the frontal gyrus and occipital gyrus by nerve fiber bundles. Therefore, the temporal gyrus plays an important role in the processing of emotion, memory, and mental activities.22 Studies demonstrate that the middle temporal gyrus plays a role in language processing, the fusiform gyrus is involved in the recognition of objects and facial expressions.23 The occipital cortex is responsible for collecting and processing visual information. Therefore, the abnormalities in these brain areas are usually associated with the clinical manifestations of cognitive impairment, memory loss, and emotional disorders in patients with mood disorders.24
There was an increased ReHo value of the right inferior temporal gyrus in BD when compared to UD, which may be related to the manic episodes and psychotic symptoms of patients with BD. In addition, the use of lithium salts and antipsychotics may also affect brain activity in BD patients.25 Patients with BD have a significant mean diffusivity (MD) and fractional anisotropy (FA) in the temporal gyrus, and clinical evidence shows that temporal gyrus lesions can cause BD in previously healthy individuals.26 A structural MRI study also showed that the thickness of the right temporal gyrus is negatively correlated with working memory, especially in patient with BD.27 The results of this study showed a significant different ReHo value in the right inferior temporal gyrus between BD and UD, thereby indicating that the changes in local functional connectivity in this region could be the pathophysiological difference between the two diseases. Meanwhile, there was no correlation between the ReHo value of the right inferior temporal gyrus and the total score of HAMD-24, HAMA, and YMRS in the two groups, which aligns with previous research results.5,28 These findings suggest that the difference of local functional connectivity in the right inferior temporal gyrus may be related to the disease itself, and not to the depressive symptoms. Such may be a biological indicator distinguishing BD and UD.
In summary, this study found that patients with UD and BD have abnormal ReHo values in the right hippocampus, right parahippocampal gyrus, and right fusiform gyrus, inferring that these brain areas are related to depressive symptoms. The difference in ReHo values in the right inferior temporal gyrus between UD and BD can be used as a biological marker for the early diagnosis of BD that begins with depressive symptoms.
Limitation
It is important to note that there are some limitations to this study, including sample size, confounding factors, and limited follow-up. A larger sample size is needed to verify the repeatability of the results. Additionally, since most patients were already receiving treatment prior to this study, there is no way to account for the effects of various drugs on experimental results. Lastly, timely follow-up with patients is very important to ensure the correct diagnosis of UD or BD and to comprehensively analyze the disease in combination with other data such as structural images and Diffusion-Tensor Imaging (DTI)
Conclusion
The present study showed that there were many differences in the ReHo of the brain across UD, BD, and HCs. ReHo in the right inferior temporal gyrus showed significant differences between BD and UD that might serve as neuroimaging markers of BD.
Ethics and Consent Statement
The Ethical Committee for Medicine of the First Hospital of Shanxi Medical University approved this study. Written informed consent was received from all participants prior to inclusion.
Availability of Supporting Data
The datasets used and/or analyzed during the current study are available from the corresponding author upon reasonable request.
Acknowledgments
We would like to thank all of the participants in this study.
Author Contributions
All authors made substantial contributions to conception and design, acquisition of data, or analysis and interpretation of data; took part in drafting the article or revising it critically for important intellectual content; gave final approval of the version to be published; and agree to be accountable for all aspects of the work.
Funding
This study was supported by the National Key Research and Development Program of China (2016YFC1307103), the National Clinical Research Center on Mental Disorders (2015BAI13B02), and the National Natural Science Youth Fund Project (81601193,81701345).
Disclosure
All authors declare that they have no conflicts of interest.
References
1. Dean BB, Gerner D, Gerner RH. A systematic review evaluating health-related quality of life, work impairment, and healthcare costs and utilization in bipolar disorder. Curr Med Res Opin. 2004;20(2):139–154. doi:10.1185/030079903125002801
2. Grande I, Berk M, Birmaher B, Vieta E. Bipolar disorder. Lancet. 2016;387(10027):1561–1572. doi:10.1016/S0140-6736(15)00241-X
3. Hirschfeld RM, Lewis L, Vornik LA. Perceptions and impact of bipolar disorder: how far have we really come? Results of the national depressive and manic-depressive association 2000 survey of individuals with bipolar disorder. J Clin Psychiatry. 2003;64(2):161–174. doi:10.4088/JCP.v64n0209
4. Akiskal HS, Maser JD, Zeller PJ, et al. Switching from ‘unipolar’ to bipolar II. An 11-year prospective study of clinical and temperamental predictors in 559 patients. Arch Gen Psychiatry. 1995;52(2):114–123. doi:10.1001/archpsyc.1995.03950140032004
5. Yao X, Yin Z, Liu F, et al. Shared and distinct regional homogeneity changes in bipolar and unipolar depression. Neurosci Lett. 2018;673:28–32. doi:10.1016/j.neulet.2018.02.033
6. Valentí M, Pacchiarotti I, Bonnín CM, et al. Risk factors for antidepressant-related switch to mania. J Clin Psychiatry. 2012;73(2):e271–e276. doi:10.4088/JCP.11m07166
7. Wang Y, Zhong S, Jia Y, et al. Interhemispheric resting state functional connectivity abnormalities in unipolar depression and bipolar depression. Bipolar Disord. 2015;17(5):486–495. doi:10.1111/bdi.12315
8. Baldessarini RJ, Faedda GL, Offidani E, et al. Antidepressant-associated mood-switching and transition from unipolar major depression to bipolar disorder: a review. J Affect Disord. 2013;148(1):129–135. doi:10.1016/j.jad.2012.10.033
9. Yao Z, Wang L, Lu Q, Liu H, Teng G. Regional homogeneity in depression and its relationship with separate depressive symptom clusters: a resting-state fMRI study. J Affect Disord. 2009;115(3):430–438. doi:10.1016/j.jad.2008.10.013
10. Zuo XN, Xu T, Jiang L, et al. Toward reliable characterization of functional homogeneity in the human brain: preprocessing, scan duration, imaging resolution and computational space. Neuroimage. 2013;65:374–386. doi:10.1016/j.neuroimage.2012.10.017
11. Liang MJ, Zhou Q, Yang KR, et al. Identify changes of brain regional homogeneity in bipolar disorder and unipolar depression using resting-state FMRI. PLoS One. 2013;8(12):e79999. doi:10.1371/journal.pone.0079999
12. Liu CH, Ma X, Wu X, et al. Regional homogeneity of resting-state brain abnormalities in bipolar and unipolar depression. Prog Neuropsychopharmacol Biol Psychiatry. 2013;41:52–59. doi:10.1016/j.pnpbp.2012.11.010
13. Yan CG, Wang XD, Zuo XN, Zang YF. DPABI: data processing & analysis for (resting-state) brain imaging. Neuroinformatics. 2016;14(3):339–351. doi:10.1007/s12021-016-9299-4
14. Chao-Gan Y, Yu-Feng Z. DPARSF: a MATLAB toolbox for “pipeline” data analysis of resting-state fMRI. Front Syst Neurosci. 2010;4:13. doi:10.3389/fnsys.2010.00009
15. Liu Y, Yu C, Liang M, et al. Whole brain functional connectivity in the early blind. Brain. 2007;130(Pt 8):2085–2096. doi:10.1093/brain/awm121
16. Han KM, De Berardis D, Fornaro M, Kim YK. Differentiating between bipolar and unipolar depression in functional and structural MRI studies. Prog Neuropsychopharmacol Biol Psychiatry. 2019;91:20–27. doi:10.1016/j.pnpbp.2018.03.022
17. Wise T, Radua J, Nortje G, Cleare AJ, Young AH, Arnone D. Voxel-based meta-analytical evidence of structural disconnectivity in major depression and bipolar disorder. Biol Psychiatry. 2016;79(4):293–302. doi:10.1016/j.biopsych.2015.03.004
18. Tannous J, Amaral-Silva H, Cao B, et al. Hippocampal subfield volumes in children and adolescents with mood disorders. J Psychiatr Res. 2018;101:57–62. doi:10.1016/j.jpsychires.2018.03.003
19. Bast T, Pezze M, McGarrity S. Cognitive deficits caused by prefrontal cortical and hippocampal neural disinhibition. Br J Pharmacol. 2017;174(19):3211–3225. doi:10.1111/bph.13850
20. Bruno SD, Papadopoulou K, Cercignani M, Cipolotti L, Ron MA. Structural brain correlates of IQ changes in bipolar disorder. Psychol Med. 2006;36(5):609–618. doi:10.1017/S0033291706007112
21. Lu D, Jiao Q, Zhong Y, et al. Altered baseline brain activity in children with bipolar disorder during mania state: a resting-state study. Neuropsychiatr Dis Treat. 2014;10:317–323. doi:10.2147/NDT.S54663
22. Young KD, Bodurka J, Drevets WC. Differential neural correlates of autobiographical memory recall in bipolar and unipolar depression. Bipolar Disord. 2016;18(7):571–582. doi:10.1111/bdi.12441
23. Brooks JA, Chikazoe J, Sadato N, Freeman JB. The neural representation of facial-emotion categories reflects conceptual structure. Proc Natl Acad Sci U S A. 2019;116(32):15861–15870. doi:10.1073/pnas.1816408116
24. Chen Z, Peng W, Sun H, et al. High-field magnetic resonance imaging of structural alterations in first-episode, drug-naive patients with major depressive disorder. Transl Psychiatry. 2016;6(11):e942. doi:10.1038/tp.2016.209
25. He H, Yu Q, Du Y, et al. Resting-state functional network connectivity in prefrontal regions differs between unmedicated patients with bipolar and major depressive disorders. J Affect Disord. 2016;190:483–493. doi:10.1016/j.jad.2015.10.042
26. Spuhler K, Bartlett E, Ding J, DeLorenzo C, Parsey R, Huang C. Diffusion entropy: a potential neuroimaging biomarker of bipolar disorder in the temporal pole. Synapse. 2018;72(2):e22015. doi:10.1002/syn.22015
27. Hartberg CB, Sundet K, Rimol LM, et al. Brain cortical thickness and surface area correlates of neurocognitive performance in patients with schizophrenia, bipolar disorder, and healthy adults. J Int Neuropsychol Soc. 2011;17(6):1080–1093. doi:10.1017/S1355617711001081
28. Niida R, Yamagata B, Matsuda H, et al. Regional brain volume reductions in major depressive disorder and bipolar disorder: an analysis by voxel-based morphometry. Int J Geriatr Psychiatry. 2019;34(1):186–192. doi:10.1002/gps.5009
 © 2020 The Author(s). This work is published and licensed by Dove Medical Press Limited. The
full terms of this license are available at https://www.dovepress.com/terms
and incorporate the Creative Commons Attribution
- Non Commercial (unported, 3.0) License.
By accessing the work you hereby accept the Terms. Non-commercial uses of the work are permitted
without any further permission from Dove Medical Press Limited, provided the work is properly
attributed. For permission for commercial use of this work, please see paragraphs 4.2 and 5 of our Terms.
© 2020 The Author(s). This work is published and licensed by Dove Medical Press Limited. The
full terms of this license are available at https://www.dovepress.com/terms
and incorporate the Creative Commons Attribution
- Non Commercial (unported, 3.0) License.
By accessing the work you hereby accept the Terms. Non-commercial uses of the work are permitted
without any further permission from Dove Medical Press Limited, provided the work is properly
attributed. For permission for commercial use of this work, please see paragraphs 4.2 and 5 of our Terms.