Back to Journals » OncoTargets and Therapy » Volume 11
SIL1 functions as an oncogene in glioma by AKT/mTOR signaling pathway
Authors Xu H, Xu S, Zhang R, Xin T, Pang Q
Received 7 March 2018
Accepted for publication 20 April 2018
Published 2 July 2018 Volume 2018:11 Pages 3775—3783
DOI https://doi.org/10.2147/OTT.S167552
Checked for plagiarism Yes
Review by Single anonymous peer review
Peer reviewer comments 2
Editor who approved publication: Prof. Dr. Geoffrey Pietersz
Hao Xu, Shangchen Xu, Rui Zhang, Tao Xin, Qi Pang
Department of Neurosurgery, Shandong Provincial Hospital Affiliated to Shandong University, Jinan 250021, Shandong, China
Purpose: SIL1 is a ubiquitous protein localized to the endoplasmic reticulum and functions as a cochaperone of BiP. Previous studies have shown that function loss of SIL1 is often associated with neurological diseases, such as Marinesco-Sjögren Syndrome. However, no studies have investigated the function of SIL1 in tumors. In this study we aim to reveal functions of SIL1 and the underlying mechanisms in glioma.
Materials and methods: First, by searching on Gene Expression Profiling Interactive Analysis, we examined SIL1 expression and prognostic value in glioblastoma multiforme (GBM) and brain lower grade glioma (LGG). Immunohistochemical analysis (IHC) was also performed to determine the endogenic SIL1 level. Cell counting kit-8 (CCK8) and clone formation assays were used to detect cell proliferation of U251 cells. Cell migration was detected by transwell assay and cell cycle and apoptosis were detected by flow cytometry. Western blot was performed to determine protein expression.
Results: We found that the expression of SIL1 was increased by approximately 1.5-fold in GBM and 1.3-fold in LGG compared with normal controls (P<0.05) and negatively correlated with patients’ survival. IHC revealed that SIL1 expression was significantly higher in glioma tissues than that in paracancerous tissues (P<0.05). Glioma patients with high SIL1 expression accounted for 65.79% (25/38) of total samples and SIL1 expression significantly increased in grade IV glioma compared to grades I–III (P=0.026). Suppression of SIL1 expression led to significant inhibition of U251 cell proliferation. Transwell assay showed that cell migration of U251 was significantly inhibited by siSIL transfection, with an inhibitory rate reaching 69%. Flow cytometry detection showed that siSIL1 could induce apoptosis of U251 cells and upregulated the expression of the pro-apoptotic protein Bax and Caspase3-P17. However, siSIL1 transfection had no effect on the cell cycle. Mechanism studies demonstrated that siSIL1 transfection led to inactivation of AKT/mTOR signaling pathway, including decreased phosphorylation of AKT and mTOR without affecting protein expression, as well as decreased expression of the downstream effector p70S6K.
Conclusion: Downregulation of SIL1 inhibited the progression of glioma by suppressing the AKT/mTOR signaling pathway.
Keywords: SIL1, tumor, prognosis, proliferation, migration, apoptosis
Introduction
Gliomas are the most common tumors in the central nervous system, accounting for about 45% of all intracranial tumors.1 In the past 30 years, the incidence of primary malignant brain tumors increased with an annual growth rate of about 1.2%.2 Despite great improvement in surgical resection, chemotherapy and radiotherapy, patients suffering from gliomas still have a poor survival, usually 2–6 years.3 Glioblastoma, ie, grade IV glioma, is the most aggressive and life-threatening glioma tumor. Medical survival of patients with glioblastoma ranges from 12 to 16 months.4 Due to high mortality of glioma patients, it is urgent to explore new biomarkers or molecular targets for the prognosis and therapy of glioma patients.
Originally found in yeast, SIL1 functions as a cochaperone of BiP, which is an endoplasmic reticulum (ER) located HSP70 protein participating in protein translocation, folding and ER stress sensing.5 BiP function depends on the hydrolysis of the combined ATP and ADP/ATP exchange.6 SIL1, also called BiP-associated protein (BAP), functions as a nucleotide exchange factor for BiP to regulate its activity.6,7 BiP and SIL1 are ubiquitously expressed in human tissues and their abnormal expression or structure disruption often leads to cell protein abnormal accumulation, impaired ER homeostasis and even cell apoptosis.8–11 However, it is interesting that function loss of SIL1 causes a selective vulnerability of certain tissues, especially the nervous system and skeletal muscle. Moreover, SIL1 is revealed to exert a neuroprotective action in neurodegenerative and neuromuscular disorders, such as amyotrophic lateral sclerosis (ALS),12 Alzheimer’s disease (AD),9 and Marinesco-Sjögren syndrome (MSS).10,11,13 Filézac de L’Etang et al find that in an ALS mouse model SIL1 protein exhibits a differential expression in different motor neurons and knocking out of Sil1 disrupts ER homeostasis and aggravates the degree of ALS.12 Liu et al report that SIL1 expression is decreased in AD mouse model and overexpression of SIL1 prominently reduces BiP elevation-related tau hyperphosphorylation and GSK-3β activation in ER stress.9 Howes et al find that C-terminal mutations disrupt SIL1 structural integrity and lead to MSS.11 Due to the close correlation with neurological function, SIL1 may play a role in nervous system tumors such as glioma. So far there are few studies exploring the expression of SIL1 in glioma and its role in the tumor pathobiology.
Here we investigated SIL1 expression and its prognostic relevance in glioma. To explore the physiological action of SIL1, we applied RNA interference technology to knock down the SIL1 expression in U251 glioma cells and investigated the impact on tumor cell function.
Materials and methods
Materials
Dulbecco’s Modified Eagle’s Medium (DMEM) was purchased from HyClone (Thermo Fisher Scientific, Waltham, MA, USA). Fetal bovine serum (FBS) was purchased from Thermo Fisher Scientific. Penicillin–streptomycin, 0.25% trypsin and cell counting kit-8 (CCK8) agent were purchased from Beijing Solarbio Science & Technology Company (Beijing, China). Lipofectamine 2000 was purchased from Thermo Fisher Scientific. Annexin V-fluorescein isothiocyanate (FITC)/propidium iodide (PI) Apoptosis Kit was purchased from Thermo Fisher Scientific. Radioimmunoprecipitation assay (RIPA) lysis buffer, bicinchoninic acid (BCA) protein assay kit, protease inhibitor cocktail, and all antibodies were purchased from CWBIO (Beijing, China). Primers were synthesized by Genewiz Company (Beijing, China). Transwell cell culture plates were purchased from EMD Millipore (Billerica, MA, USA). Protein marker was purchased from Thermo Fisher Scientific. Electro-chemi luminescence (ECL) developer was purchased from Proteintech Group (Chicago, IL, USA).
Immunohistochemical assay
Immunohistochemical (IHC) analysis was performed by using an EliVision™ Plus Kit (KIT-9902; Boster Biological Technology, Pleasanton, CA, USA). The tissue sections were obtained from Shandong Province Hospital. This work has been approved by the ethical committees at Shandong Provincial Hospital. All patients provided written informed consent. Glioma tumor or paracancerous tissues were cryosectioned at 8 μm thickness. Sodium citrate buffer (pH 6.0) was used for antigen retrieval. Slides were incubated with 3% H2O2 to clear endogenous peroxidase. Then the sections were blocked for 1 h at room temperature and incubated with primary antibodies. 3,3’-diaminobenzidine tetrahydrochloride (DAB) developer was used for slide development. After doubled staining with hematoxylin, dehydration with gradient ethanol, and mounting with neutral resins, tissue sections were observed under a microscope.
Under the 40× objective, 3–5 viewing fields were randomly chosen. The staining was scored as “0” (no staining), “1” (weakly positive), “2” (moderately positive), and “3” (strongly positive). The percentage of positively stained cells was scored as: 0=0%, 1=1%–25%, 2=26%–50%, 3=51%–75%, and 4=76%–100%. Two independent pathologists were involved in the evaluation of slides. Low expression was identified when calculation of the score was less than 6, the cut-off derived from X-tile analysis,14 otherwise they were defined as high expression.
Cell culture and transfection
U251 glioma cells were purchased from the Cell Bank of the Chinese Academy of Sciences (Shanghai, China). Cells were cultured in DMEM medium added with 10% FBS, 100 U/mL penicillin, and 0.1 mg/mL streptomycin at 37°C in a humidified atmosphere containing 5% CO2. U251 cells were digested when entered in logarithmic phase and then planted into a 6-well plate. siRNA for SIL1 was transfected into U251 cells using Lipofectamine 2000 following the instructions. A scrambled RNA was used as negative control in all experiments. siSIL1 sequence was as follows:
siRNA1: GGCUGGAUAUCAACACCAATT UUGGUGUUGAUAUCCAGCCTT
siRNA2: CGGAGAAGAUGUUCGCCGATT UCGGCGAACAUCUUCUCCGTT
siRNA3: UGGUACGGCUGAUCAACAATT UUGUUGAUCAGCCGUACCATT
siRNA4: CGCUCACUGCAAAGAAGAATT UUCUUCUUUGCAGUGAGCGTT
Primer sequence, upstream: 5′-TGCTTCACCTTCTGCCTCAG-3′; downstream: 5′-GAACACCTCCAGGACTTCGG-3′.
Fluorescence quantitative PCR
Ultrapure RNA extraction kit was used to extract total RNA of siSIL1/siNC transfected U251 cells. Total RNA was then reverse transcribed to cDNA using a PrimeScript RT Master Mix kit (Takara, Tokyo, Japan) according to the manufacturer’s protocol. Amplifications were performed in a FTC-3000 Real-Time Quantitative Thermal Cycler (Funglyn Biotech Inc., Shanghai, China). The gene expression data were analyzed using the 2−ΔΔCt method.
CCK8 assay
Cell viability was detected by using CCK8 (Solarbio Biotech Corp., Beijing, China) following the manufacturer’s instructions. Briefly, 1–5×10³ U251 cells were planted into each well of a 96-well plate. At 24, 48, 72, and 96 h after transfection, 10 μL CCK8 solution was added and incubated for 2 h. The cell viability was determined by measuring OD value at 450 nm.
Clone formation assay
After transfection for 24 h, 200 cells were planted in a 6 cm dish with 5 mL medium. Sustained culturing was performed until the clones could be visible in naked eyes. Then remove the medium and stain the clones with 0.1% crystal violet. The clones were imaged and counted.
Cell migration assays
U251 cells transfected with siSIL1 or siNC were digested and planted in a 24-well transwell insert, the pore size of which was 8.0 μm. 500 μL DMEM (FBS, 10%) was added to the lower chamber. After incubation for 48 h, the residual cells on the top surface of membrane were removed by scraping and migrated cells were fixed by 4% paraformaldehyde for 30 min, and then stained with 0.1% crystal violet for 20 min. Migrated cells were quantified by counting in five separated visual fields.
Flow cytometry for apoptosis detection
Cell apoptosis was analyzed using FITC/PI Apoptosis Kit (Thermo Fisher Scientific). After transfection for 48 h, U251 cells were collected and washed with precooled PBS. Then cells were centrifuged and the supernatant was carefully removed. Annexin V binding buffer was added to resuspend cells to 1–5×10⁶/mL. Cell suspension (100 μL) was incubated with 5 μL Annexin V/FITC mix for 5 min. Then 10 μL PI dye and 400 μL PBS were added before flow cytometry. Statistical analysis was performed using Flowjo software.
Western blot
After transfection for 48 h, total cell proteins were extracted and separated by sodium dodecyl sulfate polyacrylamide gel electrophoresis (SDS-PAGE). Then protein bands were transferred onto a polyvinylidene fluoride (PVDF) membrane. After blocking with 5% non-fat milk for 1 h, the membrane was incubated at 4°C overnight with primary antibodies and second antibodies for 1 h at room temperature. The protein bands were developed by ECL system and quantified with QUANTITY ONE software. The primary antibodies included anti-SIL1 (Cat#ab5639; Abcam, Cambridge, UK), anti-α-tubulin (Cat#ab18251; Abcam), anti-Bax (Cat#ab32503; Abcam), anti-active caspase3 p17-specific (Cat#25546-1-AP; Proteintech Group), anti-p-Akt (Cat#ab81283; Abcam), anti-Akt (Cat#ab32505; Abcam), anti-mTOR (Cat#ab2732; Abcam), anti-p-mTOR (Cat#ab131538; Abcam), anti-P70S6K (Cat#ab32529; Abcam). The secondary antibodies were purchased from Proteintech.
Statistical analysis
All data were represented from three independent experiments and expressed as mean ± standard deviation. SPSS 18.0 software (version 16.0; SPSS Inc., Chicago, IL, USA) was used for all the statistical analysis. The differences between two groups were analyzed using Student’s t-test. P<0.05 was considered statistically significant.
Results
SIL1 expression in glioma
Recent studies revealed that elevation of SIL1 expression could play a neuroprotective effect in ALS, AD, or MSS.9,10,12 In order to investigate the function of SIL1 in glioma, which is also a nervous system related disease, we checked mRNA expression of SIL1 on Gene Expression Profiling Interactive Analysis (GEPIA), an online server derived from the Cancer Genome Atlas (TCGA), and Genotype-Tissue Expression (GTEx) dataset.15 The box plots shown in Figure 1A revealed that SIL1 expression significantly increased in glioblastoma multiforme (GBM) by about 1.5 fold and brain lower grade glioma (LGG) by about 1.3 fold compared to normal controls (P<0.05). The result suggested that SIL1 might be involved in glioma progression.
 | Figure 1 SIL1 was highly expressed in glioma and represented a poor prognosis. (A) The red and gray boxes represent glioma and normal tissues, respectively. The y-axis indicates the log2-transformed gene expression level. (B) Survival percentage of glioma patients with high or low SIL1 expression. Left: GBM; right: LGG. The data of (A) and (B) were obtained with permission from, Tang Z, et al. (2017) GEPIA: a web server for cancer and normal gene expression profiling and interactive analyses. Nucleic Acids Res. 10.1093/nar/gkx247.15 (C) Endogenous levels of SIL1 in glioma and paracarcinoma tissues were tested by immunohistochemical assay. |
High SIL1 expression represented a poor prognosis
GEPIA also provided survival analysis, which revealed the correlation between gene expression and the survival rate of patients, so as to describe the prognostic value of a specific gene. The survival curves of GBM and LGG patients with high or low SIL1 expression were shown in Figure 1B. The results indicated that the survival rate of patients with a high SIL1 expression was significantly lower in both GBM (HR(high)=1.7, p(HR)=0.0053, n(high)=81, n(low)=81) and LGG (HR(high)=2, p(HR)=0.00011, n(high)=257, n(low)=257) compared to those with a low SIL1 expression. It was suggested that high SIL1 expression represented a poor prognosis and SIL1 might play a role in promoting glioma progression.
In order to acquire more intuitive understanding of endogenous SIL1 level, we performed IHC staining in glioma tissue and paracarcinoma tissue derived from the same patient. Results in Figure 1C revealed a strong immunohistochemistry staining of SIL1 in glioma tissue, while that was very weak in normal tissue. It was demonstrated that SIL1 expression was significantly enhanced in glioma tissue, which was consistent with the result in box plots. In addition, SIL1 expression and its correlation with clinical pathological features of glioma patients was also investigated (Table 1). In general, glioma patients with high SIL1 expression accounted for 65.79% (25/38) of total samples. SIL1 expression had no connection with age or sex of patients but significantly increased in grade IV glioma (P=0.026) compared to grades I–III.
 | Table 1 SIL1 expression and the relationship between clinical pathological features of glioma patients |
Downregulation of SIL1 inhibited U251 cell proliferation and migration
To investigate the function of SIL1, we designed 4 siRNAs to knock down SIL1 in U251 cells. The interference efficiencies were quantified and plotted in Figure 2A. The result indicated that among the four kinds of siRNAs, siRNA2 and siRNA3 exhibited the most powerful activity in knocking down SIL1 expression. So we selected siRNA3 (siSIL1) in the follow-up experiments. The Western blot result in Figure 2B verified the inhibition of siSIL1 on SIL1 expression.
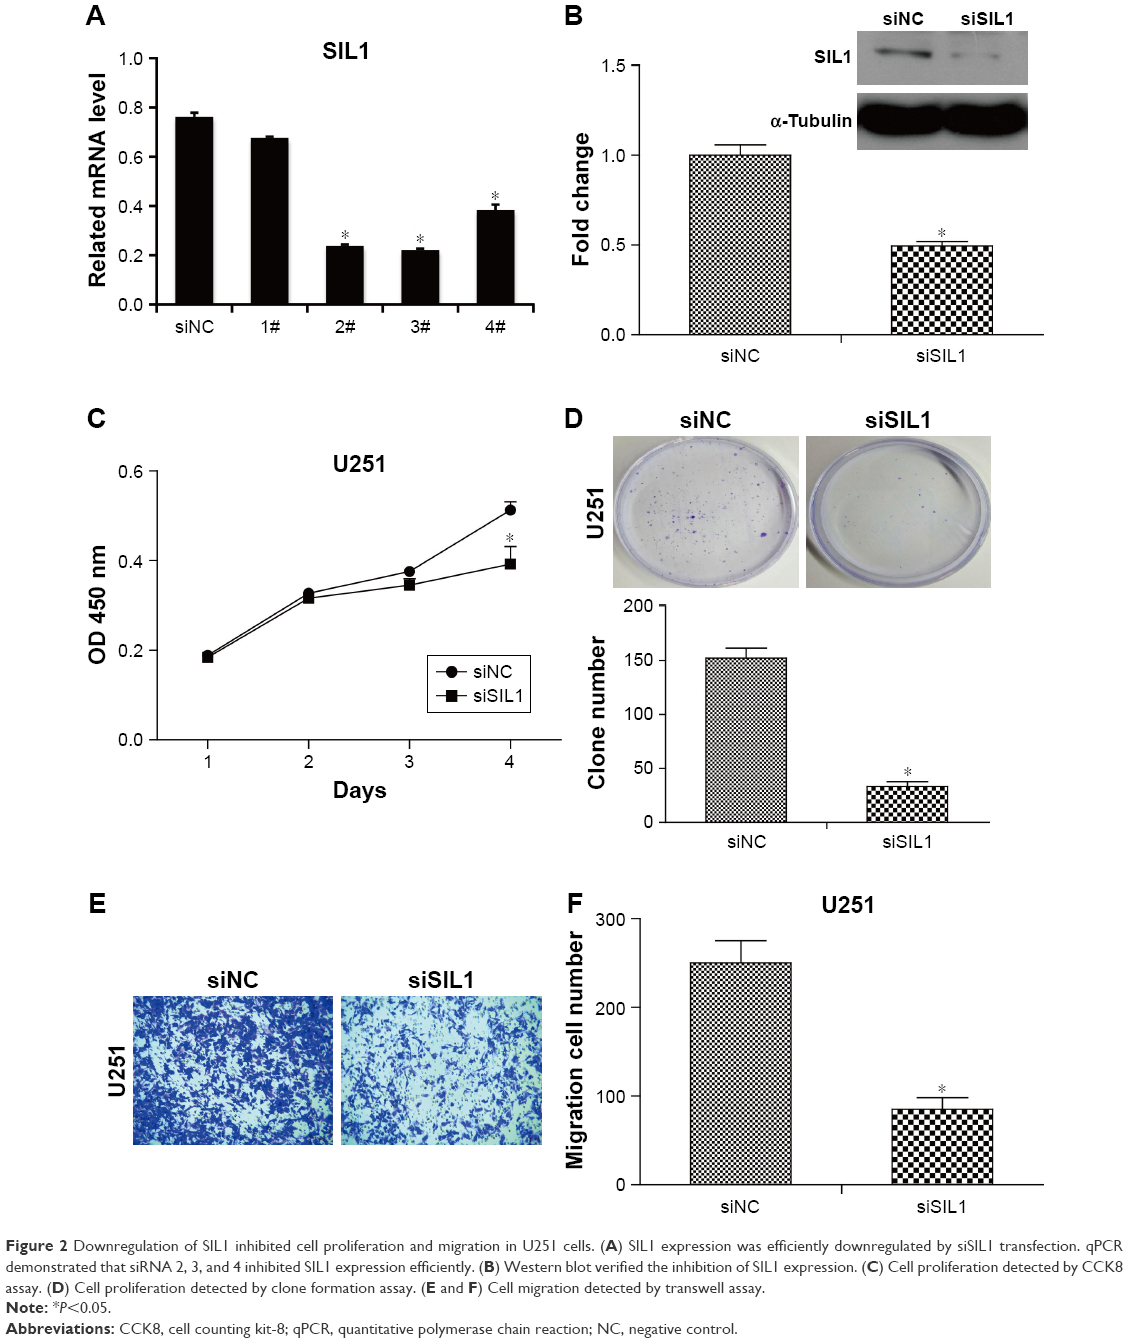 | Figure 2 Downregulation of SIL1 inhibited cell proliferation and migration in U251 cells. (A) SIL1 expression was efficiently downregulated by siSIL1 transfection. qPCR demonstrated that siRNA 2, 3, and 4 inhibited SIL1 expression efficiently. (B) Western blot verified the inhibition of SIL1 expression. (C) Cell proliferation detected by CCK8 assay. (D) Cell proliferation detected by clone formation assay. (E and F) Cell migration detected by transwell assay. |
Sustaining proliferation was the most important property of cancer cells, so we first detected the effect of SIL1 downregulation on U251 cell proliferation by using CCK8 assay and clone formation assay. The result shown in Figure 2C indicated that after transfection for 72 h, the cell viability of siSIL1 transfected U251 cells was significantly decreased compared to that of siNC transfected cells (P<0.05). The inhibitory effect of siSIL1 knockdown on U251 cell proliferation was also demonstrated in clone formation assay (Figure 2D). The average clone number was decreased from 152±16 of the siNC group to 33±8 of the siSIL1 group.
The effect of SIL1 downregulation on U251 cell migration was also detected by using a transwell migration assay. As shown in Figure 2E, the migrated cells (crystal violet stained) in siSIL1 transfected wells were significantly decreased compared to those in the siNC group. The quantified result of cell migration is shown in Figure 2F, which indicated that the average migrated cell number per field was reduced from 250±24 of the siNC group to 85±12 of the siSIL1 group, with the inhibitory rate reaching 69%.
In summary, siSIL1 transfection significantly inhibited U251 cell proliferation and migration, which suggested that SIL1 played an oncogenic role in glioma.
Downregulation of SIL1 induced apoptosis without affecting cell cycle
In order to determine what factors lead to the inhibition of cell proliferation, we performed flow cytometry to analyze cell cycle and apoptosis of U251 cells transfected with siSIL1. The cell populations in each phase of cell cycle are shown in Figure 3A and B. It was suggested that there was no significant difference of cell population between siNC and siSIL1 group. The result suggested that siSIL1 transfection did not affect U251 cell cycle progression. However, we found that siSIL1 transfection significantly increased cell apoptosis percentage in U251 cells, from 8.78% of siNC group to 12.92% of siSIL1 group (Figure 3C and D, P<0.05). We also detected the expression of apoptosis associated proteins. As shown in Figure 3E and F, siSIL1 transfection increased the expression of pro-apoptotic protein Bax by 2.35-fold and Caspase3-P17 by 1.7-fold. Taken together, downregulation of siSIL1 induced cell apoptosis through downregulating pro-apoptotic proteins Bax and Caspase3-P17 but did not affect U251 cell cycle progression.
 | Figure 3 Downregulation of SIL1 induced apoptosis and the expression of pro-apoptotic genes but did not affect cell cycle in U251 cells. (A and B) U251 cell cycle detected by flow cytometry; (C and D) U251 cell apoptosis detected by flow cytometry; (E and F) expression of pro-apoptotic protein Bax and Caspase3-P17 detected by Western blot. |
Downregulation of SIL1 inhibited AKT/mTOR signaling pathway
AKT/mTOR signaling pathway is a classic cell survival pathway which is persistently activated in many cancers, including glioma.16 In order to explain the mechanism underlying the inhibitory effect of siSIL1 downregulation on U251 cells we investigated the expression of AKT/mTOR members by using Western blot assay. AKT plays a central regulatory role in this signaling pathway and phosphorylation-activated AKT regulates many cell processes by phosphorylating a cohort of substrates, including mTOR. When phosphorylated, mTOR will be promoting cell protein synthesis by phosphorylating p70S6K. The Western blot results presented in Figure 4 showed that p-AKT and p-mTOR levels were significantly decreased in the siSIL1 group compared to the siNC group, while the expression of AKT and mTOR was not impacted. The expression of p70S6K was significantly inhibited by siSIL1 transfection. These data suggested that AKT/mTOR signaling pathway was significantly inhibited in siSIL1 transfected U251 cells.
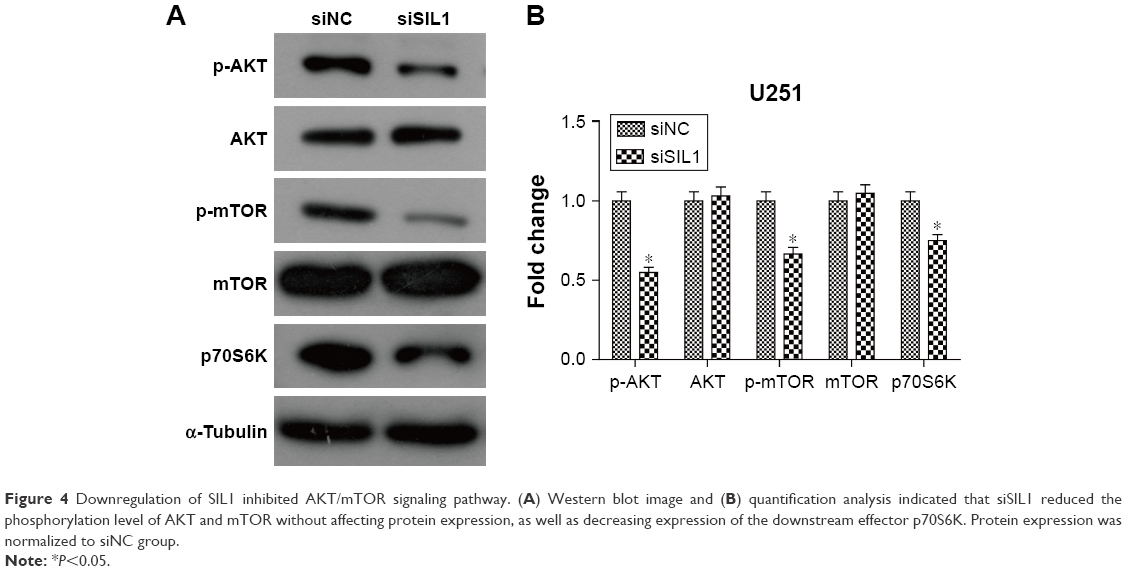 | Figure 4 Downregulation of SIL1 inhibited AKT/mTOR signaling pathway. (A) Western blot image and (B) quantification analysis indicated that siSIL1 reduced the phosphorylation level of AKT and mTOR without affecting protein expression, as well as decreasing expression of the downstream effector p70S6K. Protein expression was normalized to siNC group. |
Discussion
Protein folding is one of the basic functions of cells for survival, and protein folding chaperones and cochaperones are the main functional molecules that carry out this process. BiP is a molecular chaperone of the HSP70 family that is localized to the ER. BiP binds new-synthesized proteins and translocates them into ER.5 In addition, BiP also binds to those abnormally folded proteins destined to be degraded and transfers them out of the ER.5 BiP can also be activated by ER stress and upregulated when unfolded protein accumulation.5,17 This property provides a marker of the disease state caused by the misfolding of secreted and transmembrane proteins.5,17 BiP function requires the hydrolysis of ATP to provide energy, and in this process SIL1 functions as a nucleic acid exchange factor to release ADP from BiP.5,18 SIL1 is ubiquitously expressed in all human tissues. However, SIL1 deletion studies find that function loss of SIL1 only leads to vulnerability of skeletal muscle and central nervous system in humans, eg, in MSS,7,19–21 and SIL1 overexpression was demonstrated a beneficial effect in surviving neurons in neurodegenerative disorders such as ALS and AD.9,12 Other studies provide some new knowledge of SIL1 function. For instance, Inaguma et al reveal that SIL1 plays an indispensable role in the structural construction of the developing cerebral cortex.22 Ittner et al report that SIL1 is required for islet insulin content, islet sizing, glucose tolerance, and glucose-stimulated insulin secretion in vivo.23 Ichhaporia et al report that SIL1 is dispensable for antibody assembly or secretion.24 However, studies of the function of SIL1 in tumor, especially nervous system neoplasms, remain scarce. In our research, we investigate the functions of SIL1 by knocking down gene expression in U251 cells.
At the beginning of the study, we searched for the expression of SIL1 in all 31 tumor types on GEPIA and found that SIL1 expression exhibited significant difference in 6 tumor types compared with normal controls, including lymphoid neoplasm diffuse large B-cell lymphoma (DLBC), GBM, LGG, prostate adenocarcinoma (PRAD), testicular germ cell tumors (TGCT), thymoma (THYM). Except for a significant decrease in PRAD, SIL1 was upregulated in all the other tumors. The survival plot of GBM and LGG suggested that patients with high SIL1 expression tended to have a poor survival. Later IHC results also demonstrated that SIL1 expression in glioma tissues significantly increased compared to paracarcinoma tissues (P<0.05). So SIL1 might be a poor prognostic gene and involved in glioma progression. Consequently, we constructed a siSIL1 to downregulate the expression of SIL1 in U251 cells and examine the effects.
It was found that, compared to siNC, siSIL1 significantly inhibited U251 cell proliferation and migration. Flow cytometry detection demonstrated that siSIL1 induced apoptosis of U251 cell but did not affect the cell cycle. Moreover, pro-apoptosis proteins Bax and Caspase3-P17 were found to be upregulated by siSIL1. The mechanism study demonstrated that SIL1 knockdown could inhibit phosphorylation level of both AKT and mTOR without impacting their protein expression, which represented an inactivated state of the AKT/mTOR pathway. The downstream effector protein p70S6K was also downregulated by siSIL1. AKT/mTOR signaling pathway is activated very frequently in human cancers through a series of genetic and epigenetic regulation. The signaling pathway is reported to promote many cancer properties such as cell survival, growth, and proliferation.25,26
Conclusion
For the first time we report that SIL1 plays an oncogenic function by AKT/mTOR signaling pathway in glioma cells. Our work provides a new insight into SIL1 in glioma progression, which may contribute to the treatment of glioma in the future.
Disclosure
The authors report no conflicts of interest in this work.
References
Gabriel A, Batey J, Capogreco J, et al. Adult brain cancer in the U.S. black population: a Surveillance, Epidemiology, and End Results (SEER) analysis of incidence, survival, and trends. Med Sci Monit. 2014;20:1510–1517. | ||
Avni D, Glucksam Y, Zor T. The phosphatidylinositol 3-kinase (PI3K) inhibitor LY294002 modulates cytokine expression in macrophages via p50 nuclear factor κB inhibition, in a PI3K-independent mechanism. Biochem Pharmacol. 2012;83(1):106–114. | ||
Yang Z, Xie Q, Hu CL, et al. CHL1 is expressed and functions as a malignancy promoter in glioma cells. Front Mol Neurosci. 2017;10:324. | ||
Jemal A, Siegel R, Xu J, Ward E. Cancer statistics. CA Cancer J Clin. 2010;60(5):277–300. | ||
Gething MJ. Role and regulation of the ER chaperone BiP. Semin Cell Dev Biol. 1999;10(5):465–472. | ||
Chung KT, Shen Y, Hendershot LM. BAP, a mammalian BiP-associated protein, is a nucleotide exchange factor that regulates the ATPase activity of BiP. J Biol Chem. 2002;277(49):47557–47563. | ||
Zhao L, Longo-Guess C, Harris BS, Lee JW, Ackerman SL. Protein accumulation and neurodegeneration in the woozy mutant mouse is caused by disruption of SIL1, a cochaperone of BiP. Nat Genet. 2005;37(9):974–979. | ||
Siegenthaler KD, Pareja KA, Wang J, Sevier CS. An unexpected role for the yeast nucleotide exchange factor Sil1 as a reductant acting on the molecular chaperone BiP. Elife. 2017;6:e24141. | ||
Liu ZC, Chu J, Lin L, et al. SIL1 Rescued Bip elevation-related tau hyperphosphorylation in ER stress. Mol Neurobiol. 2016;53(2):983–994. | ||
Labisch T, Buchkremer S, Phan V, et al. Tracking effects of SIL1 increase: taking a closer look beyond the consequences of elevated expression level. Mol Neurobiol. 2018;55(3):2524–2546. | ||
Howes J, Shimizu Y, Feige MJ, Hendershot LM. C-terminal mutations destabilize SIL1/BAP and can cause Marinesco-Sjogren syndrome. J Biol Chem. 2012;287(11):8552–8560. | ||
Filezac de L’Etang A, Maharjan N, Cordeiro Brana M, et al. Marinesco-Sjogren syndrome protein SIL1 regulates motor neuron subtype-selective ER stress in ALS. Nat Neurosci. 2015;18(2):227–238. | ||
Karim MA, Parsian AJ, Cleves MA, et al. A novel mutation in BAP/SIL1 gene causes Marinesco-Sjogren syndrome in an extended pedigree. Clin Genet. 2006;70(5):420–423. | ||
Camp RL, Dolled-Filhart M, Rimm DL. X-tile: a new bio-informatics tool for biomarker assessment and outcome-based cut-point optimization. Clin Cancer Res. 2004;10(21):7252–7259. | ||
Tang Z, Li C, Kang B, Gao G, Li C, Zhang Z. GEPIA: a web server for cancer and normal gene expression profiling and interactive analyses. Nucleic Acids Res. 2017;45(W1):W98–W102. | ||
Dasari VR, Kaur K, Velpula KK, et al. Upregulation of PTEN in glioma cells by cord blood mesenchymal stem cells inhibits migration via downregulation of the PI3K/Akt pathway. PLoS One. 2010;5(4):e10350. | ||
Ranganathan AC, Zhang L, Adam AP, Aguirre-Ghiso JA. Functional coupling of p38-induced up-regulation of BiP and activation of RNA-dependent protein kinase-like endoplasmic reticulum kinase to drug resistance of dormant carcinoma cells. Cancer Res. 2006;66(3):1702–1711. | ||
Dudek J, Benedix J, Cappel S, et al. Functions and pathologies of BiP and its interaction partners. Cell Mol Life Sci. 2009;66(9):1556–1569. | ||
Anttonen AK, Mahjneh I, Hamalainen RH, et al. The gene disrupted in Marinesco-Sjogren syndrome encodes SIL1, an HSPA5 cochaperone. Nat Genet. 2005;37(12):1309–1311. | ||
Senderek J, Krieger M, Stendel C, et al. Mutations in SIL1 cause Marinesco-Sjogren syndrome, a cerebellar ataxia with cataract and myopathy. Nat Genet. 2005;37(12):1312–1314. | ||
Kollipara L, Buchkremer S, Coraspe JAG, et al. In-depth phenotyping of lymphoblastoid cells suggests selective cellular vulnerability in Marinesco-Sjogren syndrome. Oncotarget. 2017;8(40):68493–68516. | ||
Inaguma Y, Hamada N, Tabata H, et al. SIL1, a causative cochaperone gene of Marinesco-Sojgren syndrome, plays an essential role in establishing the architecture of the developing cerebral cortex. EMBO Mol Med. 2014;6(3):414–429. | ||
Ittner AA, Bertz J, Chan TY, van Eersel J, Polly P, Ittner LM. The nucleotide exchange factor SIL1 is required for glucose-stimulated insulin secretion from mouse pancreatic beta cells in vivo. Diabetologia. 2014;57(7):1410–1419. | ||
Ichhaporia VP, Sanford T, Howes J, Marion TN, Hendershot LM. Sil1, a nucleotide exchange factor for BiP, is not required for antibody assembly or secretion. Mol Biol Cell. 2015;26(3):420–429. | ||
Tavares MR, Pavan IC, Amaral CL, Meneguello L, Luchessi AD, Simabuco FM. The S6K protein family in health and disease. Life Sci. 2015;131:1–10. | ||
Arcaro A. Targeting PI3K/mTOR Signaling in Cancer. Front Oncol. 2014;4:84. |
 © 2018 The Author(s). This work is published and licensed by Dove Medical Press Limited. The
full terms of this license are available at https://www.dovepress.com/terms
and incorporate the Creative Commons Attribution
- Non Commercial (unported, 3.0) License.
By accessing the work you hereby accept the Terms. Non-commercial uses of the work are permitted
without any further permission from Dove Medical Press Limited, provided the work is properly
attributed. For permission for commercial use of this work, please see paragraphs 4.2 and 5 of our Terms.
© 2018 The Author(s). This work is published and licensed by Dove Medical Press Limited. The
full terms of this license are available at https://www.dovepress.com/terms
and incorporate the Creative Commons Attribution
- Non Commercial (unported, 3.0) License.
By accessing the work you hereby accept the Terms. Non-commercial uses of the work are permitted
without any further permission from Dove Medical Press Limited, provided the work is properly
attributed. For permission for commercial use of this work, please see paragraphs 4.2 and 5 of our Terms.