Back to Journals » Diabetes, Metabolic Syndrome and Obesity » Volume 14
Significant Association Between Left Ventricular Diastolic Dysfunction, Left Atrial Performance and Liver Stiffness in Patients with Metabolic Syndrome and Non-Alcoholic Fatty Liver Disease
Authors Parvanescu T, Vitel A ![]() , Sporea I
, Sporea I ![]() , Mare R
, Mare R ![]() , Buz B
, Buz B ![]() , Bordejevic DA
, Bordejevic DA ![]() , Tomescu MC
, Tomescu MC ![]() , Arnautu SF, Morariu VI, Citu IM
, Arnautu SF, Morariu VI, Citu IM ![]()
Received 7 January 2021
Accepted for publication 26 February 2021
Published 9 April 2021 Volume 2021:14 Pages 1535—1545
DOI https://doi.org/10.2147/DMSO.S300450
Checked for plagiarism Yes
Review by Single anonymous peer review
Peer reviewer comments 2
Editor who approved publication: Prof. Dr. Juei-Tang Cheng
Tudor Parvanescu,1 Andrei Vitel,1 Ioan Sporea,2 Ruxandra Mare,2 Bogdan Buz,1 Diana Aurora Bordejevic,1 Mirela Cleopatra Tomescu,1 Sergiu Florin Arnautu,3 Vlad Ioan Morariu,1 Ioana Mihaela Citu1
1Cardiology Department, Victor Babes University of Medicine and Pharmacy, Timisoara, Romania; 2Department of Gastroenterology and Hepatology, Victor Babes University of Medicine and Pharmacy, Timisoara, Romania; 3Department of Neurology, Victor Babes University of Medicine and Pharmacy, Timisoara, Romania
Correspondence: Diana Aurora Bordejevic
Cardiology Department, Victor Babe” University of Medicine and Pharmacy, 2nd Eftimie Murgu Square, Timisoara, Romania
Tel +40 734600550
Fax +40 256220636
Email [email protected]
Bogdan Buz
Cardiology Department, “Victor Babes” University of Medicine and Pharmacy, 2nd Eftimie Murgu Square, Timisoara, Romania
Tel +40 756346910
Email [email protected]
Purpose: The constitutive elements of the metabolic syndrome (MetS) are linked with both non-alcoholic fatty liver disease (NAFLD) and cardiovascular disease. Controlled attenuation parameter (CAP), and vibration controlled transient elastography (VCTE), are able to detect and quantify NAFLD, while conventional and two-dimensional speckle tracking echocardiography (2D-STE) is capable to identify subclinical changes in cardiac function. We wanted to evaluate whether there is any correspondence between left ventricular (LV) diastolic dysfunction and different degrees of liver steatosis and fibrosis in MetS subjects with NAFLD.
Patients and Methods: A total of 150 adult subjects having MetS and a normal left ventricular (LV) systolic function were recorded in the study, while 150 age- and sex- matched adults without MetS were enrolled as controls. NAFLD was established by VCTE and CAP. The left heart systolic and diastolic function was evaluated by conventional and 2D-ST echocardiography. Left atrial (LA) stiffness was calculated as the ratio between the E/A ratio and the LA reservoir-strain.
Results: In univariate regression analysis, the variables associated with LV diastolic dysfunction in MetS patients were: liver steatosis grade ≥ 2, liver fibrosis grade ≥ 2, the longitudinal LA peak strain during the reservoir phase, the LA strain rate during ventricular contraction and the LA stiffness. In multivariate logistic regression, two variables were selected as independent predictors of LV diastolic dysfunction, namely the liver stiffness (P=0.0003) and the LA stiffness (P< 0.0001). LA stiffness predicted subclinical LV diastolic dysfunction in MetS patients with a sensitivity of 45% and a specificity of 96% when using a cut-off value > 0.38, and was significantly correlated with liver steatosis stage ≥ 2 and liver fibrosis stage ≥ 2.
Conclusion: The present study confirms the association between liver stiffness, LA stiffness and LV diastolic dysfunction in MetS patients. Our study suggests that liver elastography and 2D-STE should become habitual assessments in MetS patients.
Keywords: metabolic syndrome, strain and strain‑rate imaging, left atrial stiffness, left ventricular diastolic dysfunction, liver elastography, liver steatosis and fibrosis
Introduction
Metabolic syndrome (MetS) is well-known for the concomitance of numerous cardiovascular risk factors (dyslipidemia, central obesity, hyperglycemia, insulin resistance, and hypertension). It typically marks sedentary, persons,1 and is linked with an increased probability to develop stroke, diabetes, myocardial infarction, and heart failure (HF).2–4 The occurrence of MetS boosted in the last years, endangering the general population`s health.
Probably almost 25% of the adult persons have Met.1 Some clinical researches suggest that MetS is associated with the existence of vascular atherosclerosis and heart failure.5 The HF syndrome is like an iceberg, with a visible segment that includes the symptomatic HF patients, and a much bigger invisible (“below the waterline”) segment that includes the asymptomatic patients.6,7 Early identification of subtle left ventricular (LV) dysfunction in MetS, as well as the understanding of the contribution of all of the MetS elements in disturbing the myocardial structure and function, might improve the risk stratification of cardiovascular disease in MetS subjects. There is a particular connection between the left atrial (LA) performance and the LV function, with the goal to maintain the best possible cardiac work. The LA functions as a pool during the LV systole and isovolumic relaxation, as a drain during early LV diastole, and as a pump during late LV diastole. LA remodeling is associated with LV remodeling.8 Several studies suggest a prognostic role of the LA function for cardiac and all-cause deaths.9
Non-alcoholic fatty liver disease (NAFLD) became a common health problem due to the rising prevalence of the MetS, its occurrence fluctuating from 25% to 45% in Occidental Europe. This disorder is stated by a storing of lipids, mostly triglycerides, in over 5% of the liver cells, without an excessive alcohol intake or any other secondary cause. NAFLD involves both simple steatosis (a nonthreatening disorder, without hepatocellular injury, liver inflammation, or fibrosis), and nonalcoholic steatohepatitis (NASH). NASH is a more threatening disorder that associates the existence of hepatic steatosis, hepatocellular injury, and inflammation, with or without fibrosis.10 A recently published meta-analysis stated that 35% of the NASH patients evolve to cirrhosis in around 7 years. But, most NASH patients die because of a cardiac cause, and not because of the complications of liver disease.11
Several studies suggested a relationship between NAFLD and LV dysfunction.4–6,12 However, the association between echocardiographically evaluated LA performance and NAFLD severity, demonstrated by liver vibration controlled transient elastography (VCTE) and controlled attenuation parameter (CAP), was not yet studied.
In the present study, we meant to evaluate whether there is any correspondence between LV diastolic dysfunction and different degrees of liver steatosis and fibrosis in MetS subjects. We also wanted to see whether the LA performance could predict LV diastolic dysfunction and might be associated with the extent of NAFLD.
Patients and Methods
Subjects and Methodology
This case-control observational study was achieved from January 2019 to January 2020 in the Department of Cardiology, and in the Department of Gastroenterology and Hepatology of the Victor Babes University of Medicine and Pharmacy, Timisoara. We registered consecutive adult patients with MetS and a normal LVEF scheduled for a medical visit in the Cardiology Department that agreed to be evaluated by liver elastography. The control group consisted of adults with a normal LVEF and no MetS, selected to be sex-and age-matched with the enrolled MetS patients, and willing to participate in this study. The baseline characteristics were compared among the two groups. All subjects were assessed by VCTE, CAP as well as by two-dimensional (2D) conventional and speckle-tracking echocardiography (STE).
Inclusion criteria for the study group were the age ≥ 18 years and the presence of the MetS. Exclusion criteria were: chronic liver illness due to viral infections, excessive alcohol intake (> 20 g/day in women, >30 g/day in men), or use of drugs; systolic heart failure (LV ejection fraction ≤50%); heart failure with preserved LVEF, identified by NT-proBNP levels ≥ 220 pg/m,13 known ischemic heart disease; a history of/or atrial fibrillation/atrial flutter on the initial electrocardiogram; moderate or severe valvular heart disease; cardiomyopathies; cardiac pacemakers; peripheral artery disease; a history of stroke; severe systemic illness or malignancy; chronic renal failure; pregnancy or lactation.
The diagnosis of MetS was stated on the 2006 IDF criteria: central obesity (waist circumference ≥ 94 in men and ≥80cm in women), associated with any two of the following criteria: raised fasting plasma glucose (FPG) ≥100 mg/dL or treatment of previously diagnosed type two diabetes; increased triglyceride level ≥150 mg/dL or specific treatment for this lipid abnormality; reduced high‑density lipoprotein cholesterol <40/50 mg/dL (men/women) or a treatment specific for this lipid abnormality; systolic BP (SBP) ≥130 or diastolic BP (DBP) ≥85 mmHg or treatment of previously diagnosed hypertension.14
Clinical Assessment
All patients were thoroughly examined and all the data were registered in the hospital records, which were used as a data source.
Smoking status was stated as current smoking or no smoking. Hypertension was established according to the 2018 ESC/ESH Guidelines for the management of arterial hypertension as a BP > 140/90 mmHg and/or current antihypertensive therapy.15 A 12-lead resting electrocardiogram (ECG) and laboratory tests were performed in all patients at the initiation of the study, before the liver and heart ultrasound examinations. Diabetes was identified in the presence of a FPG ≥126 g/mL or current treatment with insulin and/or an oral hypoglycemic agent.14
Vibration Controlled Transient Elastography (VCTE) and Controlled Attenuation Parameter (CAP) Measurements
VCTE was performed after an over 4 hours fasting period, by means of a FibroScan® device (EchoSens, Paris, France), by the same investigator. According to the European recommendations, the M/3.5 MHz or the XL/2.5 MHz transducer was used.16 The examiner performed ten liver stiffness measurements (LSM) in each patient, and their median value was computed. Trustworthy measurements were regarded as those having a median value with an interquartile range interval/median ratio lower than 30%.17 The LSM was stated in kilopascals (kPa). In order to differentiate the stages of fibrosis, we used the following VCTE cut-offs: F≥ 2: 8.2 kPa; F≥3: 9.7 kPa; and F4: 13.6 kPa.18 In order to separate the stages of steatosis, we used the following CAP cut-offs: S1 (mild) – 274 dB/m, S2 (moderate) – 290 dB/m, S3 (severe) – 302 dB/m.18
Conventional echocardiography was performed by the same investigator using a VIVID‑5S, G.E. phased array ultrasonic scope with a 3.5 MHz transducer. The diameters of cardiac chambers were measured according to the American Society of Echocardiography guidelines.19 LV and LA volumes were calculated from the 4- and 2-chamber apical views and the ejection fractions were calculated using the biplane Simpson method. The LV diastolic function was evaluated using the pulsed Doppler examination in the 4- and 2-chamber apical view by placing the sample volume at the tip of the mitral leaflets. We measured the peak E (maximal protodiastolic velocity of the transmitral flow), the peak A (maximal telediastolic velocity), the E/A ratio, and the isovolumic relaxation time (IVRT).The cut-off values for LV diastolic dysfunction were E/A <0.8 and IVRT >100 msec; for LV systolic dysfunction: FEVS<50%. The LA maximum diameter was measured in the parasternal long-axis view. The maximal LA volume (LAVmax) was measured in the apical 4- and 2- chamber views, at the end of the T wave on the ECG, just before the opening of the mitral valves (OMV). The minimal LA volume (LAVmin) was measured in the early phase of the ventricular diastole, at the end of the QRS complex, just after the closure of the mitral valves (CMV). The LA pre-atrial contraction volume (LAV-preA) was measured in the late phase of the ventricular diastole, at the onset of the P wave on the ECG. The values obtained from the two views were averaged; the difference between LAVmax and LAVmin represents the total LA stroke volume (tLASV). The difference between LAVmax and LAVpreA represents the passive LA stroke volume (pLASV), while the difference between LAV-preA and LAVmin represents the active LA stroke volume (aLASV). LA total ejection fraction (tLAEF, %) was calculated according to the formula 100x [LAVmax-LAVmin]/LAVmax and reflects the LA pool function; LA active ejection fraction (aLAEF, %) was calculated by the formula 100x [LAVpreA-LAVmin/LAVpreA) and reflects the LA pump function. LA passive ejection fraction (pLAEF, %) was calculated with the formula 100x [LAVmax-LAVpreA/LAVmax) and reflects the LA conduit (drain) function.19,20
LA 2D- speckle tracking imaging (STI) was assessed by using the available Vivid EchoPAC software (GE Medical System) using a frequency set between 60 and 90 frames/s. Three consecutive cardiac cycles during breath-hold were recorded in LA focused 4- and 2- chamber apical views. The analysis of the images was performed offline. The LA endocardium and epicardium were automatically tracked and manually corrected. The LA was automatically divided into 6 segments. We evaluated the following parameters: the LA peak strain during the reservoir phase: just before the OMV (LAS-pool) and the LA peak strain during the pump phase (LAS-pump): at the onset of the P wave, as shown in Figure 1. The LA conduit strain was assessed as the difference between the calculated LA pool and pump strains. LA stiffness was calculated as the ratio of the E/A value to the LAS- pool. We also evaluated the LA peak strain rate (SR) during ventricular systole (LASR-v), the LA peak SR during early ventricular diastole (LASR-e), and the LA peak SR during late ventricular diastole/pre-atrial contraction (LASR-a). The data obtained from the two apical views were averaged.20–22 The patients with inadequate echocardiographic image quality were omitted from the study.
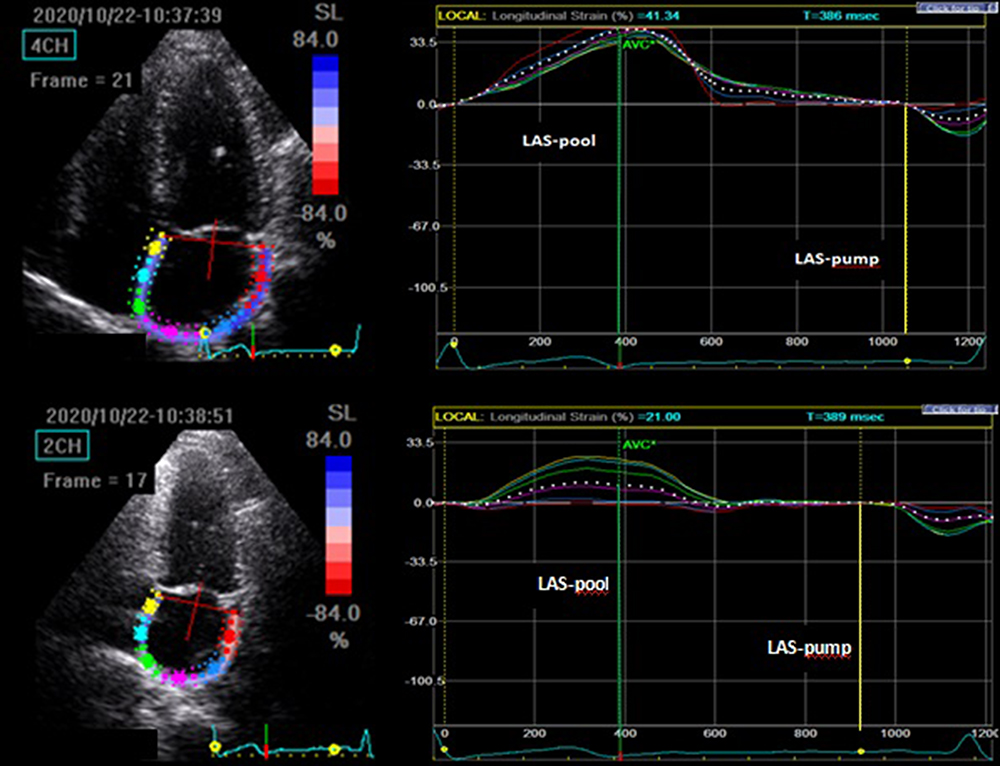 |
Figure 1 Two-dimensional speckle tracking echocardiography of the left atrium. Abbreviation: LAS, left atrial longitudinal strain. |
Ethics
Written informed consent was attained from all study participants. The study was done accordingly to the demands of the Human Rights Declaration of Helsinki and was approved by the Ethics Committee of the “Victor Babeș” University of Medicine and Pharmacy Timișoara.
Statistical Analysis
Statistical analysis was accomplished using the 19.6 version of the MedCalc statistical software (Belgium). Continuous data were given as mean ± 1 standard deviation (SD). Categorical variables were given as numbers and percentages. The differences between the groups were compared using the paired t-test. The association between variables was measured using Pearson`s correlation coefficient. The factors significantly associated with LA dysfunction underwent univariate and multivariate logistic regression analysis. The identified independent predictors were compared using the receiver operating characteristic (ROC) curves. Values of P< 0.05 were considered statistically significant for all tests.
Reproducibility
The study was performed by one echocardiographer and one sonographer. For intra-observer reproducibility, the intra-class correlation coefficient (ICC) was calculated and showed a good intra-observer agreement. The ICC was 0.88 (95% CI 0.81–0.92) for echocardiography and 0.85 (95% CI 0.77–0.90) for liver ultrasonography.
Results
Of the 208 MetS subjects initially evaluated, 30 (16%) were excluded because of improper quality of the echocardiographic images, and 28 (15%) were removed because of validation failing at CAP and VCTE.
Finally, 150 MetS subjects were enrolled in the research group and 150 age– and sex– corresponding subjects without MetS were included in the control group. The baseline characteristics of the two groups are shown in Table 1. The age of the subjects varied from 31 to 85 years (mean 62.4±10 years). The frequency distribution of age is presented in Figure 2. 164 subjects (54%) were males. We noted no significant differences among the two groups regarding the heart rate, the smoking status, the serum transaminase, and the low-density lipoprotein (LDL)-cholesterol levels. MetS patients were significantly more frequent hypertensive, diabetics obese. They presented higher values of triglycerides, glycosylated hemoglobin (HbA1c), FPG, and lower values of total cholesterol and of high-density lipoprotein (HDL) cholesterol.
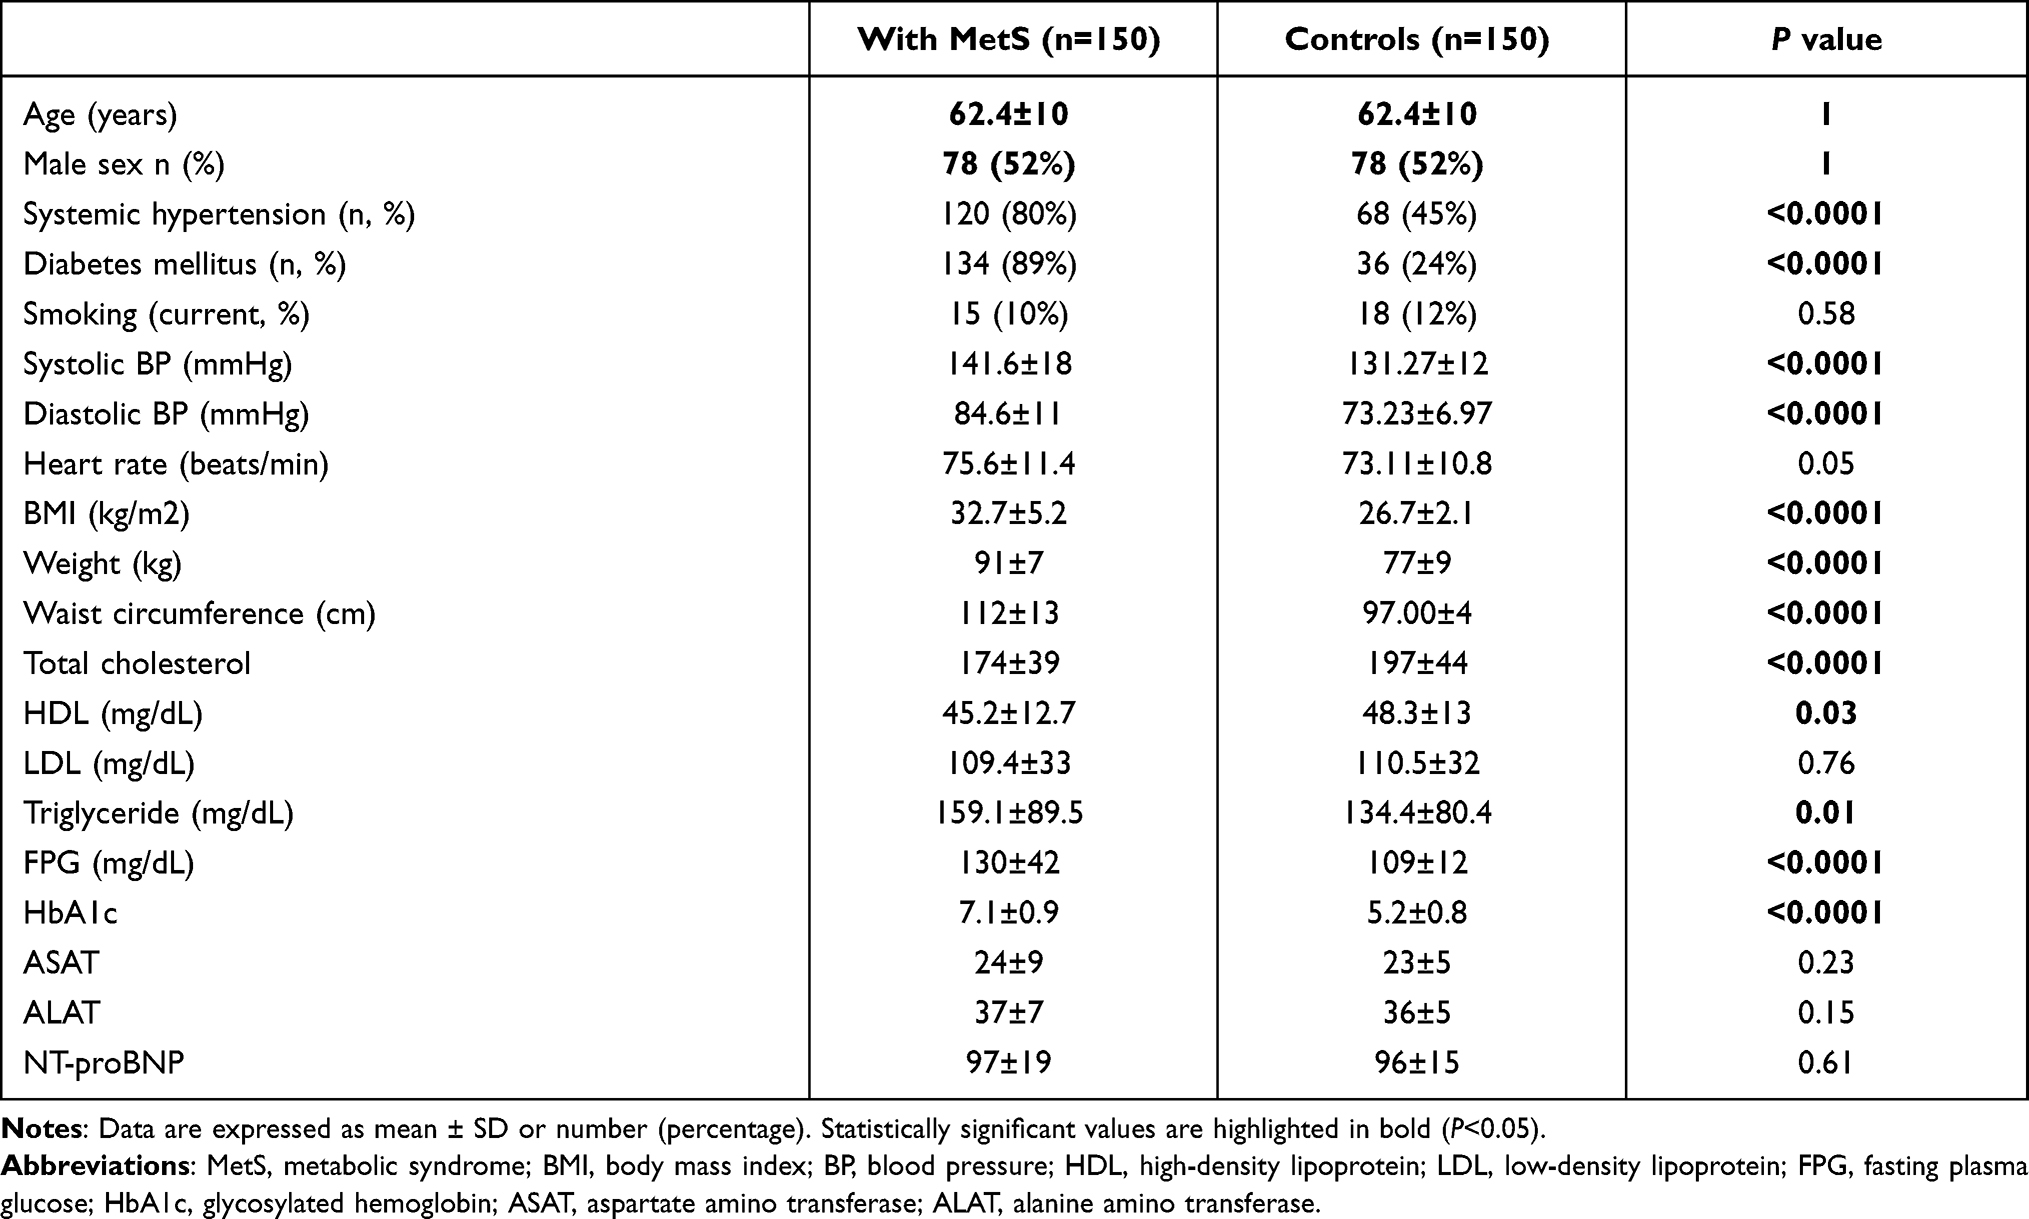 |
Table 1 Clinical and Biochemical Characteristics of MetS and Control Groups |
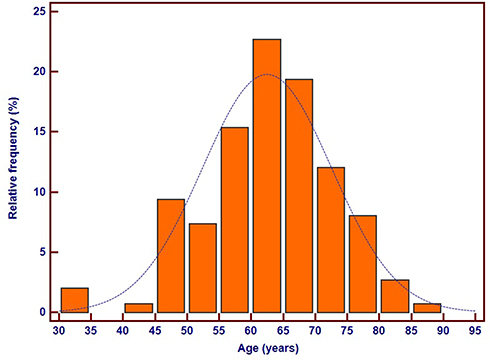 |
Figure 2 Frequency distribution of age in metabolic syndrome patients. |
The MetS patients had the following distribution of steatosis severity assessed by CAP: 21 (14%) –S0, 11 (7%) - S1, 11 (7%)-S2, and 107 (71%) - S3. Both liver steatosis and fibrosis were frequent and more severe in the MetS group (P<0.0001, respectively P=0.04), as shown in Table 2.
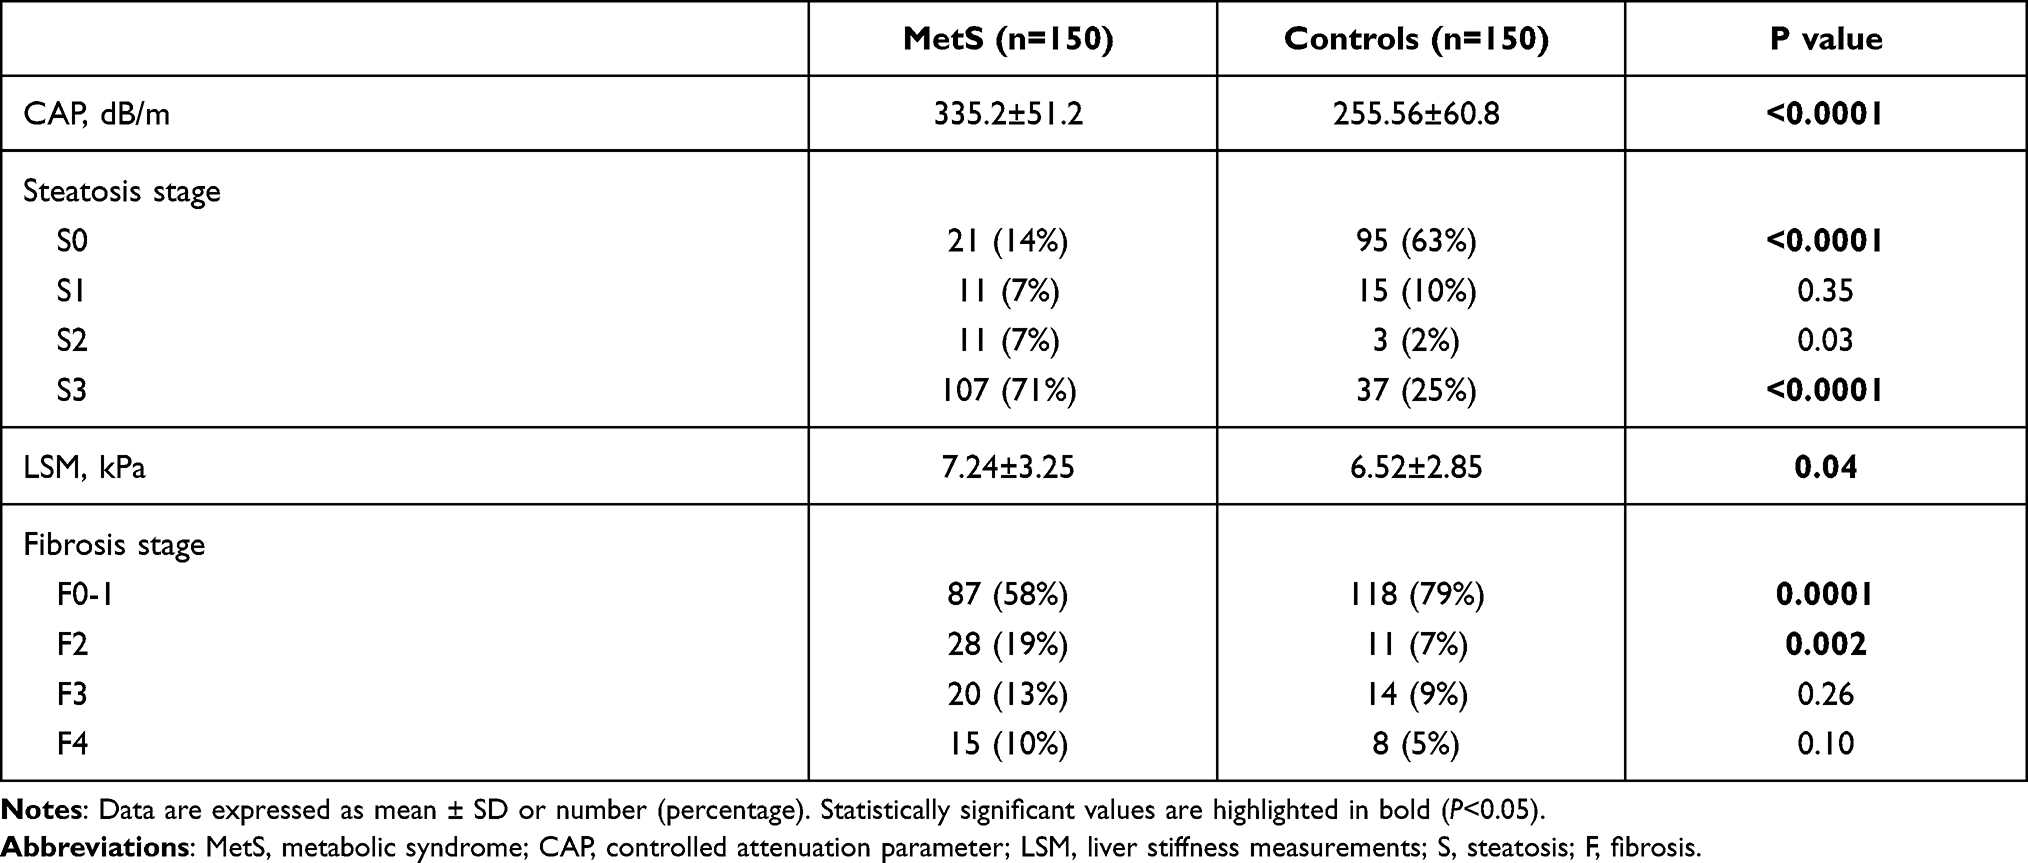 |
Table 2 Evaluation of Liver Fibrosis and Steatosis |
Echocardiography data are shown in Table 3. There were no significant differences between the two groups concerning the conventional parameters of LV structure and systolic function, but significantly more of the MetS patients presented LV diastolic dysfunction. We found no differences regarding the LA diameters, volumes and ejection fractions between the MetS patients and the controls. By contrast, the 2D-STE identified subtle LA dysfunction in the MetS subjects, revealed by significant lower longitudinal strains and strain rates during the ventricular contraction, the ventricular early diastolic filling and the atrial contraction. LA stiffness was significantly higher in the MetS subjects (P<0.0001).
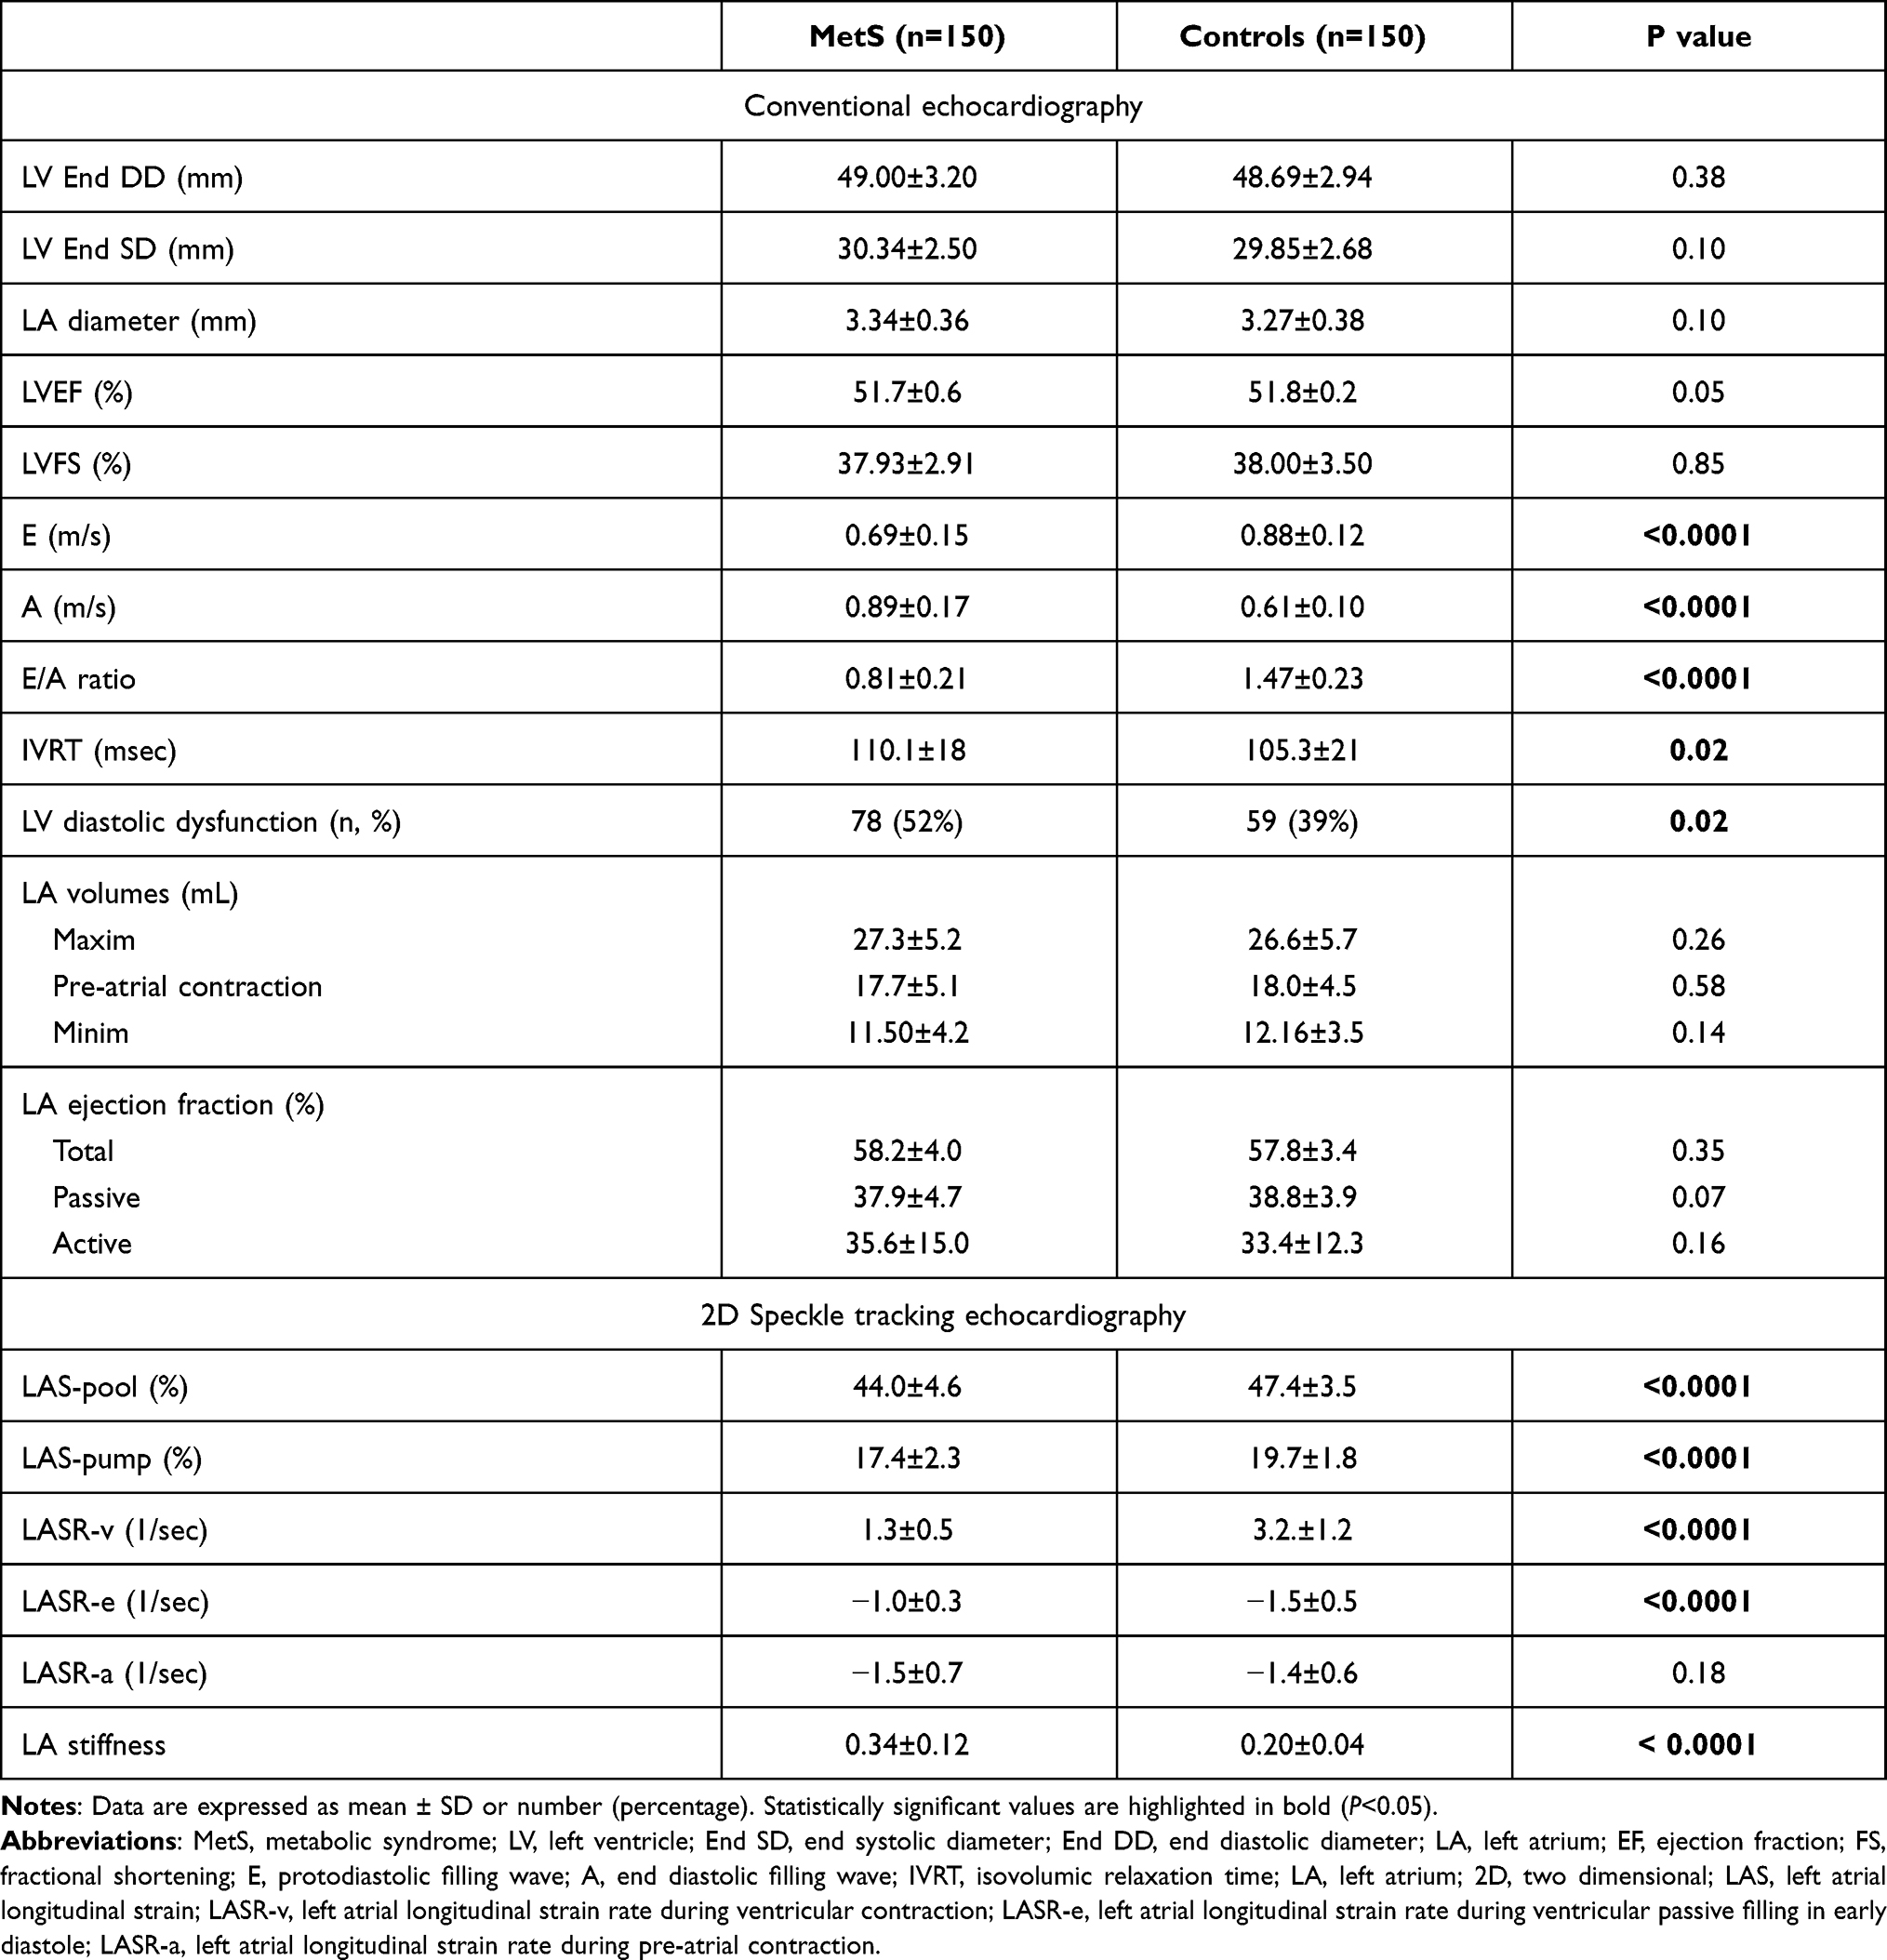 |
Table 3 Left Ventricular Echocardiographic Data in MetS and Control Groups |
In univariate regression analysis, the variables associated with LV diastolic dysfunction in MetS patients were: liver steatosis grade ≥2, liver fibrosis grade ≥2, the longitudinal LA peak strain during the reservoir phase, the LA strain rate during ventricular contraction and the LA stiffness. In multivariate logistic regression, two variables were selected as independent predictors of LV diastolic dysfunction, namely the liver stiffness (P=0.0003) and the LA stiffness (P<0.0001), as shown in Table 4. The adjusted variable in multivariate analysis was the presence of the metabolic syndrome.
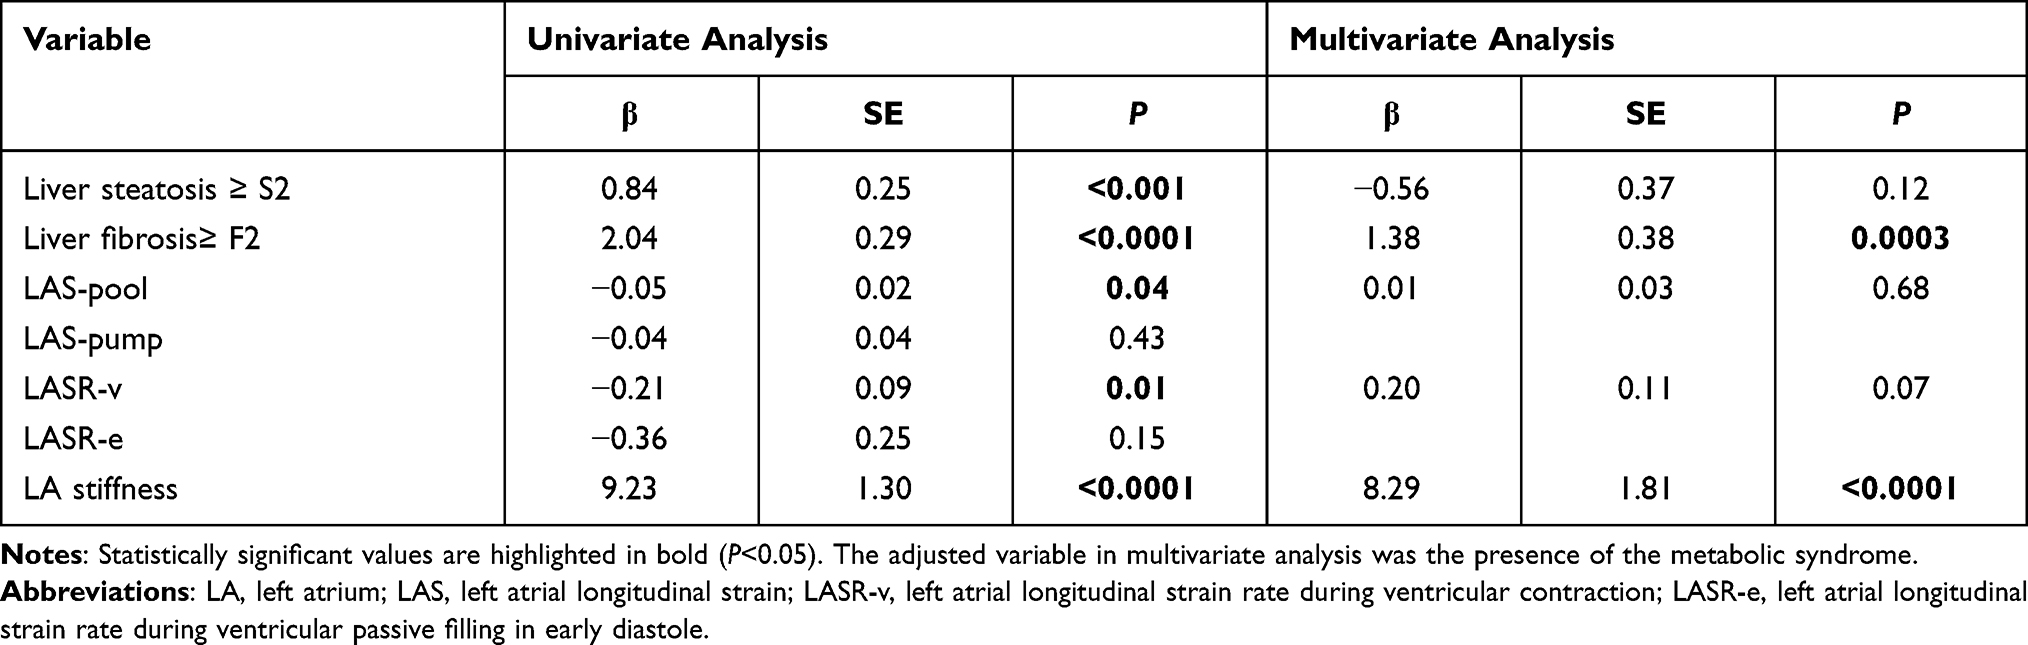 |
Table 4 Correlations Between LV Diastolic Dysfunction and 2D-Speckle Tracing Parameters of the Left Atrium |
The associations between the independent variables linked with LV diastolic dysfunction in MetS patients are presented in Figure 3.
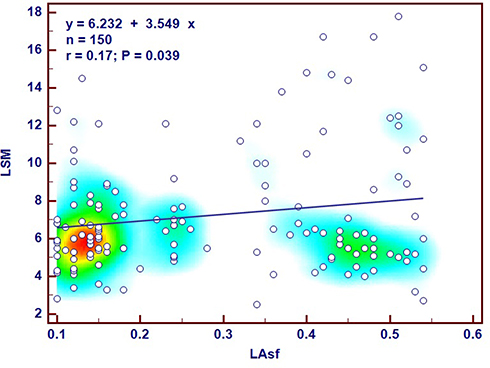 |
Figure 3 Correlations between the independent variables associated with subclinical LV diastolic dysfunction in metabolic syndrome patients. Abbreviations: LSM, liver stiffness measurement; LAsf, left atrial stiffness; AUC, area under the curve. |
LA stiffness predicted subclinical LV diastolic dysfunction in MetS patients with a sensitivity of 45% and a specificity of 96% when using a cut-off value >0.38.
When comparing the receiver operating characteristics (ROC) curves of the two independent predictors of LV diastolic dysfunction, we found that the area under the curve (AUC) was slightly greater for the LA stiffness than for the liver stiffness measurement ≥2, but the difference was not significant (Figure 4).
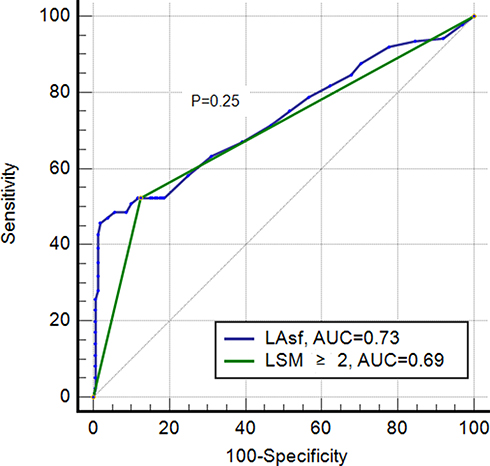 |
Figure 4 Comparison of the receiver operating characteristics (ROC) curves of the independent variables associated with subclinical LV diastolic dysfunction in metabolic syndrome patients. Abbreviations: MetS, metabolic syndrome; LAsf, left atrial stiffness; LSM, liver stiffness measurement; AUC, area under the curve. |
LA stiffness >0.38 was present in 36 (24%) of the MetS patients and in 12 (8%) of the control group subjects (P<0.0001). The relative risk of the MetS patients to have a LAsf > 0.38 was 3.0 when compared to the control group (AUC=0.666, 95% CI 1.62 to 5.53, P< 0.001).The LAsf >0.38 was positively associated with a liver fibrosis stage F≥2 (r=0.59, 95% CI 0.51 to 0.66, P< 0.0001) and a liver steatosis stage S ≥2 (r=0.42, 95% CI 0.32 to 0.51, P< 0.0001).
Discussion
There is increasing evidence regarding the impact of the MetS on the left heart structure and function. Every constituent of the MetS is known to induce LV myocardial fibrosis. The same fibrotic changes were found in the myocardial walls of the LA and LV, consequent to the MetS components such as obesity diabetes, and hypertension.23–25 While myocardial fibrosis progresses, diastolic compliance of the LV decreases and LV filling pressures increase, influencing the LA function. Galderisi26 found an association between insulin resistance and LV diastolic parameters in hypertensive patients. Diabetes mellitus patients with a normal LV systolic function, with or without hypertension, were found to have had lower peak LA strains and strain rates than the controls.24
The reported prevalence of LV diastolic dysfunction is 16% in the general population, 35% in individuals with metabolic syndrome, and 50% in individuals with prediabetes and overt type 2 diabetes.4,27 In our study, the prevalence of LV diastolic dysfunction was 52% in the MetS patients and 39% in the control group. The higher prevalence of the LV diastolic dysfunction could be explained by the fact that 89% of the MetS patients had diabetes and 80% were hypertensive.
The confirmation of cardiac dysfunction in persons with MetS was first done by clinical investigations applying conventional and tissue Doppler echocardiography.19 These methods proved to have several limits in assessing cardiac function, such as the poor sensitivity, the angle dependency, and the inability to reveal subtle declines in myocardial contractility. Two-dimensional speckle-tracking echocardiography (2D-STE) proved to be a more trustworthy manner for the recognition of emerging ventricular dysfunction, by using a quantitative assessment of myocardial deformation.28 2D-STE was lately used for the assessment of the atrial performance too, permitting a precise, angle free assessment of the atrial deformation.29
A fundamental notion of speckle-tracking imaging is represented by the strain, measured as a percentage (%) and stated as the fractional shortening of a myocardial segment. The strain can be measured in every segment of the heart chamber (regional strain). The average of all these findings results in the peak strain (PS), signifying the peak ventricular performance.28
LA dysfunction could have an important role in the pathophysiology of heart failure with preserved LV ejection fraction (HFpEF).30 LA strain values are related to invasively determined LV filling pressures. They decrease gradually with increasing LV diastolic dysfunction grades and could be used to detect and evaluate the severity of LV diastolic dysfunction.31
As the diastolic and systolic heart failure patients have similar mortality risk rates, it is of vital importance to detect early, preclinical changes in cardiac function and to implement optimal therapeutic strategies.32 It was demonstrated that functional remodeling is preceding the structural remodeling consisting of the dilatation of the cardiac chamber.20,30 Accordingly, although in our study the LA diameters, volumes, and ejection fractions between the MetS subjects and the controls did not differ significantly, the 2D-STE measured LA deformation, evaluated by the peak LA strains and strain rates was significantly impaired in the presence of the MetS (P<0.0001).
As already established, the LA reservoir strain is significantly associated with the degree of LA myocardial fibrosis evaluated by cardiac magnetic resonance imaging or by histopathology sampling,33,34 and it significantly linked with the invasively quantified LV filling pressure. Its predictive capacity for cardiovascular events is superior to that of the LA maximal volume.9 But, its diagnostic and predictive abilities are exceeded by another parameter that evaluates the LA structure and function- the LA stiffness. This factor indicates the adjustment in LA pressure needed to expand the LA volume to a certain degree.30,31,35 Kurt showed that LA stiffness can be used to discriminate between HF with preserved LVEF and asymptomatic LV diastolic dysfunction.36 LA stiffness also proved to have a superior correlation with the extent of LA fibrosis than the LA strain.34 The fact that two variables that are obtained with different echocardiographic techniques, and point toward the LV filling pressure, are used to calculate LA stiffness, might justify the diagnostic accuracy of the LA stiffness. We found that LA stiffness was superior to LA volume and LA strain parameters in identifying subclinical LV diastolic dysfunction and that this parameter was significantly correlated with a liver stiffness measurement ≥ 2. In our study, analyzing the ROC curve of the LA stiffness predictive capacity for LV diastolic dysfunction in MetS subjects, we found that the cut-off value of 0.38 had a high specificity (96%) and a sensitivity of 45%, completing the echocardiographic requirements to avoid false- positive statements.37 12% to 16% of the NAFLD patients die due to coronary artery disease (CAD), while the CAD-related mortality is only 1–3% in those without NAFLD.38 This finding suggests a solid link between NAFLD and CVD mortality. This association could be clarified by several possible theories. A possible explanation could be the fact that NAFLD is associated with myocardial insulin resistance,39 as well as with impaired cardiac structure and function.40 Several studies pointed to the impact of the NAFLD on LV diastolic dysfunction.40–42 Fotbolcu reported abnormal LV diastolic function in non-hypertensive and non-diabetic NAFLD subjects.43 Another study revealed impaired LV diastolic function, demonstrated by cardiac ultrasound imaging; in obese adolescents with NAFLD.44 Cardiac magnetic resonance imaging exposed decreased myocardial strains and LV diastolic dysfunction in adult subjects with NAFLD and without a known cardiac disorder.45 Despite the evidence that subjects with NAFLD are exposed to LV structural abnormalities and diastolic dysfunction, the link between myocardial and hepatic fibrosis was not yet confirmed because of the inadequate utilization of ultrasonography and computed tomography. Our study participants were thoroughly investigated by liver CAP and VCTE and to identify and grade liver steatosis and fibrosis, and by conventional and 2D-STE for cardiac structural and functional assessment. The present study confirmed the association between liver fibrosis ≥2 stiffness and left ventricular diastolic dysfunction in MetS patients. The MetS patients in our study had a 3 fold higher risk for having an increased LAsf when compared to the control group (P< 0.001). The increased LAsf is another parameter indicating LV diastolic dysfunction. A LAsf >0.38 was positively associated with a liver fibrosis stage F≥2 and a liver steatosis stage S ≥2 (P< 0.0001).
Early recognition of both heart and liver disorders in MetS subjects is extremely important, as suitable life-style changes and medical therapy might prevent or at least delay the occurrence of heart failure and of liver cirrhosis. These measures might decrease morbidity and mortality, as well as the expenses to cover the health assurance.
Limitations
The evaluation of liver involvement was performed non-invasively, although liver biopsy is the gold standard assessment method. CAP, VCTE, and STE trustworthiness are dependent on image quality. LA stiffness is a valuable parameter in LV diastolic evaluation, but its cut-off values need to be validated in more numerous and larger patient cohorts.
Conclusion
In MetS patients, the LV diastolic dysfunction, assessed by conventional echocardiography, was significantly and independently associated with a hepatic fibrosis stage ≥ 2. Another predictor of the LV diastolic dysfunction, the LA stiffness, assessed by b2D-STE, was independently associated with both liver steatosis stage ≥2 and liver fibrosis stage ≥2. Our study suggests that that CAP, VCTE, and 2D-STE should become habitual assessment in MetS patients. The newer parameters resulting from STE have shown better sensitivity than the conventional ones, and a significant correlation with liver stiffness.
Disclosure
Prof. Dr. Ioan Sporea reports personal fees from General Electric, Philips, Siemens, Toshiba/Canon, outside the submitted work. The authors report no other conflicts of interest in this study.
References
1. Mottillo S, Filion KB, Genest J, et al. The metabolic syndrome and cardiovascular risk a systematic review and meta-analysis. J Am Coll Cardiol. 2010;56(14):1113–1132. doi:10.1016/j.jacc.2010.05.034
2. Grundy SM, Cleeman JI, Daniels SR, et al. Diagnosis and management of the metabolic syndrome: an American Heart Association/National Heart, Lung, and Blood Institute scientific statement. Circulation. 2005;112:
3. Balkau B, Valensi P, Eschwège E, Slama G. A review of the metabolic syndrome. Diabetes Metab. 2007;33:
4. Von Bibra H, Sutton MS. Diastolic dysfunction in diabetes and the metabolic syndrome: promising potential for diagnosis and prognosis. Diabetologia. 2010;53:
5. Suzuki T, Katz R, Jenny NS, et al. Metabolic syndrome, inflammation, and incident heart failure in the elderly: the cardiovascular health study. Circ Heart Fail. 2008;1(4):242–248. doi:10.1161/CIRCHEARTFAILURE.108.785485
6. Seo JM, Park TH, Lee DY, et al. Subclinical myocardial dysfunction in metabolic syndrome patients without hypertension. J Cardiovasc Ultrasound. 2011;19:
7. Mavrea A, Gyalai KI, Citu I, et al. Long term prognosis and modes of death in heart failure patients with reduced versus preserved left ventricular systolic function. Eur Sci J. 2013;3:246–253.
8. To AC, Flamm SD, Marwick TH, Klein AL. Clinical utility of multimodality LA imaging: assessment of size, function, and structure. JACC Cardiovasc Imaging. 2011;4:788–798. doi:10.1016/j.jcmg.2011.02.018
9. Cameli M, Lisi M, Focardi M, et al. Left atrial deformation analysis by speckle tracking echocardiography for prediction of cardiovascular outcomes. Am J Cardiol. 2012;110:264–269. doi:10.1016/j.amjcard.2012.03.022
10. Younossi Z, Koenig A, Abdelatif D, et al. Peak epidemiology of nonalcoholic fatty liver disease-meta-analytic assessment of prevalence, incidence, and outcomes. Hepatology. 2016;64:73–84. doi:10.1002/hep.28431
11. Ong JP, Pitts A, Younossi ZM. Increased overall mortality and liver related mortality in non-alcoholic fatty liver disease. J Hepatol. 2008;49:608–612. doi:10.1016/j.jhep.2008.06.018
12. Vitel A, Sporea I, Mare R, et al. Association between subclinical left ventricular myocardial systolic dysfunction detected by strain and strain‑rate imaging and liver steatosis and fibrosis detected by elastography and controlled attenuation parameter in patients with metabolic syndrome. Diabetes Metabol Syndr Obes. 2020;13:3749–3759. doi:10.2147/DMSO.S268916
13. Paulus WJ, Tschöpe C, Sanderson JE, et al. How to diagnose diastolic heart failure: a consensus statement on the diagnosis of heart failure with normal left ventricular ejection fraction by the Heart Failure and Echocardiography Associations of the European Society of Cardiology. Eur Heart J. 2007;28:2539–2550.
14. Alberti KG, Zimmet P, Shaw J. Metabolic syndrome – a new world‑wide definition. A consensus statement from the International Diabetes Federation. Diabet Med. 2006;23(5):
15. Williams B, Mancia G, Spiering W, et al. 2018 ESC/ESH guidelines for the management of arterial hypertension. Eur Heart J. 2018;1–98.
16. European Association for Study of Liver. EASL-ALEH Clinical Practice Guidelines: non-invasive tests for evaluation of liver disease severity and prognosis. J Hepatol. 2015;63:237–264.
17. Eddowes PJ, Sasso M, Allison M, et al. Accuracy of FibroScan controlled attenuation parameter and liver stiffness measurement in assessing steatosis and fibrosis in patients with nonalcoholic fatty liver disease. Gastroenterology. 2019;156(6):1717–1730. doi:10.1053/j.gastro.2019.01.042
18. Dietrich A, Bamber C, Berzigotti J, et al. EFSUMB guidelines and recommendations on the clinical use of liver ultrasound elastography, update 2017 (long version). Eur J Ultrasound. 2017;38:e16–e47.
19. Lang RM, Badano LP, Mor-Avi V, et al. Recommendations for cardiac chamber quantification by echocardiography in adults: an update from the American Society of Echocardiography and the European Association of Cardiovascular Imaging. Eur Heart J. 2015;16:233–271. doi:10.1093/ehjci/jev014
20. Brecht A, Oertelt-Prigione S, Seeland U, et al. Left atrial function in preclinical diastolic dysfunction: two-dimensional speckle tracking echocardiography-derived results from the BEFRI trial. J Am Soc Echocardiogr. 2016;29:750–758. doi:10.1016/j.echo.2016.03.013
21. Cottrell C, Kirkpatrick JN. Echocardiographic strain imaging and its use in the clinical setting. Expert Rev Cardiovasc Ther. 2010;8:
22. Morris DA, Gailani M, Vaz P´erez A, et al. Left atrial systolic and diastolic dysfunction in heart failure with normal left ventricular ejection fraction. J Am Soc Echocardiogr. 2011;24:651–662. doi:10.1016/j.echo.2011.02.004
23. Cavalera M, Wang J, Frangogiannis NG. Obesity, metabolic dysfunction, and cardiac fibrosis: pathophysiological pathways, molecular mechanisms, and therapeutic opportunities. Transl Res. 2014;164(4):323–335. doi:10.1016/j.trsl.2014.05.001
24. Muranaka A, Yuda S, Tsuchihashi K, et al. Quantitative assessment of left ventricular and left atrial functions by strain rate imaging in diabetic patients with and without hypertension. Echocardiography. 2009;26:262–271. doi:10.1111/j.1540-8175.2008.00805.x
25. Keteepe-Arachi T, Sharma S. Cardiac fibrosis in hypertension. J Hypertens Manag. 2017;3:23. doi:10.23937/2474-3690/1510023
26. Galderisi M, Tagliamonte MR, D’Errico A, et al. Independent association of plasma leptin levels and left ventricular isovolumic relaxation in uncomplicated hypertension. Am J Hypertens. 2001;14:1019–1024. doi:10.1016/S0895-7061(01)02137-9
27. Ayalon N, Gopal DM, Mooney DM, et al. Preclinical left ventricular diastolic dysfunction in metabolic syndrome. Am J Cardiol. 2014;114(6):838–842. doi:10.1016/j.amjcard.2014.06.013
28. Voigt JU, Pedrizzetti G, Lysyansky P, et al. Definitions for a common standard for 2D speckle tracking echocardiography: consensus document of the EACVI/ASE/Industry Task Force to standardize deformation imaging. J Am Soc Echocardiogr. 2015;28(2):183–193.
29. Badano LP, Kolias TJ, Muraru D, et al. Standardization of left atrial, right ventricular, and right atrial deformation imaging using two-dimensional speckle tracking echocardiography. Eur Heart J Cardiovasc Imaging. 2018;19:591–600. doi:10.1093/ehjci/jey042
30. Singh A, Addetia K, Maffessanti F, et al. LA strain for categorization of LV diastolic dysfunction. JACC Cardiovasc Imaging. 2017;10:735–743. doi:10.1016/j.jcmg.2016.08.014
31. Cameli M, Mandoli GE, Loiacono F, et al. Left atrial strain: a new parameter for assessment of left ventricular filling pressure. Heart Fail Rev. 2016;21:65–76. doi:10.1007/s10741-015-9520-9
32. Pionikowski P, Voors AA, Anker SD, et al. 2016 ESC guidelines for the diagnosis and treatment of acute and chronic heart failure. Eur Heart J. 2016;37(27):2129–2200. doi:10.1093/eurheartj/ehw128
33. Her AY, Choi EY, Shim CY, et al. Prediction of left atrial fibrosis with speckle tracking echocardiography in mitral valve disease: a comparative study with histopathology. Korean Circ J. 2012;42:311–318. doi:10.4070/kcj.2012.42.5.311
34. Pilichowska-Paszkiet E, Baran J, Sygitowicz G, et al. Noninvasive assessment of left atrial fibrosis. Correlation between echocardiography, biomarkers, and electroanatomical mapping. Echocardiography. 2018;35:1326–1334. doi:10.1111/echo.14043
35. Singh A, Medvedofsky D, Mediratta A, et al. Peak left atrial strain as a single measure for the non-invasive assessment of left ventricular filling pressures. Int J Cardiovasc Imaging. 2018;35:23–32. doi:10.1007/s10554-018-1425-y
36. Kurt M, Wang J, Torre-Amione G, et al. Left atrial function in diastolic heart failure. Circ Cardiovasc Imaging. 2009;2:10–15. doi:10.1161/CIRCIMAGING.108.813071
37. Nagueh SF, Smiseth OA, Appleton CP, et al. Recommendations for the evaluation of left ventricular diastolic function by echocardiography. J Am Soc Echocardiogr. 2016;29:277–314.
38. Azzam H, Malnick S. Non-alcoholic fatty liver disease - the heart of the matter. World J Hepatol. 2015;7:1369–1376. doi:10.4254/wjh.v7.i10.1369
39. Lautamaki R, Borra R, Iozzo P, et al. Liver steatosis coexists with myocardial insulin resistance and coronary dysfunction in patients with type 2 diabetes. Am J Physiol Endocrinol Metab. 2006;291:E282–E290. doi:10.1152/ajpendo.00604.2005
40. Chung GE, Lee JH, Lee H, et al. Nonalcoholic fatty liver disease and advanced fibrosis are associated with left ventricular diastolic dysfunction. Atherosclerosis. 2018;272:137–144. doi:10.1016/j.atherosclerosis.2018.03.027
41. Bonapace S, Perseghin G, Molon G, et al. Nonalcoholic fatty liver disease is associated with left ventricular diastolic dysfunction in patients with type 2 diabetes. Diabetes Care. 2012;35:389–395. doi:10.2337/dc11-1820
42. Goland S, Shimoni S, Zornitzki T, et al. Cardiac abnormalities as a new manifestation of nonalcoholic fatty liver disease: echocardiographic and tissue Doppler imaging assessment. J Clin Gastroenterol. 2006;40:949–955. doi:10.1097/01.mcg.0000225668.53673.e6
43. Fotbolcu H, Yakar T, Duman D, et al. Impairment of the left ventricular systolic and diastolic function in patients with non-alcoholic fatty liver disease. Cardiol J. 2010;17:457–463.
44. Sert A, Aypar E, Pirgon O, et al. Left ventricular function by echocardiography, tissue Doppler imaging, and carotid intima-media thickness in obese adolescents with nonalcoholic fatty liver disease. Am J Cardiol. 2013;112:436–443. doi:10.1016/j.amjcard.2013.03.056
45. Hallsworth K, Hollingsworth KG, Thoma C, et al. Cardiac structure and function are altered in adults with non-alcoholic fatty liver disease. J Hepatol. 2013;58:757–762. doi:10.1016/j.jhep.2012.11.015
 © 2021 The Author(s). This work is published and licensed by Dove Medical Press Limited. The
full terms of this license are available at https://www.dovepress.com/terms
and incorporate the Creative Commons Attribution
- Non Commercial (unported, 3.0) License.
By accessing the work you hereby accept the Terms. Non-commercial uses of the work are permitted
without any further permission from Dove Medical Press Limited, provided the work is properly
attributed. For permission for commercial use of this work, please see paragraphs 4.2 and 5 of our Terms.
© 2021 The Author(s). This work is published and licensed by Dove Medical Press Limited. The
full terms of this license are available at https://www.dovepress.com/terms
and incorporate the Creative Commons Attribution
- Non Commercial (unported, 3.0) License.
By accessing the work you hereby accept the Terms. Non-commercial uses of the work are permitted
without any further permission from Dove Medical Press Limited, provided the work is properly
attributed. For permission for commercial use of this work, please see paragraphs 4.2 and 5 of our Terms.