")
Back to Journals » Pharmacogenomics and Personalized Medicine » Volume 14
Signature Panel of 11 Methylated mRNAs and 3 Methylated lncRNAs for Prediction of Recurrence-Free Survival in Prostate Cancer Patients
Authors Cai J , Yang F , Chen X, Huang H, Miao B
Received 20 March 2021
Accepted for publication 16 June 2021
Published 12 July 2021 Volume 2021:14 Pages 797—811
DOI https://doi.org/10.2147/PGPM.S312024
Checked for plagiarism Yes
Review by Single anonymous peer review
Peer reviewer comments 2
Editor who approved publication: Dr Martin H Bluth
Jiarong Cai,1,* Fei Yang,1,* Xuelian Chen,1 He Huang,2 Bin Miao3
1Department of Urology, the Third Affiliated Hospital of Sun Yat-Sen University, Guangzhou, Guangdong, 510630, People’s Republic of China; 2General Surgery Department, the Third Affiliated Hospital of Sun Yat-sen University, Guangzhou, Guangdong, 510630, People’s Republic of China; 3Department of Organ Transplantation, the Third Affiliated Hospital of Sun Yat-Sen University, Guangzhou, Guangdong, 510630, People’s Republic of China
*These authors contributed equally to this work
Correspondence: He Huang
General Surgery Department, the Third Affiliated Hospital of Sun Yat-sen University, No. 600, Tianhe Road, Guangzhou, Guangdong, 510630, People’s Republic of China
Email [email protected]
Bin Miao
Department of Organ Transplantation, the Third Affiliated Hospital of Sun Yat-Sen University, No. 600, Tianhe Road, Guangzhou, Guangdong, 510630, People’s Republic of China
Tel +86-20-82179517
Fax +86-20-82179517
Email [email protected]
Background: Radical prostatectomy is the main treatment for prostate cancer (PCa), a common cancer type among men. Recurrence frequently occurs in a proportion of patients. Therefore, there is a great need to early screen those patients to specifically schedule adjuvant therapy to improve the recurrence-free survival (RFS) rate. This study aims to develop a biomarker to predict RFS for patients with PCa based on the data of methylation, an important heritable contributor to carcinogenesis.
Methods: Methylation expression data of PCa patients were downloaded from The Cancer Genome Atlas (TCGA), Gene Expression Omnibus database (GSE26126), and the European Bioinformatics Institute (E-MTAB-6131). The stable co-methylation modules were identified by weighted gene co-expression network analysis. The genes in modules were overlapped with differentially methylated RNAs (DMRs) screened by MetaDE package in three datasets, which were used to screen the prognostic genes using least absolute shrinkage and selection operator analyses. The prognostic performance of the prognostic signature was assessed by survival curve analysis.
Results: Five co-methylation modules were considered preserved in three datasets. A total of 192 genes in these 5 modules were overlapped with 985 DMRs, from which a signature panel of 11 methylated messenger RNAs and 3 methylated long non-coding RNAs was identified. This signature panel could independently predict the 5-year RFS of PCa patients, with an area under the receiver operating characteristic curve (AUC) of 0.969 for the training TCGA dataset and 0.811 for the testing E-MTAB-6131 dataset, both of which were higher than the predictive accuracy of Gleason score (AUC = 0.689). Also, the patients with the same Gleason score (6– 7 or 8– 10) could be further divided into the high-risk group and the low-risk group.
Conclusion: These results suggest that our prognostic model may be a promising biomarker for clinical prediction of RFS in PCa patients.
Keywords: prostate cancer, recurrence-free survival, methylation, prognostic signature
Introduction
Prostate cancer (PCa) is one of the most common cancers among men. It was estimated that there were 248,530 new cases and 34,130 deaths in the United States in 2021.1 Radical prostatectomy is considered as the first-line treatment option for PCa patients, but recurrence (biochemical, BCR; or clinical) frequently occurs in 10–40% of patients after curative surgery,2–4 which leads to the cumulative 5-year recurrence-free survival (RFS) rate of only about 65%.3,5 Clinically, prostate-specific antigen (PSA) level,6 Gleason score,7 and tumor, node, metastasis (TNM) staging8 are widely used to predict tumor recurrence. Nevertheless, their prediction accuracy remains unsatisfactory (<70%).9 Therefore, there is a great need to identify more effective biomarkers for early screening patients who will possess poor RFS and then specifically scheduling postoperative radiotherapy and chemotherapy for them to reduce the probability of recurrence.10
Recent accumulating evidence pinpoints that epigenetic modifications are heritable contributors to the carcinogenesis of PCa;11,12 among them, DNA methylation is one of the most important epigenetic modifications of the genome,13 indicating methylated genes may represent potential biomarkers for the prediction of RFS in PCa patients. This hypothesis has been confirmed in some studies as following. Protocadherin (PCDH)-10 and PCDH17 methylation were detected in patients with PCa, but not in controls.14,15 The high methylation levels of PCDH10 and PCDH17 were significantly associated with poor BCR-free survival.14,15 A meta-analysis of seven studies showed that the 5-year BCR-free survival for patients with a high methylation status in the paired-like homeodomain transcription factor 2 (PITX2) gene was significantly lower than that for patients with a low methylation status (71% vs 90%).16 Xu et al reported that patients with a lower methylation level of the long interspersed nucleotide elements (LINE-1) gene [hazard ratios (HR) = 3.34, 95% confidence interval (CI) = 1.32–8.45] and a higher methylation level of DNA repeats D4Z4 gene [HR = 4.12, 95% CI = 1.32–12.86] exhibited markedly increased risks of BCR and significantly shorter BCR-free survival time.17 Stott-Miller et al found the presence of promoter hypermethylation of the homeobox D3 (HOXD3) gene in patients with PCa recurrence compared with those without recurrence. The median time for RFS was shorter in the high methylation group than that in the HOXD3 low methylation group.18 Analysis of The Cancer Genome Atlas (TCGA) data demonstrated that the methylation status in the gene of programmed death-1 receptor (PDCD1)19 or solute carrier organic anion transporter family member 4C1 (SLCO4C1)20 was an independent prognostic biomarker for poor RFS in patients with PCa. Combination with a 52-gene methylation signature was also indicated to improve the prediction power of standard clinical-pathological parameters for RFS [the area under the receiver operating characteristic (ROC) curve (AUC): 0.78 vs 0.73].21 However, effective epigenetic biomarkers for RFS prediction remain lacking in PCa.
Our purpose in this study was to develop and validate a novel methylation signature panel to identify patients at a high risk of poor RFS using the TCGA dataset and data collected from Gene Expression Omnibus (GEO) or European Bioinformatics Institute (EMBL-EBI) databases. The superior prognostic performance of this signature panel to clinical parameters was evaluated comprehensively, including AUC, concordance index (C-index), and stratification analyses. Compared with the study of Geybels et al,21 our methylation signature not only included protein-encoding messenger RNAs (mRNAs), but also long non-coding RNAs (lncRNAs). Previous studies suggested that the prognostic power of methylated lncRNAs-22 or lncRNA-mRNA-based23 prognostic signature was higher than that of mRNA alone. Accordingly, our signature may be more helpful for predicting prognosis and guiding the individualized treatment of PCa patients.
Materials and Methods
Data Collection and Preprocessing
Matched methylation (platform, Illumina Human Methylation 450), level 3 mRNA-seq (platform, Illumina HiSeq 2000 RNA Sequencing), and corresponding clinical data of PCa patients were obtained from the TCGA database (https://portal.gdc.cancer.gov/) on October 25, 2019, in which 51 samples were normal controls and 495 were PCa (375 samples reported the recurrence status, including 47 from patients with recurrence and 328 from patients without recurrence). Furthermore, methylation datasets of PCa were also downloaded from GEO (http://www.ncbi.nlm.nih.gov/geo/) or EMBL-EBI database (https://www.ebi.ac.uk). A total of 83 samples reporting the status of recurrence (recurrence, n = 17; non-recurrence, n = 68) were included in the GSE26126 dataset (platform, Illumina HumanMethylation27 BeadChip),24 which was used for the validation of modules; there were 108 samples (recurrence, n = 15; non-recurrence, n = 93) in the E-MTAB-6131 dataset (platform, Illumina Human Methylation 450), which was used for validations of both module and survival results.
The annotations of lncRNAs and mRNAs in each dataset were performed using the HUGO Gene Nomenclature Committee (http://www.genenames.org/).25 RNAs with a median expression value of 0 were deleted. The overlapped lncRNAs and mRNAs in all three datasets were used for the following analyses.
Identification of Co-Methylation Modules
Based on all shared methylated RNAs in TCGA (training), GSE26126 (testing), and E-MTAB-6131 (testing) datasets, co-methylation networks were constructed using the weighted gene co-expression network analysis (WGCNA) software (v1.61; https://cran.r-project.org/web/packages/WGCNA/index.html).26 Briefly, the verboseScatterplot function was conducted to explore the correlations in the methylation level and the connectivity of all RNAs between any two datasets to confirm their comparability. Based on the criterion of scale-free topology, the pickSoftThreshold function was used to select an appropriate soft-thresholding power (β) to construct the weighted adjacency matrix which was subsequently transformed into a topological overlap matrix (TOM), a measure for the correlations between the methylation levels of two genes. The hierarchical clustering dendrogram was obtained based on the TOM-based dissimilarity. The DynamicTreeCut function27 was applied to identify modules with cutHeight = 0.995 and minSize = 100. The modulePreservation function28 was carried out to assess the preservation of identified modules between the training set and two testing sets, with Z-score >5 as the statistical threshold. In addition, moduleTraitCor and moduleTraitPvalue algorithms were chosen to calculate the correlation between module eigengenes and clinical traits in the TCGA dataset.
Identification of Differentially Methylated RNAs (DMRs) and Expressed RNAs (DERs)
The DMRs, including differentially methylated lncRNAs (DMLs) and differentially methylated genes (DMGs) between recurrence and non-recurrence PCa samples, were identified using the MetaDE.ES function in the MetaDE package (v1.0.5, https://cran.r-project.org/web/packages/MetaDE/). Briefly, the heterogeneity was assessed across three datasets (TCGA, GSE26126, and E-MTAB-6131) using tau2 statistic and Chi-square-based Q-test. Genes with tau2 = 0 and Qpval >0.05 were considered to be homogeneous and used for the differential analysis. The gene expression difference was determined by the MetaDE.pvalue algorithm, with a false discovery rate (FDR) <0.05 selected as the significance threshold. The expression consistency of DMLs and DMGs in three datasets was detected by calculating the log2FC(fold change). The heatmap.sig.genes function in the MetaDE package was used to plot the heatmap of DMRs in three datasets.
The differentially expressed RNAs (DERs) between recurrence and non-recurrence PCa samples or between PCa and normal controls were identified using limma package in R (v3.34.7; https://bioconductor.org/packages/release/bioc/html/limma.html).29 A p-value of <0.05 was considered as the statistical threshold.
Development and Validation of a Prognostic Scoring Model Based on DMRs
A Venn diagram (http://bioinformatics.psb.ugent.be/webtools/Venn/) was constructed to screen the overlap between co-methylation module RNAs and DMRs. The shared genes were used for survival analysis. Based on the survival information of patients in the TCGA dataset, univariate Cox regression analysis in the “survival” package of R (v2.41–1; http://bioconductor.org/packages/survivalr/) was used to evaluate the association between the methylation levels of DMRs and RFS. Significant DMRs with a log-rank p < 0.05 were selected for multivariate Cox regression analysis. The signature identified by multivariate analysis was further set as input for an L1 penalized (Least Absolute Selection and Shrinkage Operator, LASSO) Cox-proportional hazard model analysis (penalized package, v0.9–5; http://bioconductor.org/packages/penalized/)30,31 to obtain an optimal signature panel for prognosis prediction. The prognostic risk scoring model was constructed based on the methylation levels of prognostic RNAs (MethyDMRs) and their LASSO coefficients (βDMRs):
Risk score = βDML1 × ExpDML1 … + βDMLn × ExpDMLn + βDMG1 × ExpDMG1 + ….βDMGn × ExpDMGn
The risk score was calculated for each patient in the TCGA dataset. Patients were divided into a low-risk group (risk score below the median value) and a high-risk group (risk score above the median value). Kaplan–Meier survival curve analysis and the Log rank test were used to estimate the RFS time of two risk groups. ROC analysis with calculation of AUC was used to evaluate the prognostic ability of the risk scoring model. The prognostic robustness of the risk scoring system was validated in the testing set (E-MTAB-6131).
Furthermore, univariate and multivariate Cox regression and stratification analyses were conducted to estimate the independent prognostic ability of the risk scoring model from clinical characteristics, with p < 0.05 as the statistical significance. The superior predictive efficiency of the risk score for RFS compared with other clinical characteristics was determined by time-dependent ROC curve and C-index analyses.
Function Enrichment Analyses of the Prognostic RNAs
To explore the function of prognostic mRNAs, public web servers gProfiler (http://biit.cs.ut.ee/gprofiler/gost)32 and The Database for Annotation, Visualization and Integrated Discovery (DAVID; v6.8; https://david.ncifcrf.gov) were searched. Data sources included Gene Ontology (GO) terms, Kyoto Encyclopedia of Genes and Genomes (KEGG), Reactome, and Wiki pathways. A p-value <0.05 was selected as the statistical threshold.
The functions of lncRNAs or some mRNAs were predicted according to their co-expressed mRNAs. The cor.test function (https://stat.ethz.ch/R-manual/R-devel/library/stats/html/cor.test.html) in R was used to calculate the Pearson correlation coefficients (PCC) between prognostic lncRNAs and stable module mRNAs or between module mRNAs using expression and methylation data, respectively. The co-expression pairs with the PCC > 0.4 were used to construct the co-expression network which was visualized in the Cytoscape software (v3.6.1; www.cytoscape.org/).
Results
Identification of Co-Methylation Modules
A total of 9745 RNAs were found to be in interaction with three datasets (TCGA, GSE26126, and E-MTAB-6131). Thus, methylation levels of these RNAs were collected for the WGCNA analysis to mine PCa-associated co-methylation modules. The methylation levels of these RNAs were positively correlated between any two datasets (TCGA-GSE26126, cor = 0.84, p < 1e-200; TCGA-E-MTAB-6131, cor = 0.86, p < 1e-200; GSE26126-E-MTAB-6131, cor = 0.9, p < 1e-200), indicating a good comparability between these datasets. The soft-threshold power of β was selected as 8 to construct a scale-free network (scale-free R2 = 0.9, Figure 1A; mean connectivity = 1, Figure 1B). Genes in the TCGA dataset were clustered into 10 co-methylation modules represented by branches with different colors in the dendrogram (black, blue, brown, green, grey, magenta, pink, red, turquoise, and yellow) (Figure 1C; Table 1). These co-methylation modules were also formed in the analysis of GSE26126 (Figure 1D) and E-MTAB-6131 (Figure 1E) datasets using the same manner as the TCGA dataset. Among these 10 modules, the black, blue, brown, yellow, and turquoise modules were considered to be preserved (Z-score >5; Table 1). These five preserved modules were also proved to be significantly associated with crucial clinical characteristics of PCa patients, such as recurrence (turquoise, blue: negatively associated; black, brown, yellow: positively associated) (Figure 1F). These findings suggest that the genes (including 39 lncRNAs and 2531 mRNAs) in these five modules may be PCa recurrence-associated.
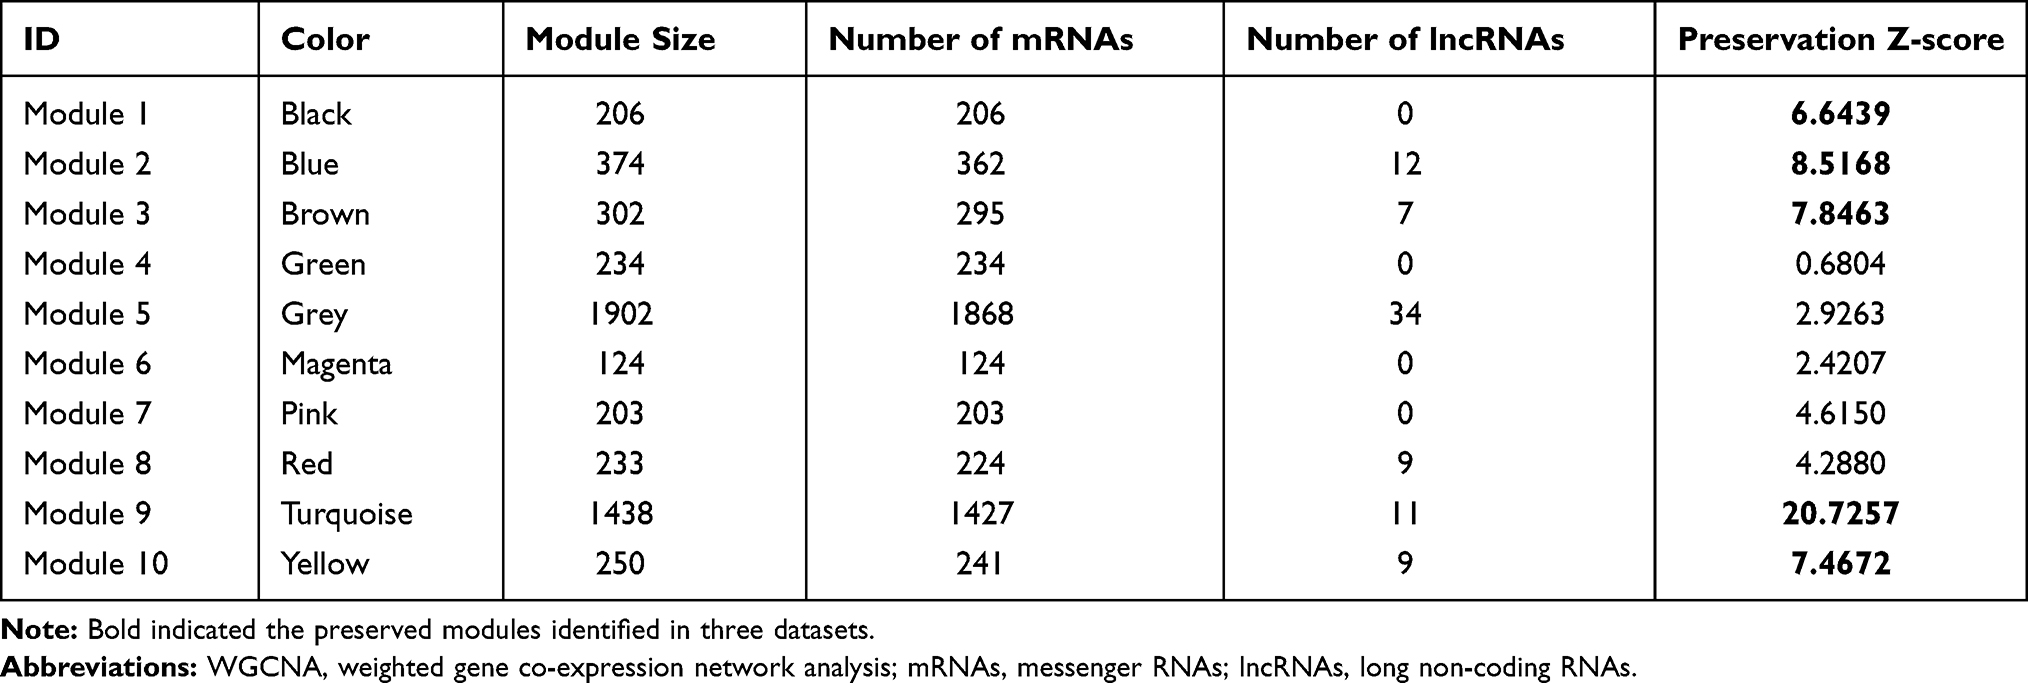 |
Table 1 Co-Methylation Modules Identified by WGCNA |
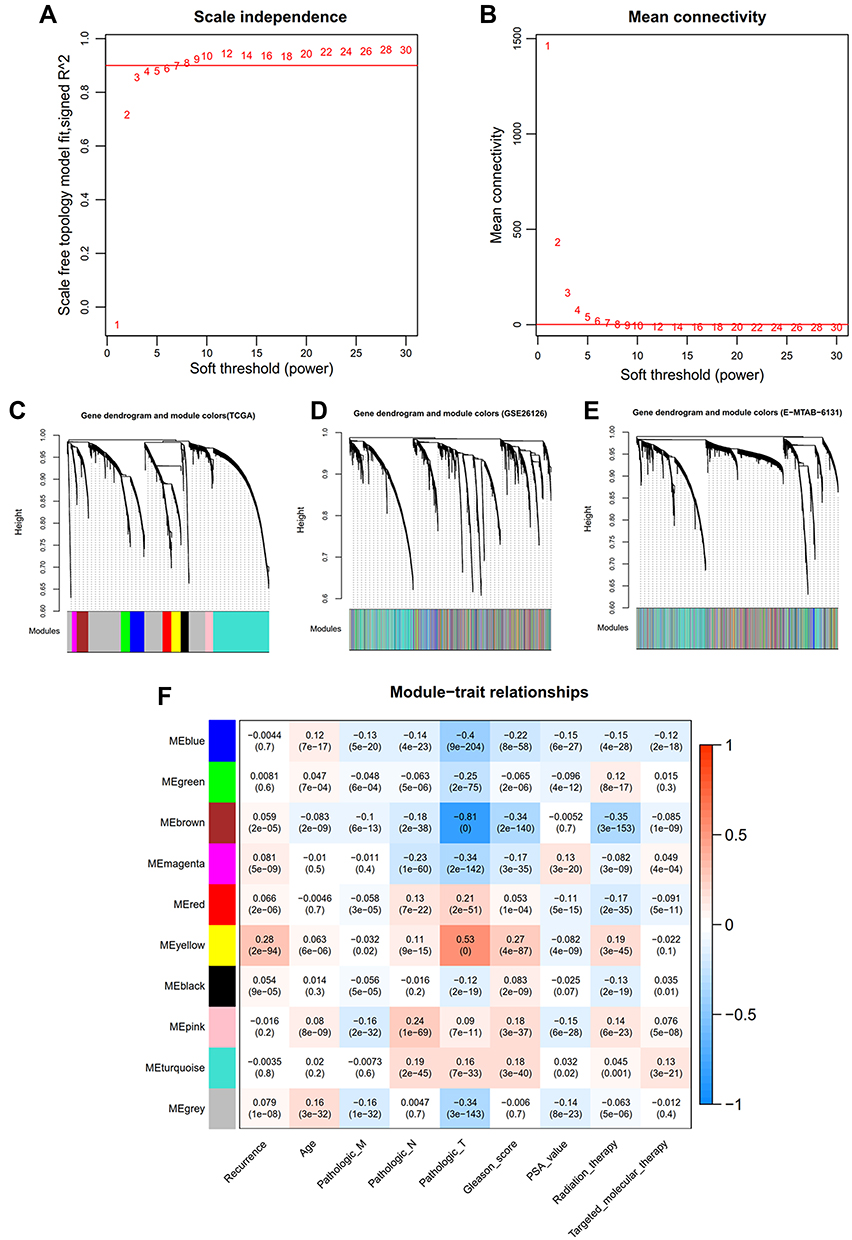 |
Figure 1 WGCNA analysis. (A) soft-threshold power β selected when the R2 reached 0.9 for the first time; (B) the mean connectivity corresponding to different power β values; C-E, clustering dendrogram of co-methylation modules from TCGA (C), GSE26126 (D) and EMBL-EBI (E); (F) the correlations between modules and clinical traits. |
Identification of DMRs in PCa Recurrence Samples
Using the metaDE method, 985 DMRs (including 888 DMGs and 7 DMLs) were identified in PCa recurrence samples compared with non-recurrence tissues, including 577 hypomethylated and 318 hypermethylated (Figure 2A). A total of 192 DMRs (including 5 lncRNAs and 187 mRNAs) were shared with the genes in the five preserved modules (Figure 2B), consisting of 16 (all were mRNAs) in the black module, 30 (including two lncRNAs and 28 mRNAs) in the blue module, 25 (all were mRNAs) in the brown module, 101 (including three lncRNAs and 98 mRNAs) in the turquoise module and 20 (all were mRNAs) in the yellow module (Figure 2C). These findings indicate that these 192 DMRs may represent epigenetic biomarkers for PCa recurrence and were used for the following survival analysis.
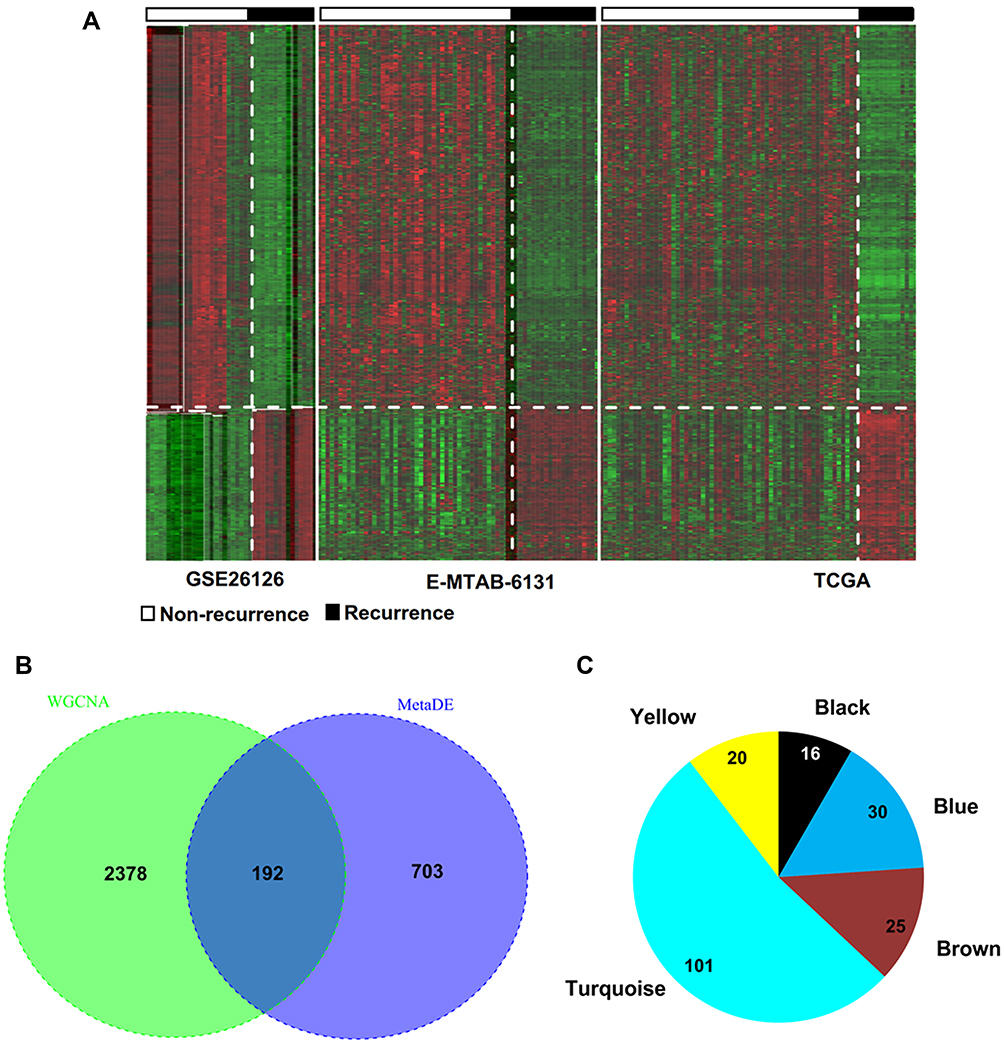 |
Figure 2 Identification of differentially methylated genes. (A) Heat map of differentially methylated RNAs in three datasets; (B) Venn diagram to obtain the overlap between differentially methylated RNAs and module genes; (C) the module distribution of the overlapped genes. |
Identification of an Epigenetic Signature Panel and Development of a Risk Scoring Model for RFS Prediction in PCa Patients
Univariate Cox regression analysis identified the expressions of 42 DMRs (including four DMLs and 38 DMGs) were significantly associated with RFS of PCa patients (log-rank p < 0.05). Multivariable Cox regression model demonstrated that fifteen of them (including four DMLs and 11 DMGs) were independent prognostic factors. LASSO modelling further filtered 14 DMRs as the optimal prognostic panel [DMLs: MEG3 (maternally expressed 3), DSCR9 (Down syndrome critical region 9), HCP5; DMGs: MMP7 (matrix metallopeptidase 7), SLCO3A1 (solute carrier organic anion transporter family member 3A1), KCNF1 (potassium voltage-gated channel modifier subfamily F member 1), RFXAP (regulatory factor X associated protein), NTRK3 (neurotrophic receptor tyrosine kinase 3), NAV1 (neuron navigator 1), HOXA13 (homeobox A13), HAS2 (hyaluronan synthase 2), CBX2 (chromobox 2), HIST1H2AJ (H2A clustered histone 14), SNX4 (sorting nexin 4)] (Table 2). Six prognostic genes (MEG3, MMP7, SLCO3A1, KCNF1, RFXAP, and NTRK3) had positive LASSO coefficient and HR > 1, suggesting patients with the high methylation levels of these genes may have poor RFS, while the other eight genes (DSCR9, HCP5, NAV1, HOXA13, HAS2, CBX2, HIST1H2AJ, and SNX4) had negative LASSO coefficient and HR < 1, implying the high methylation levels may play a protective role against recurrence and caused death (Table 2).
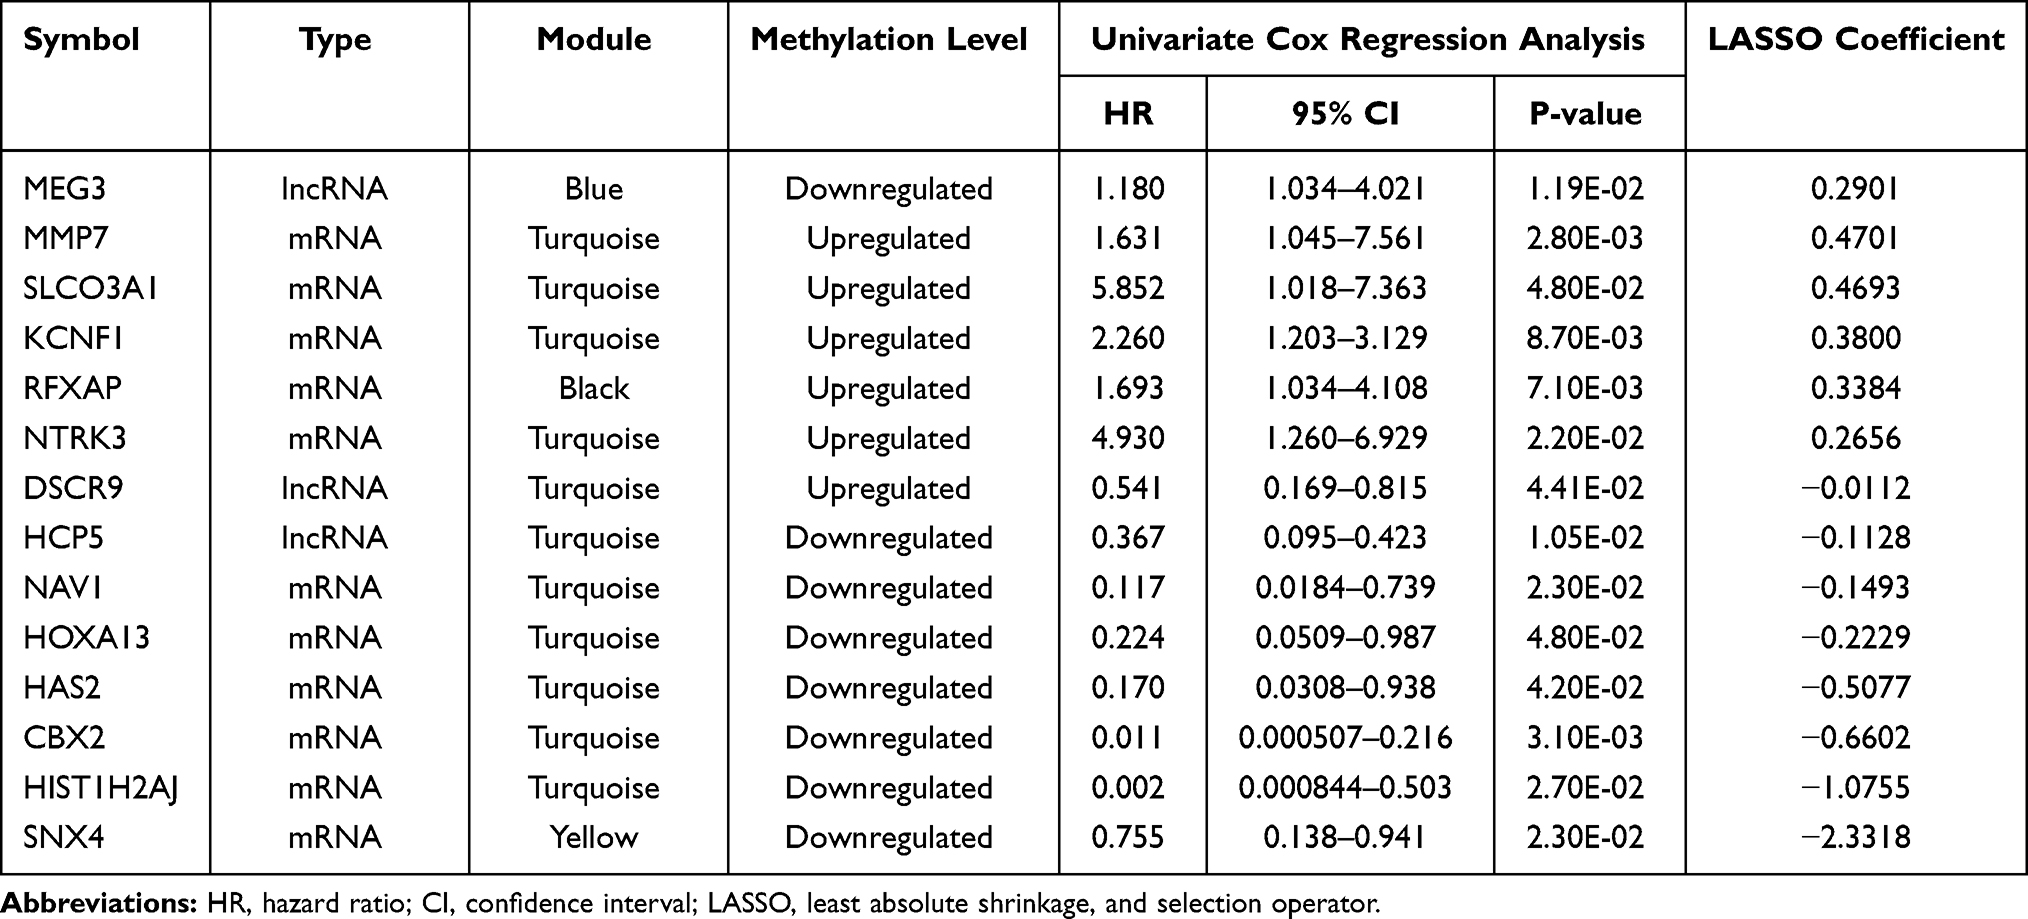 |
Table 2 The Optimal Methylation Signature Panel for Prognosis Prediction |
A risk scoring model was established based on the methylation levels of the above 14 genes and their corresponding LASSO coefficients (Table 2). Using the median risk score in each dataset as the cut-off, patients were assigned to the low-risk group and the high-risk group. Obviously, more patients in the high-risk group developed recurrence (44/187 vs 3/188, p < 0.001). Kaplan–Meier curves showed that the high-risk group had a significantly shorter RFS rate compared with the low-risk group (TCGA: HR = 18.72, 95% CI = 5.800–60.43, p = 3.521e-13, Figure 3A; E-MTAB-6131: HR = 3.455, 95% CI = 1.089–10.90, p = 2.417e-02, Figure 3B). ROC curve analysis showed that AUC of the training cohort was 0.987, 0.947, and 0.969 in predicting 1-, 3- and 5-year RFS, respectively (Figure 3C); while it was 0.851, 0.789, and 0.811 for the testing dataset in predicting 1-, 3- and 5-year RFS, respectively (Figure 3D). These findings indicate that our epigenetic signature panel had high accuracy in predicting RFS for patients with PCa.
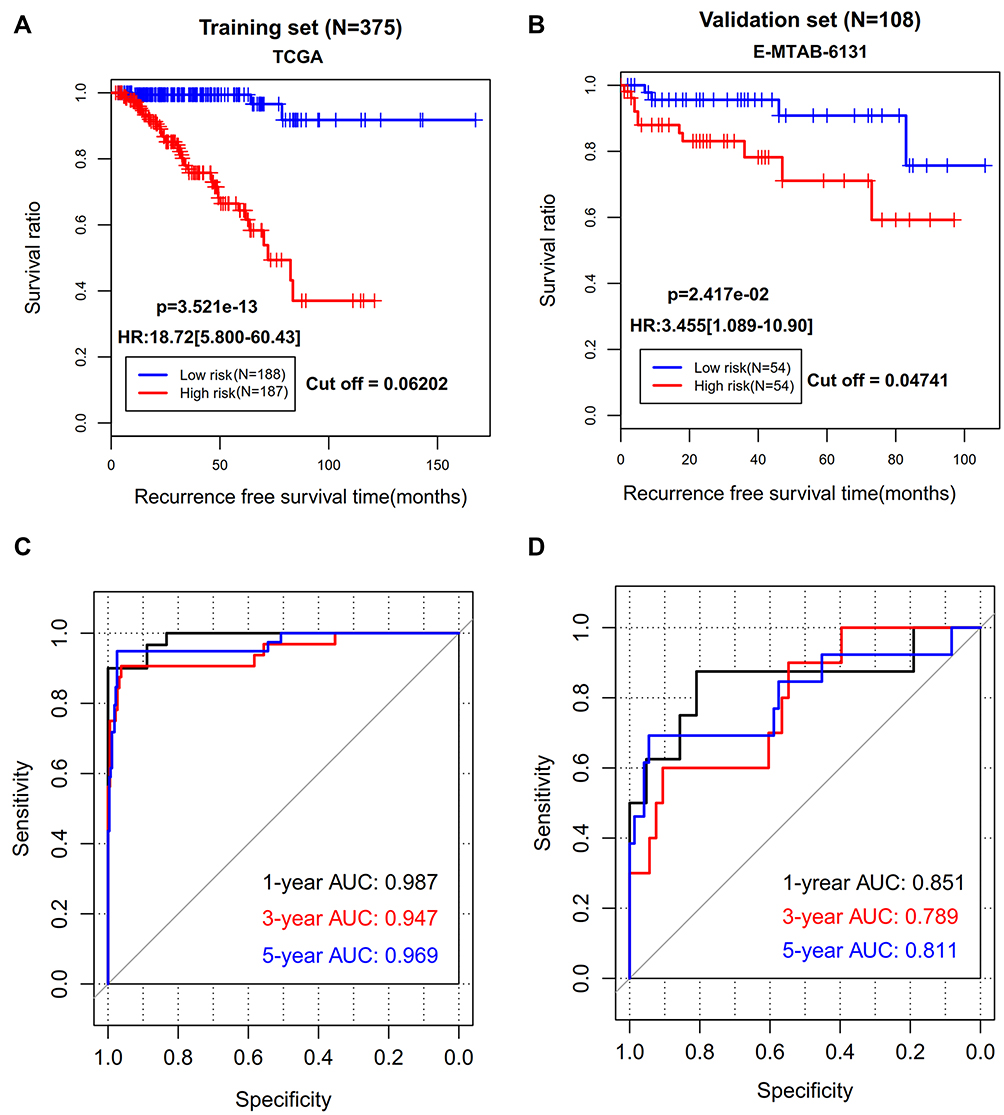 |
Figure 3 The prediction performance of our 14-DMRs-based risk score system for recurrence-free survival. (A) Kaplan-Meier survival curve analysis of the TCGA dataset; (B) Kaplan-Meier survival curve analysis of the EMBL-EBI dataset; (C) receiver operator characteristic (ROC) curve analysis of the TCGA dataset; (D) receiver operator characteristic curve analysis of the EMBL-EBI dataset. Abbreviations: HR, hazard ratio; AUC, area under the ROC curve. |
To explore whether our epigenetic signature panel was independent of clinical pathological characteristics for RFS prediction, univariate and multivariate Cox regression analyses were performed. As a result, Pathologic_T, Radiation therapy, Targeted molecular therapy, Gleason score (Figure 4A), PSA, and the risk score status exhibited significant associations with RFS in univariate Cox regression analysis, but only Gleason score and the risk score status remained significant in multivariate Cox regression analysis (Table 3), revealing these two variables were independent prognostic factors. To investigate whether the risk score was superior to Gleason score for RFS prediction, stratification, time-dependent ROC curve, and C-index analyses were then conducted. Stratification analysis showed that patients with the same Gleason score [(6–7) (Figure 4B) or (8–10) (Figure 4C)] could be further divided into the high-risk group and the low-risk group according to their risk score. Similarly, AUC (0.959 vs 0.689) and C-index (0.885 vs 0.723) of Gleason score were lower than those of the risk score (Figure 4D). These findings implied an improved prognostic power of our epigenetic signature panel. Thereby, our signature panel can be integrated with the Gleason score model to obtain better prognostic effects in clinic. This theory is verified in Figure 4D, in which AUC and C-index for the combined model were higher than those of Gleason score (AUC = 0.984 vs 0.689; C-index = 0.898 vs 0.723) and risk score (AUC = 0.984 vs 0.959; C-index = 0.898 vs 0.885) alone, respectively.
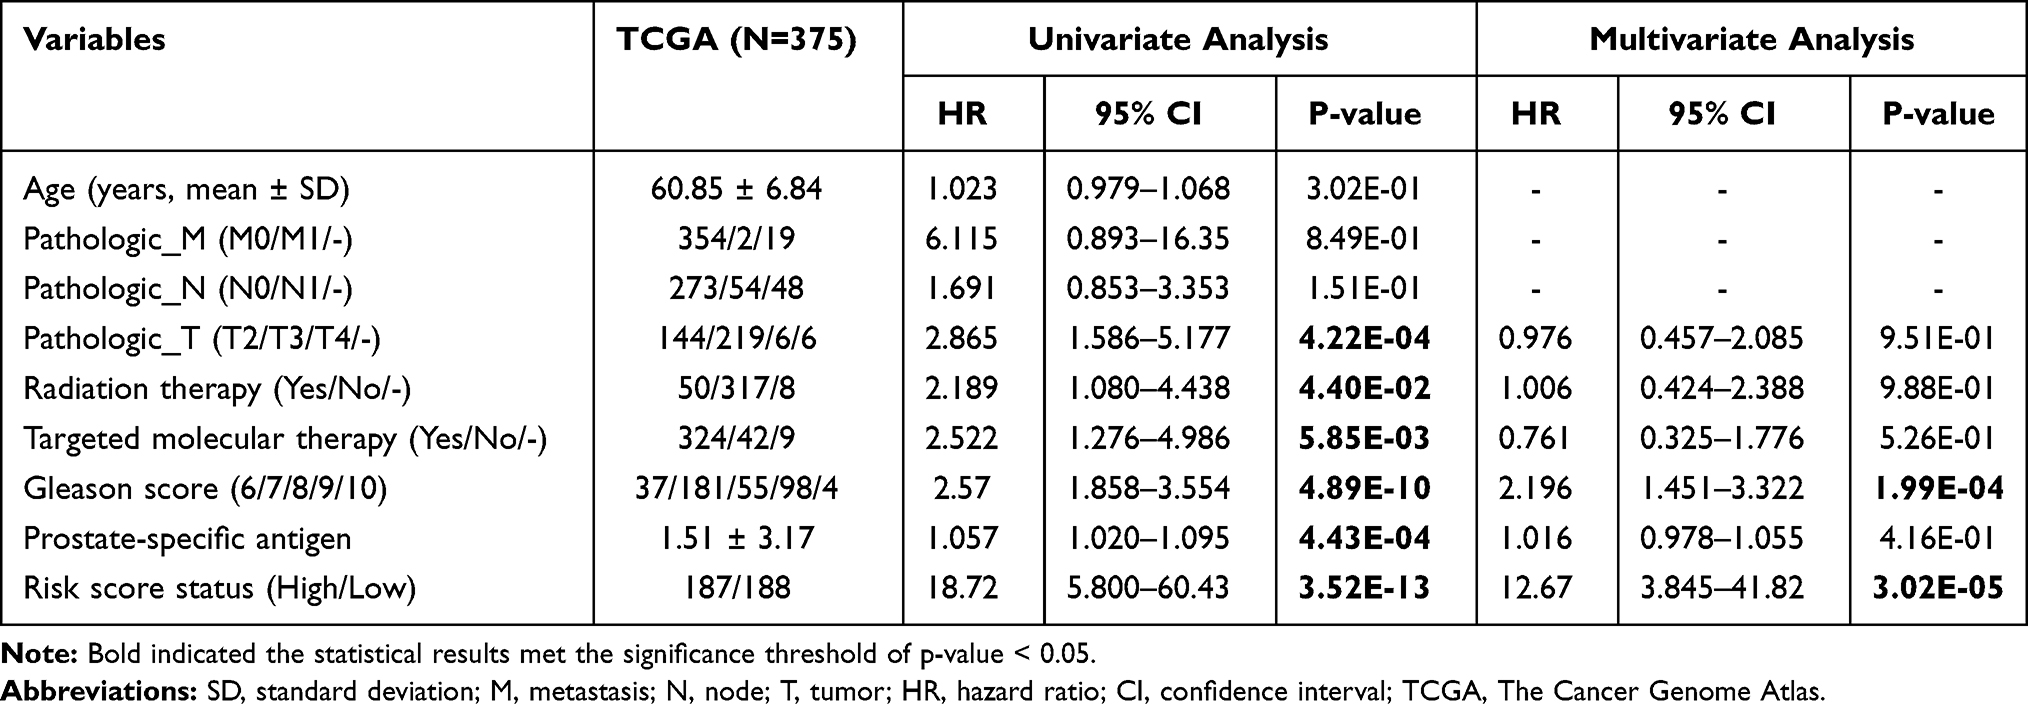 |
Table 3 Univariate and Multivariate Cox Regression of Clinical Features and Risk Score |
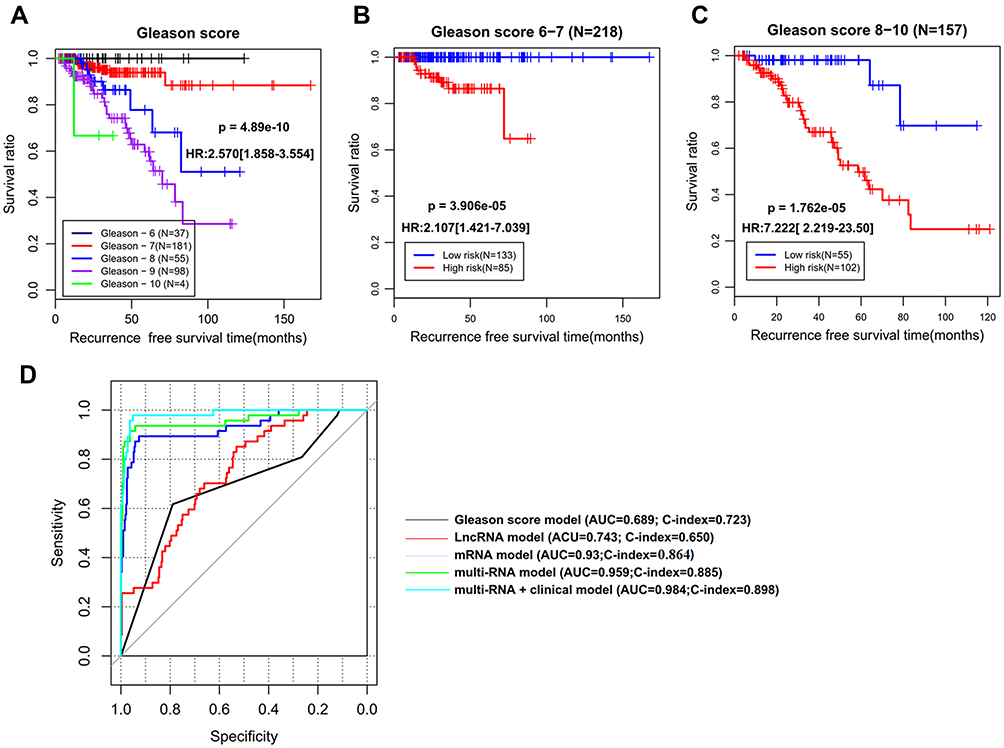 |
Figure 4 The superiority of our 14-DMRs-based risk score system to clinical indicators. (A) Kaplan-Meier survival curve analysis to show the association of Gleason score with recurrence-free survival; (B) stratification analysis for Gleason score (6–7) using the risk score; (C) stratification analysis for Gleason score (8–10) using the risk score; (D) time-dependent ROC curve analysis constructed according to various models. Abbreviations: HR, hazard ratio; AUC, area under the receiver operator characteristic curve; C-index, concordance index. |
Function Analysis of Prognostic Genes
To obtain the possible functions of prognostic genes, 888 DMGs were used as the input to search the gProfiler and DAVID databases. The results showed the prognostic genes were mainly involved in GO:0042127~regulation of cell population proliferation (NTRK3), GO:0006915~apoptotic process (NTRK3), GO:0022407~ regulation of cell–cell adhesion (HAS2) (Table S1), GO:0045893~positive regulation of transcription, DNA-templated (RFXAP), GO:0030335~positive regulation of cell migration (NTRK3, HAS2), GO:0043065~positive regulation of apoptotic process (NTRK3), GO:0000122~negative regulation of transcription from RNA polymerase II promoter (CBX2), and hsa04310:Wnt signaling pathway (MMP7) (Table S2). All these biological processes were carcinogenesis-related, further confirming their importance for PCa.
A total of 148 co-expression pairs were obtained between prognostic lncRNAs and module mRNAs according to their mRNA expression (Figure 5), from which MEG3 was shown to co-express with RFXAP (cor = 0.78); DSCR9 could co-express with CBX2 (cor = 0.61). Thus, the functions of lncRNAs MEG3 and DSCR9 may be associated with the functions of RFXAP and CBX2, respectively. Furthermore, the co-expression methylation relationships were calculated for genes in each module, from which HCP5 were found to interact with HIST1H2AJ (cor = 0.31); while HIST1H2AJ may interact with CBX2 (cor = 0.03). Thus, the functions of HCP5 and HIST1H2AJ may also be similar to CBX2.
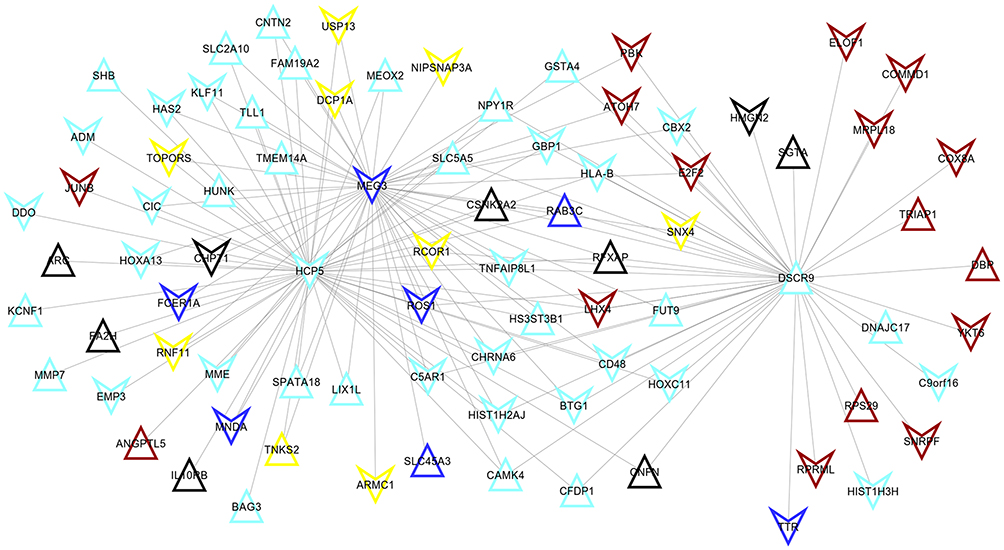 |
Figure 5 The co-expression network between differentially methylated lncRNAs and mRNAs identified unstable modules. The color indicated the corresponding module. |
Validation of the RNA Expression Levels of Prognostic Genes
A total of 115 DERs were identified between recurrence and non-recurrence PCa samples. Among them, prognostic MEG3, NTRK3, NAV1, CBX2, and SNX4 were found to be DERs and their RNA expression levels were opposite to their methylation levels (Table 4). Furthermore, 169 DERs were obtained between PCa and normal controls, among which SLCO3A1, KCNF1, RFXAP, NTRK3 (downregulated), CBX2, HIST1H2AJ, and SNX4 (upregulated) were opposite to their methylation levels (Table 4). These findings revealed that mRNA expressions of these genes may be driven by their methylation levels.
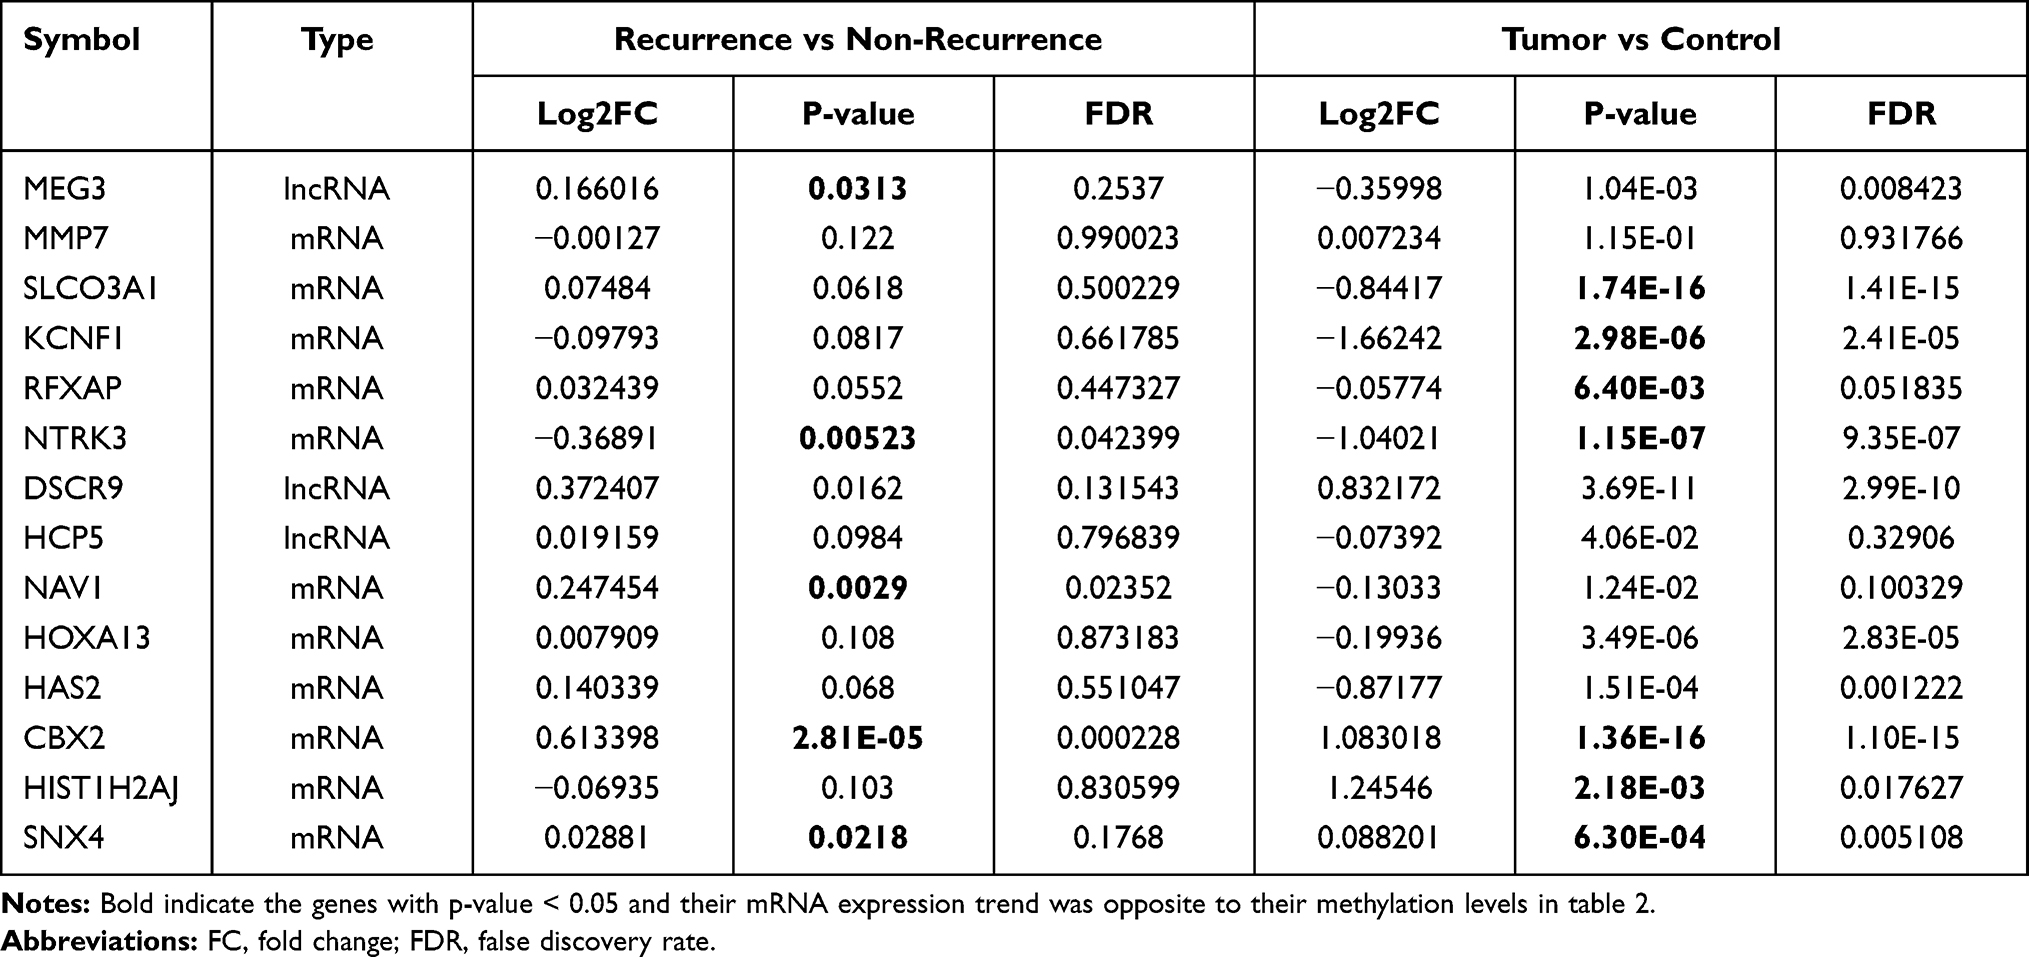 |
Table 4 The RNA Expression Levels of Prognostic Genes |
Discussion
In the present study, we first mined PCa recurrence-related co-methylation modules using the WGCNA method and then used the intersection between module genes and recurrent-associated DMRs to construct the prognostic signature. Thus, the performance of our signature panel for RFS prediction may be better than that of the 52-gene methylation signature reported by Geybels et al21 which only used DMRs between patients with high (8–10) and low (≤6) Gleason scores. In line with this hypothesis, we developed a signature panel of 11 methylated mRNAs (MMP7, SLCO3A1, KCNF1, RFXAP, NTRK3, NAV1, HOXA13, HAS2, CBX2, HIST1H2AJ, SNX4) and 3 methylated lncRNAs (MEG3, DSCR9, and HCP5). This signature was shown to independently predict the 5-year RFS of PCa patients, with AUC of 0.969 for the training TCGA dataset and AUC of 0.811 for the testing E-MTAB-6131, both of which were higher than the predictive accuracy of the combined model of 52-gene methylation signature and clinical features (AUC = 0.78) in the study of Geybels et al.21 Similar to the reports by Zeng et al,23 our lncRNA-mRNA-based methylation signature was demonstrated to have a higher prognostic power than the lncRNA- (AUC = 0.959 vs 0.743; C-index = 0.885 vs 0.723) and mRNA-based signature (AUC =0.959 vs 0.93; C-index = 0.885 vs 0.864). The superiority of our methylation signature to clinical features for RFS prediction was also evidence: TNM and PSA were even not identified to be associated with RFS in the multivariate analysis; patients with the same Gleason score (especially those with Gleason score lower than 8 who were usually considered to have a favorable prognosis in clinic33) could also be further divided into the high-risk group and the low-risk group. These results suggest that our prognostic model may be a promising biomarker for clinical prediction of RFS in PCa patients.
Of these 14 prognostic mRNAs or lncRNAs, the methylation of 3 RNAs (MEG3, SLCO3A1, and NTRK3) was previously demonstrated to be associated with the prognosis of cancer patients: Zhang et al reported that hypermethylation of MEG3 in plasma was associated with worse RFS and overall survival (OS) in cervical cancer patients.34 Gao et al identified that hypermethylation of MEG3 promoter in retinoblastoma tissues was highly associated with poor survival of retinoblastoma patients.35 Li et al observed that the high methylation rate of MEG3 indicated poor prognosis of breast cancer patients (HR: 2.14).36 DNA hypermethylation in the SLCO3A1 promoter region was detected in a small subset of colorectal cancer patients and in HCT116 and Caco-2 cell lines.37 Higher methylation level of SLCO3A1 (also known as OATP3A1) was associated with shorter post-treatment survival of patients with chronic lymphocytic leukaemia.38 Univariate Cox regression and Kaplan–Meier survival analyses showed that high methylation located in NTRK3 gene was significantly associated with poor prognosis in patients with esophageal squamous cell carcinoma (HR = 1.79).39 In agreement with these studies, we also found that patients with a high methylation level of MEG3 (HR = 1.18), SLCO3A1 (HR = 5.852) and NTRK3 (HR = 4.930) were at a higher risk of having unfavorable RFS.
Usually, high CpG island methylation is associated with silencing of tumor suppressor genes, while low methylation results in elevated expression of proto-oncogenes, which ultimately influence the malignant characteristics of tumor cells. This theory has also been validated for some prognostic genes in our risk scoring model: hypermethylation of MEG3 promoter was highly associated with low MEG3 expression in retinoblastoma tissues.35 The use of DNA methyltransferase inhibitor 5-aza-2-deoxycytidine (5-Aza-dC) significantly increased the expression level of MEG3 in retinoblastoma35 and esophageal cancer.40 Hypermethylated MEG3 significantly reduced cancer cell proliferation,35,41 invasiveness,40 and promoted apoptosis35 by depressing MEG3 expression and then activating the activity of the Wnt/β-catenin pathway. The force of 5-Aza-dC36 or pcDNA3.1-MEG336,42 slowed down cell viability and migration of breast cancer or PCa cells in vitro. The transcript of SLCO3A1 was also observed to be increased following treatment with 5-Aza-dC.38 NTRK3 methylation silenced NTRK3 expression which induced neoplastic transformation in vitro and tumor growth in vivo; reconstitution of NTRK3 induced apoptosis in colorectal cancers.43 DNA methylation profiling analysis and validation experiments showed that NAV1 was significantly hypomethylated in breast cancers;44 while overexpression of members of the neuron navigator gene family was reported to promote invasion and predict poor prognosis.45,46 The breast tumours that overexpressed CBX2 had a clear reduction in DNA methylation.47 Elevated CBX2 expression was correlated with poor clinical outcome in breast cancer47 and PCa cohorts.48 Depletion of CBX2 abrogated cell viability and induced caspase 3-mediated apoptosis in metastatic PCa cell lines.48 In line with these studies, we found a negative association between the methylation level and expression level of MEG3, NTRK3, NAV1, and CBX2 in PCa samples. High methylation of NAV1 and CBX2 was also identified to exert a protective role against recurrence in favor of RFS in PCa patients.
Although the expression of some genes was not directly implied to be methylation-related previously, their roles in cancer progression may indirectly explain the resultant functions of methylation: Bayesian network analysis of GEO microarray datasets found low expressed KCNF1 was a predictor of the risk for site-specific metastasis of breast cancer.49 RFXAP expression was relatively lower in pancreatic adenocarcinoma tissues and pancreatic cancer-cell lines than that in normal pancreatic tissues or normal pancreatic ductal epithelial cell line. Its low expression level was positively correlated with high tumor stage and poor survival.50 RFXAP silencing was also proved to enhance cell viability of pancreatic adenocarcinoma cells.50 Histone family gene HIST1H2AJ was upregulated in gynecological tumors.51 Similar to these studies, we also identified that KCNF1 and RFXAP were downregulated, while HIST1H2AJ was upregulated in PCa samples compared with controls.
Our dry data analysis revealed that the mRNA expressions of HCP5, HOXA13 and HAS2 were not significant in PCa samples. However, some wet experiments obtained significant results. Hu et al found that HCP5 was highly expressed in PCa tissues.52 High expression of HCP5 was positively correlated with the metastasis status of PCa patients.52 Knockdown of HCP5 inhibited the proliferation, colony formation and induced apoptosis of PCa cells.52 Dong et al reported that HOXA13 expression was sharply increased in carcinoma tissues and independently associated with poor prognosis of PCa patients. Forced expression of HOXA13 promoted the proliferation, migration, and invasion, whereas inhibited the apoptosis of PCa cells.53 HAS2 is a gene encoding the hyaluronan synthase, which is a structural component of extracellular matrices and thus plays important roles in cell proliferation and motility. Inhibition of HAS2 by antisense54 or 4-Methylumbelliferone55 reduced the growth rate and suppressed invasion and chemotactic motility of PCa cells. The high mRNA expression level was opposite to the low methylation level identified in our study, indirectly indicating that these genes may also be methylation-driven in PCa.
Of the three prognostic lncRNAs, only the functional mechanisms of HCP5 and MEG3 were previously explored in PCa. Proto-oncogenic HCP5 was shown to act as a competing endogenous RNA (ceRNA) to sponge microRNA (miR)‑4656 and then led to the upregulation of miR‑4656 target gene cell migration inducing hyaluronidase 1 (CEMIP),52 MEG3 functioned as a ceRNA to modulate miR-9-5p/Quaking protein 5 (QKI-5) axis56 or directly bound to EZH2.42 However, their functions remain unclear. In this study, we predicted HCP5 and MEG3 may, respectively, be co-expressed with HIST1H2AJ and RFXAP, which may represent novel mechanisms to explain the roles of HCP5 and MEG3 in PCa recurrence. Except the study by Yegnasubramanian et al that showed DSCR9 was hypermethylated in PCa compared to control cells,57 no scholars attempted to explore its function mechanism. In this study, we newly predicted that there was an interaction between DSCR9 and CBX2.
Some limitations should be acknowledged in this study. First, this is a study to develop and validate the predictive power of our methylation signature panel for RFS prediction using three independent retrospective data downloaded from publicly available dataset. There was unavoidable bias in these three datasets (such as patient selection), which led to slight differences in the predictive results (ie AUCs in the training cohort were higher than those in the testing dataset; the separation between the high-risk and low-risk categories is better in the training set than in the testing set). In the future, several cohorts of patients in our hospital should be prospectively collected to reconfirm the methylation level of signature genes and their prediction ability for RFS (especially for patients with a subdivided Gleason score of 3+4, 4+3, 4+5, 5+4; or specific postoperative treatments; these were not available in the retrospective TCGA data). Second, the associations between methylation and mRNA expression of all our prognostic genes were only estimated by their expression trend and previous studies in other cancers. Methylation inhibitor 5-aza-dC should be used to treat PCa cells to directly verify whether the expression of these signature genes was methylation-mediated and their roles in the progression of PCa. Third, the co-expression relationship between HCP5/MEG3/DSCR9 and their co-expressed mRNAs should be investigated by immunoprecipitation or biotin-labeled RNA pull-down assays.
Conclusion
In summary, we identified and developed a novel 14-DMRs-based risk score system for predicting RFS in PCa patients. This risk scoring model could independently and accurately classify patients into high-risk and low-risk groups and its prognostic power was higher than the clinical Gleason score. Thus, the signature panel may potentially serve as a promising biomarker for guiding individualized treatment of PCa patients. Although methylation of some genes was predicted to involve PCa recurrence by changing their mRNA expression levels, further in vitro and in vivo studies are needed to confirm our hypothesis.
Data Sharing Statement
All data were downloaded from TCGA (https://portal.gdc.cancer.gov/), GEO (GSE26126; http://www. ncbi.nlm.nih.gov/geo/) and EMBL-EBI (E-MTAB-6131; https://www.ebi.ac.uk).
Ethics Approval and Consent to Participate
No experiments on humans and animals were used in this study. Therefore, no ethical approval is waived.
Funding
This work was supported by Science and Technology Innovating and Popularizing Project of Guangdong (No.2019A141405007), Medical Science and Technology Research Fund Project of Guangdong (No. A201926, A2019560, and C2019108).
Disclosure
The authors declare that they have no conflicts of interest in this work.
References
1. Siegel RL, Miller KD, Fuchs HE, Jemal A. Cancer statistics, 2021. CA Cancer J Clin. 2021;71(1):7–33. doi:10.3322/caac.21654
2. Cao L, Yang Z, Qi L, Chen M. Robot-assisted and laparoscopic vs open radical prostatectomy in clinically localized prostate cancer: perioperative, functional, and oncological outcomes: a Systematic review and meta-analysis. Medicine. 2019;98(22):e15770. doi:10.1097/MD.0000000000015770
3. Hackman G, Taari K, Tammela TL, et al. Randomised trial of adjuvant radiotherapy following radical prostatectomy versus radical prostatectomy alone in prostate cancer patients with positive margins or extracapsular extension. Eur Urol. 2019;76(5):586–595. doi:10.1016/j.eururo.2019.07.001
4. Barbas Bernardos G, Herranz Amo F, González San Segundo C, et al. Survival analysis of patients with prostate cancer and unfavorable risk factors treated with radical prostatectomy and salvage radiotherapy after biochemical recurrence and persistence. Actas Urol Esp. 2020;44(10):701–707. doi:10.1016/j.acuro.2020.02.001
5. Zattoni F, Morlacco A, Matrone F, et al. Multimodal treatment for high-risk locally-advanced prostate cancer following radical prostatectomy and extended lymphadenectomy. Minerva Urol Nefrol. 2019;71(5):508–515. doi:10.23736/S0393-2249.19.03388-5
6. Hashimoto T, Ohori M, Shimodaira K, et al. Prostate-specific antigen screening impacts on biochemical recurrence in patients with clinically localized prostate cancer. Int J Urol. 2018;25(6):561–567. doi:10.1111/iju.13563
7. Abdel Raheem A, Chang KD, Alenzi MJ, et al. Predictors of biochemical recurrence after Retzius-sparing robot-assisted radical prostatectomy: analysis of 359 cases with a median follow-up period of 26 months. Int J Urol. 2018;25(12):1006–1014. doi:10.1111/iju.13808
8. Tollefson MK, Karnes RJ, Rangel LJ, Bergstralh EJ, Boorjian SA. The impact of clinical stage on prostate cancer survival following radical prostatectomy. J Urol. 2013;189(5):1707–1712. doi:10.1016/j.juro.2012.11.065
9. Mithal P, Howard LE, Aronson WJ, et al. Prostate-specific antigen level, stage or Gleason score: which is best for predicting outcomes after radical prostatectomy, and does it vary by the outcome being measured? Results from shared equal access regional cancer Hospital database. Int J Urol. 2015;22(4):362–366. doi:10.1111/iju.12704
10. Gandaglia G, Briganti A, Clarke N, et al. Adjuvant and salvage radiotherapy after radical prostatectomy in prostate cancer patients. Eur Urol. 2017;72(5):689–709. doi:10.1016/j.eururo.2017.01.039
11. Sugiura M, Sato H, Kanesaka M, et al. Epigenetic modifications in prostate cancer. Int J Urol. 2020;28(2):140–149. doi:10.1111/iju.14406
12. Liao Y, Xu K. Epigenetic regulation of prostate cancer: the theories and the clinical implications. Asian J Androl. 2019;21(3):279–290. doi:10.4103/aja.aja_53_18
13. Nowacka-Zawisza M, Wiśnik E. DNA methylation and histone modifications as epigenetic regulation in prostate cancer (Review). Oncol Rep. 2017;38(5):2587–2596. doi:10.3892/or.2017.5972
14. Wang L, Xie PG, Lin YL, Ma JG, Li WP. Aberrant methylation of PCDH10 predicts worse biochemical recurrence-free survival in patients with prostate cancer after radical prostatectomy. Med Sci Monit. 2014;20:1363–1368. doi:10.12659/MSM.891241
15. Lin YL, Xie PG, Wang L, Ma JG. Aberrant methylation of protocadherin 17 and its clinical significance in patients with prostate cancer after radical prostatectomy. Med Sci Monit. 2014;20:1376–1382. doi:10.12659/MSM.891247
16. Jiang Q, Xie M, He M, et al. PITX2 methylation: a novel and effective biomarker for monitoring biochemical recurrence risk of prostate cancer. Medicine. 2019;98(1):e13820. doi:10.1097/MD.0000000000013820
17. Xu J, Tsai CW, Chang WS, et al. Methylation of global DNA repeat LINE-1 and subtelomeric DNA repeats D4Z4 in leukocytes is associated with biochemical recurrence in African American prostate cancer patients. Carcinogenesis. 2019;40(9):1055–1060. doi:10.1093/carcin/bgz061
18. Stott-Miller M, Zhao S, Wright JL, et al. Validation study of genes with hypermethylated promoter regions associated with prostate cancer recurrence. Cancer Epidemiol Biomarkers Prev. 2014;23(7):1331–1339. doi:10.1158/1055-9965.EPI-13-1000
19. Goltz D, Gevensleben H, Dietrich J, et al. Promoter methylation of the immune checkpoint receptor PD-1 (PDCD1) is an independent prognostic biomarker for biochemical recurrence-free survival in prostate cancer patients following radical prostatectomy. Oncoimmunology. 2016;5(10):e1221555. doi:10.1080/2162402X.2016.1221555
20. Li X, Zhang W, Song J, Zhang X, Ran L, He Y. SLCO4C1 promoter methylation is a potential biomarker for prognosis associated with biochemical recurrence-free survival after radical prostatectomy. Clin Epigenetics. 2019;11(1):99. doi:10.1186/s13148-019-0693-2
21. Geybels MS, Wright JL, Bibikova M, et al. Epigenetic signature of Gleason score and prostate cancer recurrence after radical prostatectomy. Clin Epigenetics. 2016;8(1):97. doi:10.1186/s13148-016-0260-z
22. Liao LE, Hu DD, Zheng Y. A four-methylated lncRNAs-based prognostic signature for hepatocellular carcinoma. Genes (Basel). 2020;11(8):908. doi:10.3390/genes11080908
23. Zeng Z, Cheng J, Ye Q, et al. A 14-methylation-driven differentially expressed rna as a signature for overall survival prediction in patients with uterine corpus endometrial carcinoma. DNA Cell Biol. 2020;39(6):975–991. doi:10.1089/dna.2019.5313
24. Kobayashi Y, Absher DM, Gulzar ZG, et al. DNA methylation profiling reveals novel biomarkers and important roles for DNA methyltransferases in prostate cancer. Genome Res. 2011;21(7):1017–1027. doi:10.1101/gr.119487.110
25. Povey S, Lovering R, Bruford E, Wright M, Lush M, Wain H. The HUGO Gene Nomenclature Committee (HGNC). Hum Genet. 2001;109(6):678–680. doi:10.1007/s00439-001-0615-0
26. Langfelder P, Horvath S. WGCNA: an R package for weighted correlation network analysis. BMC Bioinform. 2008;9(1):559. doi:10.1186/1471-2105-9-559
27. Langfelder P, Zhang B, Horvath S. Defining clusters from a hierarchical cluster tree: the Dynamic Tree Cut package for R. Bioinformatics. 2008;24(5):719–720. doi:10.1093/bioinformatics/btm563
28. Langfelder P, Luo R, Oldham MC, Horvath S, Bourne PE. Is my network module preserved and reproducible? PLoS Comput Biol. 2011;7(1):e1001057. doi:10.1371/journal.pcbi.1001057
29. Ritchie ME, Phipson B, Wu D, et al. limma powers differential expression analyses for RNA-sequencing and microarray studies. Nucleic Acids Res. 2015;43(7):e47. doi:10.1093/nar/gkv007
30. Goeman JJ. L1 penalized estimation in the Cox proportional hazards model. Biom J. 2010;52(1):70–84. doi:10.1002/bimj.200900028
31. Tibshirani R. The lasso method for variable selection in the Cox model. Stat Med. 1997;16(4):385–395. doi:10.1002/(SICI)1097-0258(19970228)16:4<385::AID-SIM380>3.0.CO;2-3
32. Raudvere U, Kolberg L, Kuzmin I, et al. g:Profiler: a web server for functional enrichment analysis and conversions of gene lists (2019 update). Nucleic Acids Res. 2019;47(W1):W191–w198. doi:10.1093/nar/gkz369
33. Sinnott JA, Peisch SF, Tyekucheva S, et al. Prognostic utility of a new mRNA expression signature of Gleason score. Clin Cancer Res. 2017;23(1):81–87. doi:10.1158/1078-0432.CCR-16-1245
34. Zhang J, Yao T, Lin Z, Gao Y. Aberrant methylation of MEG3 functions as a potential plasma-based biomarker for cervical cancer. Sci Rep. 2017;7(1):6271. doi:10.1038/s41598-017-06502-7
35. Gao Y, Huang P, Zhang J. Hypermethylation of MEG3 promoter correlates with inactivation of MEG3 and poor prognosis in patients with retinoblastoma. J Transl Med. 2017;15(1):268. doi:10.1186/s12967-017-1372-8
36. Li H, Wang P, Liu J, et al. Hypermethylation of lncRNA MEG3 impairs chemosensitivity of breast cancer cells. J Clin Lab Anal. 2020;34(9):e23369. doi:10.1002/jcla.23369
37. Rawłuszko-Wieczorek AA, Horst N, Horbacka K, et al. Effect of DNA methylation profile on OATP3A1 and OATP4A1 transcript levels in colorectal cancer. Biomed Pharmacother. 2015;74:233–242. doi:10.1016/j.biopha.2015.08.026
38. Barrow TM, Nakjang S, Lafta F, et al. Epigenome-wide analysis reveals functional modulators of drug sensitivity and post-treatment survival in chronic lymphocytic leukaemia. Br J Cancer. 2021;124(2):474–483. doi:10.1038/s41416-020-01117-8
39. Kuo IY, Chang JM, Jiang SS, et al. Prognostic CpG methylation biomarkers identified by methylation array in esophageal squamous cell carcinoma patients. Int J Med Sci. 2014;11(8):779–787. doi:10.7150/ijms.7405
40. Dong Z, Zhang A, Liu S, et al. Aberrant Methylation-Mediated Silencing of lncRNA MEG3 functions as a ceRNA in esophageal cancer. Mol Cancer Res. 2017;15(7):800–810. doi:10.1158/1541-7786.MCR-16-0385
41. Zhang J, Lin Z, Gao Y, Yao T. Downregulation of long noncoding RNA MEG3 is associated with poor prognosis and promoter hypermethylation in cervical cancer. J Exp Clin Cancer Res. 2017;36(1):5. doi:10.1186/s13046-016-0472-2
42. Zhou Y, Yang H, Xia W, et al. LncRNA MEG3 inhibits the progression of prostate cancer by facilitating H3K27 trimethylation of EN2 through binding to EZH2. J Biochem. 2020;167(3):295–301. doi:10.1093/jb/mvz097
43. Luo Y, Kaz AM, Kanngurn S, et al. NTRK3 is a potential tumor suppressor gene commonly inactivated by epigenetic mechanisms in colorectal cancer. PLoS Genet. 2013;9(7):e1003552. doi:10.1371/journal.pgen.1003552
44. Li L, Lee KM, Han W, et al. Estrogen and progesterone receptor status affect genome-wide DNA methylation profile in breast cancer. Hum Mol Genet. 2010;19(21):4273–4277. doi:10.1093/hmg/ddq351
45. Tan F, Zhu H, Tao Y, et al. Neuron navigator 2 overexpression indicates poor prognosis of colorectal cancer and promotes invasion through the SSH1L/cofilin-1 pathway. J Exp Clin Cancer Res. 2015;34(1):117. doi:10.1186/s13046-015-0237-3
46. Jiang H, Gu J, Du J, Qi X, Qian C, Fei B. A 21‑gene support vector machine classifier and a 10‑gene risk score system constructed for patients with gastric cancer. Mol Med Rep. 2020;21(1):347–359. doi:10.3892/mmr.2019.10841
47. Piqué DG, Montagna C, Greally JM, Mar JC. A novel approach to modelling transcriptional heterogeneity identifies the oncogene candidate CBX2 in invasive breast carcinoma. Br J Cancer. 2019;120(7):746–753. doi:10.1038/s41416-019-0387-8
48. Clermont PL, Crea F, Chiang YT, et al. Identification of the epigenetic reader CBX2 as a potential drug target in advanced prostate cancer. Clin Epigenetics. 2016;8(1):16. doi:10.1186/s13148-016-0182-9
49. Park SB, Hwang KT, Chung CK, Roy D, Yoo C. Causal Bayesian gene networks associated with bone, brain and lung metastasis of breast cancer. Clin Exp Metastasis. 2020;37(6):657–674. doi:10.1007/s10585-020-10060-0
50. Ding G, Xu X, Li D, et al. Fisetin inhibits proliferation of pancreatic adenocarcinoma by inducing DNA damage via RFXAP/KDM4A-dependent histone H3K36 demethylation. Cell Death Dis. 2020;11(10):893. doi:10.1038/s41419-020-03019-2
51. Xie W, Zhang J, Zhong P, et al. Expression and potential prognostic value of histone family gene signature in breast cancer. Exp Ther Med. 2019;18(6):4893–4903. doi:10.3892/etm.2019.8131
52. Hu R, Lu Z. Long non‑coding RNA HCP5 promotes prostate cancer cell proliferation by acting as the sponge of miR‑4656 to modulate CEMIP expression. Oncol Rep. 2020;43(1):328–336. doi:10.3892/or.2019.7404
53. Dong Y, Cai Y, Liu B, et al. HOXA13 is associated with unfavorable survival and acts as a novel oncogene in prostate carcinoma. Future Oncol. 2017;13(17):1505–1516. doi:10.2217/fon-2016-0522
54. Simpson MA, Wilson CM, McCarthy JB. Inhibition of prostate tumor cell hyaluronan synthesis impairs subcutaneous growth and vascularization in immunocompromised mice. Am J Pathol. 2002;161(3):849–857. doi:10.1016/S0002-9440(10)64245-9
55. Lokeshwar VB, Lopez LE, Munoz D, et al. Antitumor activity of hyaluronic acid synthesis inhibitor 4-methylumbelliferone in prostate cancer cells. Cancer Res. 2010;70(7):2613–2623. doi:10.1158/0008-5472.CAN-09-3185
56. Wu M, Huang Y, Chen T, et al. LncRNA MEG3 inhibits the progression of prostate cancer by modulating miR-9-5p/QKI-5 axis. J Cell Mol Med. 2019;23(1):29–38. doi:10.1111/jcmm.13658
57. Yegnasubramanian S, Wu Z, Haffner MC, et al. Chromosome-wide mapping of DNA methylation patterns in normal and malignant prostate cells reveals pervasive methylation of gene-associated and conserved intergenic sequences. BMC Genomics. 2011;12(1):313. doi:10.1186/1471-2164-12-313
 © 2021 The Author(s). This work is published and licensed by Dove Medical Press Limited. The full terms of this license are available at https://www.dovepress.com/terms.php and incorporate the Creative Commons Attribution - Non Commercial (unported, v3.0) License.
By accessing the work you hereby accept the Terms. Non-commercial uses of the work are permitted without any further permission from Dove Medical Press Limited, provided the work is properly attributed. For permission for commercial use of this work, please see paragraphs 4.2 and 5 of our Terms.
© 2021 The Author(s). This work is published and licensed by Dove Medical Press Limited. The full terms of this license are available at https://www.dovepress.com/terms.php and incorporate the Creative Commons Attribution - Non Commercial (unported, v3.0) License.
By accessing the work you hereby accept the Terms. Non-commercial uses of the work are permitted without any further permission from Dove Medical Press Limited, provided the work is properly attributed. For permission for commercial use of this work, please see paragraphs 4.2 and 5 of our Terms.