Back to Archived Journals » Open Access Journal of Sports Medicine » Volume 16
Short Report: Estimating Blood Lactate Dynamics from Sweat Lactate and Sweat Rate After High-Intensity Exercise – A Pilot Regression-Based Study
Received 13 April 2025
Accepted for publication 25 July 2025
Published 30 July 2025 Volume 2025:16 Pages 99—105
DOI https://doi.org/10.2147/OAJSM.S534243
Checked for plagiarism Yes
Review by Single anonymous peer review
Peer reviewer comments 2
Editor who approved publication: Prof. Dr. Andreas Imhoff
Masaaki Hattori,1 Kazuya Yashiro2
1Department of Community Development, Tokai University, Sapporo, Hokkaido, Japan; 2Faculty of Information Technology, Kanagawa Institute of Technology, Atsugi, Kanagawa, Japan
Correspondence: Masaaki Hattori, Department of Community Development, Tokai University, 5-1-1, Minamisawa, Minami-ku, Sapporo, 005-8601, Japan, Tel +81 11 571 1111 (ext 2423), Fax +81 11 571 7879, Email [email protected]
Background: Blood lactate (BL) is a critical biomarker for assessing anaerobic metabolism and fatigue. Sweat lactate (SWL) and sweat rate (SWR) have been explored as non-invasive alternatives, but their capacity to estimate BL dynamics after short-term high-intensity exercise remains unclear.
Purpose: This pilot study aimed to evaluate whether BL dynamics can be predicted using a regression model based on the time-series patterns of SWL and SWR measured by wearable sensors.
Methods: Five healthy male athletes (three sprinters and two endurance runners) performed a 30-second Wingate anaerobic test. SWL and SWR were continuously monitored using a wearable electrochemical sensor and a ventilated capsule-type sweat rate meter. Capillary BL was sampled for 30 minutes post-exercise.
Results: BL showed a delayed peak at 6.4 ± 1.2 min, while SWL and SWR exhibited biphasic responses. The second SWL peak (7.5 ± 2.2 min) aligned with the BL peak. Although peak-based correlations were not significant, Pearson correlations using time-series data revealed strong associations (r = 0.501– 0.933 for SWL; r = 0.515– 0.805 for SWR; all p < 0.001). A multivariate regression model using both variables predicted BL with high accuracy (R² = 0.763, RMSE = 1.612, MAE = 0.995, p < 0.001).
Conclusion: These findings support the feasibility of a regression-based approach using sweat-derived time-series data to non-invasively estimate BL dynamics after high-intensity exercise.
Keywords: sweat lactate, sweat rate, blood lactate, wearable sensor, high-intensity exercise, non-invasive
Introduction
Blood lactate (BL) is a well-established indicator of anaerobic metabolism, fatigue, and training adaptation, particularly during and after high-intensity exercise.1,2 However, conventional methods for BL measurement are invasive and intermittent, limiting their practicality in field-based settings.3 In response, wearable biosensors that continuously monitor sweat lactate (SWL) and sweat rate (SWR) have emerged as a promising non-invasive alternative.4–6
Recent advances in electrochemical sensors have improved real-time tracking of sweat analytes, enabling applications in both athletic and clinical settings.6 Yang et al5 noted growing reliability in wearable SWL sensors for assessing physiological thresholds such as lactate threshold (LT) and maximal lactate steady state (MLSS).
Although several studies show moderate to strong SWL–BL correlations under controlled conditions,6,7 inconsistencies remain, especially during short, high-intensity exercise. These may arise from local lactate production in eccrine glands8–10 and dilution effects.11 Notably, eccrine glands can generate lactate via glycolysis, indicating partial independence from plasma lactate.9 Gordon et al8 also suggested a systemic link, showing sweat lactate originates from blood glucose via eccrine gland metabolism.
Combining multiple sweat biomarkers may improve BL estimation over SWL alone.5,6 For instance, Rabost-Garcia et al12 demonstrated improved prediction accuracy of blood lactate by integrating sweat lactate, sweat rate, and heart rate in a multiparametric model. However, whether SWL and SWR alone ― without auxiliary biometric data ― are sufficient to estimate BL dynamics after high-intensity exercise remains unclear.
Recent reviews suggest that, despite variability, sweat lactate monitoring shows strong potential as a non-invasive alternative to blood lactate - particularly when combined with contextual factors like sweat rate - and early validation studies with small, well-trained cohorts have provided supportive evidence for our exploratory approach.13
Therefore, the purpose of this pilot study was to evaluate whether the temporal patterns of SWL and SWR, measured using wearable sensors, can jointly predict BL responses following a 30-second Wingate anaerobic test. We propose a regression-based model using time-series data of SWL and SWR to assess its predictive potential. This approach may offer a simplified and scalable method for non-invasive metabolic monitoring using minimal sensor input.
Methods
Participants
Five healthy male university students (age: 21.0 ± 1.7 years, height: 173.9 ± 8.5 cm, body weight: 63.1 ± 8.0 kg, BMI: 20.8 ± 0.7 kg/m², body fat percentage: 11.8 ± 2.3%) voluntarily participated in this study. The participants included three sprinters and two endurance-trained runners, all with competitive athletic training experience. The study was conducted in accordance with the Declaration of Helsinki and was approved by the Ethics Committee of Tokai University (Approval No. 22121). All participants provided written informed consent.
Experimental Protocol
The test was conducted under controlled laboratory conditions (temperature: 22–24 °C; humidity: 40–55%) using a calibrated cycle ergometer. Participants first performed a 10-minute standardized warm-up, then completed the Wingate Anaerobic Test (WAnT)14 at a load of 7.5% of body mass on the same ergometer. Participants were instructed to refrain from strenuous exercise, caffeine, and alcohol for 24 hours before testing. They were also required to fast for at least 3 hours before the test, with only water permitted during this period.
SWL and SWR Measurement
SWL was continuously measured during exercise and recovery using a wearable electrochemical sensor (GSM-00013, Grace Imaging, Japan).15 The SWL sensor was attached 2 cm medial to the upper edge of the right scapula. The device detects lactate via a current response (0–5 mmol/L, 2.4 µA/mM sensitivity),15 with data recorded at 1 Hz via a Bluetooth app (SweatWatch, Grace Imaging). SWR was simultaneously monitored using a ventilated capsule-type perspiration meter (SKN-1000, Skinos, Japan) placed adjacent to the lactate sensor and calibrated before each session.
BL Sampling
Capillary BL samples were collected from the fingertip at baseline and at 0.5, 2, 5, 10, 15, 20, 25, and 30 minutes following exercise using Lactate Pro2 (Arkray, Japan). Blood lactate concentration was modeled using a two-term exponential equation1,2 to characterize its dynamic response over time.
Statistical Analysis
Time-to-peak values for BL, SWL, and SWR were analyzed. Pearson correlation coefficients were calculated to assess the relationship between BL and the time-series data of SWL and SWR. A multiple linear regression model was used to predict BL from these variables. Repeated-measures ANOVA with Bonferroni correction compared peak timings. All analyses were conducted using Python (v3.10), with significance set at p < 0.05.
Results
Figure 1 illustrates the measured blood lactate concentration after WAnT, alongside the estimated curve generated using a binomial exponential function model, and the average changes in perspiration and sweat lactate levels before, during, and after WAnT over time. BL exhibited a single delayed peak at 6.4 ± 1.2 min (Figure 1). SWL and SWR demonstrated biphasic patterns, with initial peaks at ~2 min and delayed second peaks at 7.5 ± 2.2 min (SWL) and 9.8 ± 1.3 min (SWR), respectively. The second SWL peak closely aligned with the BL peak.
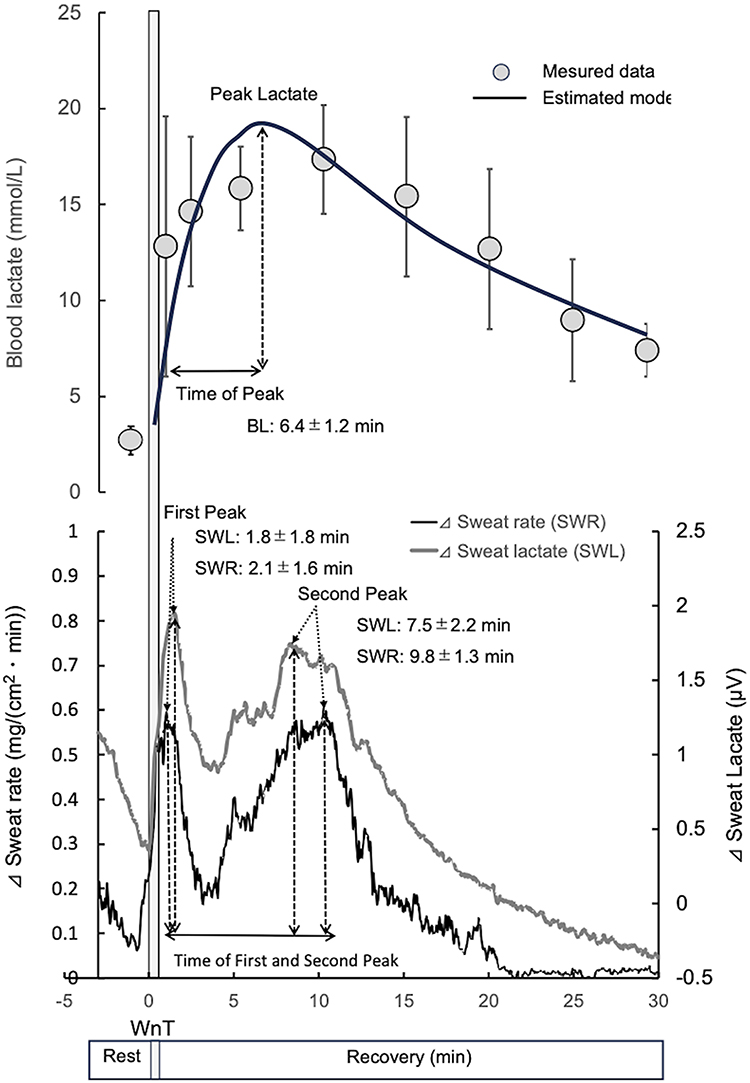 |
Figure 1 Time course of blood lactate concentration, sweat lactate, and sweat rate during and after WAnT. |
Peak-based correlations among BL, SWL, and SWR were not statistically significant, likely due to the small sample size. In contrast, Pearson correlation analyses using continuous time-series data revealed strong correlations between BL and SWL (r = 0.501 to 0.933, p < 0.001) and between BL and SWR (r = 0.515 to 0.805, p < 0.001). Building on these findings, regression analysis using the same continuous data demonstrated that SWL and SWR jointly predicted BL with high accuracy (R² = 0.763, RMSE = 1.612, MAE = 0.995, p < 0.001) (Figure 2). The resulting regression model was expressed as:

 |
Figure 2 Time course of blood lactate (BL) with two-term exponential fitting and predicted concentrations following high-intensity exercise. |
with both predictors reaching statistical significance (p < 0.001).
Discussion
This study demonstrates that the combined use of sweat lactate (SWL) and sweat rate (SWR) time-series data can effectively predict blood lactate (BL) dynamics after short-term high-intensity exercise. The biphasic profiles observed in both SWL and SWR suggest the presence of two physiologically distinct phases: an initial rapid sweat response likely associated with neural and local metabolic activation of eccrine glands, and a delayed response that more closely reflects systemic metabolic processes, including lactate transport from the blood.4,16,17
Our findings showed that the second SWL peak (SWL2) occurred around 7.5 ± 2.2 minutes post-exercise, closely aligning with the BL peak at 6.4 ± 1.2 minutes. This temporal proximity supports the hypothesis that the delayed SWL response is influenced by systemic lactate dynamics, potentially via lactate transporter activity within sweat glands. Although the expression of monocarboxylate transporters (MCTs) in eccrine glands has not been directly demonstrated, Nielsen et al18 reviewed solute carrier (SLC) and ATP-binding cassette (ABC) transporters in the skin and suggested possible roles in metabolite transport, including lactate. This supports the hypothesis that lactate transport into sweat may involve MCTs or other related proteins in cutaneous structures. Supporting this, Sato9 showed that eccrine glands are equipped with metabolic machinery capable of both producing and responding to lactate, thus acting as both local metabolic effectors and systemic reflectors. Likewise, Gordon et al8 indicated that eccrine gland lactate may derive from blood glucose, reinforcing the systemic linkage.
In terms of predictive accuracy, our multivariate linear regression model, using continuous SWL and SWR data, achieved strong performance (R² = 0.763). Notably, SWL was a positive predictor and SWR a negative predictor of BL, which aligns with the notion that higher sweat production dilutes lactate concentration in the sweat matrix. Research indicates that lactate produced by sweat gland metabolism may confound the relationship between sweat and blood lactate.11 These findings are consistent with the work of Rabost-Garcia et al12 who demonstrated that combining sweat biomarkers improved estimation accuracy of BL beyond what SWL alone could achieve. However, unlike their model, which incorporated heart rate, our model relies solely on two sweat-derived variables, enhancing the practical applicability in minimal-sensor systems.
Although peak-based comparisons did not reach statistical significance, likely due to the small sample size, the trends observed―particularly the alignment between SWL2 and the BL peak―suggest meaningful physiological associations. These findings align with prior studies reporting early SWL elevations preceding or paralleling BL increases, albeit often influenced by local metabolic activity and non-thermal inputs such as central command and muscle afferents.10,19,20
To complement these observations, we also performed Pearson correlation analyses between BL and both SWL and SWR using continuous time-series data. The results revealed moderate to strong positive correlations in all subjects (r = 0.625–0.884 for SWL, r = 0.699–0.876 for SWR; all p < 0.001), supporting the physiological relevance of both biomarkers. These significant correlations further justify the inclusion of both variables in the predictive regression model and reinforce the notion that sweat-derived measures can reflect systemic lactate dynamics.
Importantly, this study reinforces the view that using SWL alone is insufficient for reliable estimation of systemic lactate levels due to inter-individual variability, sweat dilution effects, and local lactate production. Incorporating SWR helps to account for these confounders. This was evident in our data: despite non-significant correlations between individual peak magnitudes, regression modeling of continuous data yielded highly accurate predictions, suggesting that dynamic fluctuations ― rather than static peaks ― are more informative for estimating systemic responses.
Technological advances have also played a crucial role. Wearable biosensors equipped with diffusion-limiting membranes or pH/temperature correction algorithms, such as those reported by Xuan et al21 and reviewed by Yang et al22 have significantly improved signal fidelity in on-body applications. In our study, the wearable SWL sensor and ventilated capsule-type SWR meter allowed for robust temporal alignment and continuous data collection, enabling construction of a physiologically interpretable regression model.
We acknowledge that key statistical assumptions for multiple linear regression—such as basic diagnostic checks—were not formally tested due to the exploratory nature and small sample size of this pilot study. While this limits the robustness of the model, the high predictive performance (R² = 0.763, RMSE = 1.612, MAE = 0.995, p < 0.001) suggests potential utility. Nevertheless, the limited sample size also reduces statistical power and restricts the generalizability of the findings. Future studies with larger cohorts are needed to validate model assumptions and improve reliability. Additionally, inter-individual differences in sweat gland density, skin hydration, and sensor placement may introduce variability in measurements. As noted by Derbyshire et al,7 subject-specific calibration or normalization strategies may be necessary. Prior research also indicates that sweat lactate does not consistently correlate with blood lactate under conditions of high sweat rate, highlighting the complexity of non-invasive monitoring.11,22
Temporal shifts in sweat lactate dynamics under fatigue induced by constant workload exercise have also been reported, with peak responses occurring earlier following fatigue.20 While these findings do not indicate a biphasic pattern per se, they do support the idea that the timing of sweat lactate responses can vary across exercise modalities. This interpretation is further reinforced by earlier physiological studies that demonstrated the rapid onset of sweating with muscular work17 and by foundational analyses of sweat composition.23 Additionally, thermoregulatory influences on sweat production and composition, as described in previous studies, should be taken into account when interpreting sweat-derived biomarkers.15
Conclusion
This pilot study demonstrated that blood lactate dynamics after short-term high-intensity exercise can be estimated with reasonable accuracy using time-series data of sweat lactate and sweat rate. Although the sample size was small, the proposed regression model showed strong predictive performance. These findings support the potential of wearable biosensors for non-invasive metabolic monitoring and highlight the need for validation in larger cohorts.
Abbreviations
BL, Blood Lactate; SWL, Sweat Lactate; SWR, Sweat Rate; WAnT, Wingate Anaerobic Test; ANOVA, Analysis of Variance.
Author Contributions
All authors made a significant contribution to the work reported, whether that is in the conception, study design, execution, acquisition of data, analysis and interpretation, or in all these areas; took part in drafting, revising or critically reviewing the article; gave final approval of the version to be published; have agreed on the journal to which the article has been submitted; and agree to be accountable for all aspects of the work.
Disclosure
The author(s) report no conflicts of interest in this work.
References
1. Engel F, Sperlich B, Stockinger C, Härtel S, Bös K, Holmberg HC. The kinetics of blood lactate in boys during and following single and repeated all-out sprints of cycling are different than in men. Appl Physiol Nutr Metab. 2015;40(6):1–9. doi:10.1139/apnm-2014-0370
2. Freund H, Gendry P. Lactate kinetics after short strenuous exercise in man. Eur J Appl Physiol Occup Physiol. 1978;39(2):123–135. doi:10.1007/BF00421717
3. Fukuba Y, Walsh ML, Morton RH, et al. Effect of endurance training on blood lactate clearance after maximal exercise. J Sports Sci. 1999;17(3):239–248. doi:10.1080/026404199366145
4. Aastrand I. Lactate Content in Sweat. Acta Physiol Scand. 1963;58(4):359–367. doi:10.1111/j.1748-1716.1963.tb02658.x
5. Yang G, Hong J, Park SB. Wearable device for continuous sweat lactate monitoring in sports: a narrative review. Front Physiol. 2024;15:1376801. doi:10.3389/fphys.2024.1376801
6. Yamazaki F, Sone R, Ikegami H. Responses of sweating and body temperature to sinusoidal exercise. J Appl Physiol. 1994;76(6):2541–2545. doi:10.1152/jappl.1994.76.6.2541
7. Derbyshire PJ, Barr H, Davis F, Higson SP. Lactate in human sweat: a critical review of research to the present day. J Physiol Sci. 2012;62(6):429–440. doi:10.1007/s12576-012-0213-z
8. Gordon RS, Thompson RH, Muenzer J, Thrasher D. Sweat lactate in man is derived from blood glucose. J Appl Physiol. 1971;31(5):713–716. doi:10.1152/jappl.1971.31.5.713
9. Sato K. The physiology, pharmacology, and biochemistry of the eccrine sweat gland. Rev Physiol Biochem Pharmacol. 1977;79:51–131. doi:10.1007/BFb0037089
10. Takei N, Inaba T, Morita Y, et al. Differential patterns of sweat and blood lactate concentration response during incremental exercise in varied ambient temperatures: a pilot study. Temperature. 2024;11(3):247–253. doi:10.1080/23328940.2024.2375693
11. Klous L, De Ruiter CJ, Scherrer S, Gerrett N, Daanen HAM. The (in)dependency of blood and sweat sodium, chloride, potassium, ammonia, lactate and glucose concentrations during submaximal exercise. Eur J Appl Physiol. 2021;121(3):803–816. doi:10.1007/s00421-020-04562-8
12. Rabost-Garcia G, Colmena V, Aguilar-Torán J, et al. Non-invasive multiparametric approach to determine sweat−blood lactate bioequivalence. ACS Sens. 2023;8(5):1536–1541. doi:10.1021/acssensors.2c02614
13. Messina L, Giardi MT. Recent status on lactate monitoring in sweat using biosensors: can this approach be an alternative to blood detection. Biosensors. 2025;15(1):3. doi:10.3390/bios15010003
14. Zupan MF, Arata AW, Dawson LH, et al. Wingate anaerobic test peak power and anaerobic capacity classifications for men and women intercollegiate athletes. J Strength Cond Res. 2009;23(9):2598–2604. doi:10.1519/JSC.0b013e3181b1b21b
15. Okawara H, Sawada T, Nakashima D, et al. Kinetic changes in sweat lactate following fatigue during constant workload exercise. Physiol Rep. 2022;10(2):e15169. doi:10.14814/phy2.15169
16. Gisolfi C, Robinson S. Central and peripheral stimuli regulating sweating during intermittent work in men. J Appl Physiol. 1970;29(6):761–768. doi:10.1152/jappl.1970.29.6.761
17. van Beaumont W, Bullard RW. Sweating: its rapid response to muscular work. Science. 1963;141(3581):643–646. doi:10.1126/science.141.3581.643
18. Nielsen MMK, Aryal E, Safari E, et al. Current state of SLC and ABC transporters in the skin and their relation to sweat metabolites and skin diseases. Proteomes. 2021;9(2):23. doi:10.3390/proteomes9020023
19. Kondo N, Tominaga H, Shiojiri T, et al. Sweating responses to passive and active limb movements. J Therm Biol. 1997;22(4–5):351–356. doi:10.1016/S0306-4565(97)00034-X
20. Shibasaki M, Kondo N, Crandall CG. Non-thermoregulatory modulation of sweating in humans. Exerc Sport Sci Rev. 2003;31(1):34–39. doi:10.1097/00003677-200301000-00007
21. Xuan X, Pérez-Ràfols C, Chen C, Cuartero M, Crespo GA. Lactate biosensing for reliable on-body sweat analysis. ACS Sens. 2021;6(7):2763–2771. doi:10.1021/acssensors.1c01009
22. Karpova EV, Laptev AI, Andreev EA, Karyakina EE, Karyakin AA. Relationship between sweat and blood lactate level during exhaustive physical exercise. ChemElectroChem. 2020;7(1):191–194. doi:10.1002/celc.20191703
23. Whitehouse AGR. The dissolved constituents of human sweat. Proc R Soc B. 1935;117:139–154.
 © 2025 The Author(s). This work is published and licensed by Dove Medical Press Limited. The
full terms of this license are available at https://www.dovepress.com/terms
and incorporate the Creative Commons Attribution
- Non Commercial (unported, 4.0) License.
By accessing the work you hereby accept the Terms. Non-commercial uses of the work are permitted
without any further permission from Dove Medical Press Limited, provided the work is properly
attributed. For permission for commercial use of this work, please see paragraphs 4.2 and 5 of our Terms.
© 2025 The Author(s). This work is published and licensed by Dove Medical Press Limited. The
full terms of this license are available at https://www.dovepress.com/terms
and incorporate the Creative Commons Attribution
- Non Commercial (unported, 4.0) License.
By accessing the work you hereby accept the Terms. Non-commercial uses of the work are permitted
without any further permission from Dove Medical Press Limited, provided the work is properly
attributed. For permission for commercial use of this work, please see paragraphs 4.2 and 5 of our Terms.