Back to Journals » International Journal of General Medicine » Volume 18
Shear Wave Elastography to Quantitatively Assess the Early Changes of Skin Elasticity in Patients with Chronic Venous Disease of the Lower Extremity
Authors Lv D, Yang X, Mao X, Zhang M, Ma X, Liu Y, Li G ![]() , Yang B
, Yang B
Received 2 September 2025
Accepted for publication 1 October 2025
Published 9 October 2025 Volume 2025:18 Pages 6095—6105
DOI https://doi.org/10.2147/IJGM.S564514
Checked for plagiarism Yes
Review by Single anonymous peer review
Peer reviewer comments 3
Editor who approved publication: Dr Redoy Ranjan
Dan Lv,1,* Xi Yang,1,* Xin Mao,1,* Mei Zhang,1,* Xuemeihui Ma,1 Yuanyuan Liu,1 Guangsen Li,1 Bingbing Yang2
1Department of Ultrasound, The Second Affiliated Hospital of Dalian Medical University, Dalian, Liaoning, 116027, People’s Republic of China; 2Department of Cardiovascular Ultrasound, The Second Affiliated Hospital of Dalian Medical University, Dalian, Liaoning, 116027, People’s Republic of China
*These authors contributed equally to this work
Correspondence: Bingbing Yang, Email [email protected] Guangsen Li, Email [email protected]
Objective: To explore the value of shear wave elastography (SWE) in quantitatively evaluating skin elasticity during early changes in patients with chronic venous disease (CVD) of the lower extremity.
Methods: This retrospective study analyzed 112 patients with CVD of the lower extremity, who were enrolled and divided into four groups according to the Clinical-Etiology-Anatomy-Pathophysiology (CEAP) classification criteria, including group C2 (n=33), group C3 (n=35), group C4a (n=24), and group C4b (n=20). Additionally, 30 healthy individuals were recruited as the control group. Differences in baseline clinical characteristics, laboratory parameters, conventional ultrasound parameters and SWE parameters among the five groups were compared. Correlations between SWE parameters of the dermal and subcutaneous tissue layers and laboratory parameters were analyzed.
Results: Compared with the control and C2 groups, the C3, C4a, and C4b groups exhibited significantly higher levels of C-reactive protein (CRP), matrix metalloproteinase-2 (MMP-2), interleukin-6 (IL-6), tumor necrosis factor-α (TNF-α), subcutaneous tissue thickness (SCTT), maximum Young’s modulus of subcutaneous tissue (SCT-Emax), mean Young’s modulus of subcutaneous tissue (SCT-Emean), and minimum Young’s modulus of subcutaneous tissue (SCT-Emin) (all P< 0.05). Furthermore, these indices progressively increased from group C3, group C4a to group C4b (all P< 0.05). Compared to the control, C2, and C3 groups, both the C4a and C4b groups demonstrated greater dermal thickness (DT), maximum Young’s modulus of dermal layer (D-Emax), mean Young’s modulus of dermal layer (D-Emean), and minimum Young’s modulus of dermal layer (D-Emin) (all P< 0.05), with group C4b showing higher values than group C4a (all P< 0.05). Correlation analysis revealed that SWE parameters of the dermal and subcutaneous tissue layers were significantly correlated with MMP-2 and IL-6, respectively.
Conclusion: SWE enables quantitative assessment of skin elasticity during the early changes in patients with CVD of the lower extremity.
Keywords: shear wave elastography, skin elasticity, chronic venous disease
Introduction
Skin changes in chronic venous disease (CVD) of the lower extremity represent a chronic inflammatory dermatological condition involving the epidermis, dermis, and subcutaneous tissues. Early detection and treatment are crucial for controlling disease progression.1 Early diagnosis is critical to prevent progression to severe ulcerative phases, which can severely affect patients’ physical and psychological health and quality of life.2 The Venous Clinical Severity Score is the primary clinical assessment tool.3 Still, it is subjective, and there is a lack of imaging methods for the quantitative evaluation of skin lesions in patients with CVD. Shear wave elastography (SWE) quantitatively measures tissue stiffness by assessing shear wave propagation speed and calculating the Young’s modulus of the tissue. The greater the Young’s modulus value, the higher the stiffness of the tissue and the lower the elasticity.4 Previous study demonstrated the favorable diagnostic performance of SWE in evaluating lower limb lymphedema.5 This non-invasive technique offers a promising alternative for diagnosing and monitoring skin lesions.6 This study aims to analyze the value of SWE in quantitatively assessing early changes in the dermal and subcutaneous tissue layers of CVD patients and to explore the correlation between SWE parameters and laboratory parameters, to provide an imaging method for the quantitative assessment of skin changes in patients with CVD.
Materials and Methods
Study Population
This retrospective study enrolled 112 patients with CVD of the lower extremities who were admitted to the Second Affiliated Hospital of Dalian Medical University between January 2024 and April 2025. According to the “Clinical” component of the 2020 Clinical-Etiology-Anatomy-Pathophysiology (CEAP) classification criteria,7 they were divided into four groups: 33 cases in group C2 (varicose veins group), 35 cases in group C3 (edema group), 24 cases in group C4a (eczema or pigmentation group), and 20 cases in group C4b(lipodermatosclerosis group). Additionally, 30 healthy individuals undergoing physical examinations were selected as the control group. Baseline clinical characteristics of the participants were collected, and fasting venous blood was drawn to measure white blood cell (WBC) counts and serum inflammatory markers, including C-reactive protein (CRP), matrix metalloproteinase-2 (MMP-2), interleukin-6 (IL-6), and tumor necrosis factor-α (TNF-α).
Inclusion criteria: ① All patients met the diagnostic criteria for CVD of the lower extremity.8 ② BMI: 18.5–35.0 kg/m². ③ Had not undergone any venous surgery or interventional treatment for the lower extremities in the past three months. ④ All participants were informed, consented, and willing to cooperate with the study.
Exclusion criteria: ① History of healed ulcers or presence of active ulcers. ② Edema or skin discoloration caused by non-venous diseases of the lower extremity (such as severe cardiac or renal insufficiency, peripheral arterial disease, diabetic neuropathy, lymphedema, pregnancy or lactation, or long-term glucocorticoid use). ③ History or current diagnosis of autoimmune diseases such as rheumatoid arthritis or connective tissue disease, etc. ④ History of trauma or presence of scars around the ankle. ⑤ Cellulitis, etc around the ankle. ⑥ Poor image quality.
This study was approved by the Ethics Committee of the Second Affiliated Hospital of Dalian Medical University (Approval No. KY2025-300-01-01), and written informed consent was obtained from all participants.
Ultrasound Parameters
A Mindray Eagus R9 ultrasound diagnostic system equipped with an L20-5U linear array probe (frequency: 20 MHz) was used. Each subject was requested to lie in a supine position. The measurement underwent at 10 cm above the medial malleolus. An ultrasound solid gel pad (Yue Chan Device Registration No. 20150185) was placed over the target skin. The probe was positioned perpendicular to the body’s long axis on the surface of the gel pad, with its indicator oriented toward the participant’s right side. The operator should not apply pressure and must ensure the probe remains stable without slipping (Figure 1). The musculoskeletal mode was selected, and the depth was adjusted. The skin composes of three distinct layers, including the epidermis, dermis, and subcutaneous tissue. These layers manifest as hyperechoic, moderately hyperechoic, and hypoechoic structures on ultrasonic imaging. Once the target area was clearly visualized, the image was stabilized for 5 seconds, then frozen to measure the dermal thickness (DT) and the subcutaneous tissue thickness (SCTT). The DT is measured from the hyperechoic lower border of the epidermis (ie, the dermo-epidermal junction) to the dermal-subcutaneous junction. The SCTT is defined as the distance from the dermal-subcutaneous junction to the muscular fascia. Measurements were repeated five times to obtain average values.
 |
Figure 1 Examination using an L20-5U linear array probe with the gel pad. |
Then, the SWE mode was activated. The region of interest (ROI) size was adjusted to 20 mm×10 mm. The scale was adjusted to 0–250 kPa. The image was frozen when a high-quality elastogram was obtained, and the M-STB index showed four or five green stars. Two Q-Boxes (1-mm diameter) were placed within dermal and subcutaneous tissue layers, respectively. The Q-Boxes in the dermal layer were placed along a line parallel to the skin surface within the mid-dermis, while those in the subcutaneous tissue layer were positioned along a line parallel to the skin surface and located 1 mm below the dermal–subcutaneous junction. The system automatically calculated the following SWE parameters for the dermal and subcutaneous tissue layers, including maximum Young’s modulus (D-Emax, SCT-Emax), mean Young’s modulus (D-Emean, SCT-Emean), and minimum Young’s modulus (D-Emin, SCT-Emin). Each image contained two Q-Boxes, and five repeated analyses were performed per image. Q-Boxes were obtained from ten different locations along the exact line parallel to the skin surface within the dermal or subcutaneous tissue layers, respectively, then the mean Young’s modulus value was calculated from them.
A reproducibility test was conducted to assess the reliability of the measurements. Thirty participants were randomly selected. Two physicians, each with 15 years of MSK ultrasound experience and more than 6 years of elastography experience, independently measured the SWE parameters of the dermal and subcutaneous tissue layers using the aforementioned measurement protocol via the SWE technique. One week later, one physician repeated the measurements on the same 30 participants. Intraobserver and interobserver correlation coefficients were calculated.
Statistical Analysis
Data processing and statistical analysis were performed using SPSS software (version 27.0). Normality of distribution was assessed using the Shapiro–Wilk test. Continuous variables following a normal distribution were presented as mean ± standard deviation ( ), and the one-way analysis of variance(ANOVA) or the Kruskal–Wallis test (K-W test) was used to assess differences among all groups, while post-hoc multiple test adjusted by the Bonferroni correction or Dunn’s test. All continuous variables of two groups were performed using the independent sample t-tests or the Mann–Whitney U-test. Categorical variables were presented as frequencies and percentages and were compared using the chi-square test among all groups. Correlations between SWE parameters and laboratory parameters were analyzed using Spearman’s rank correlation coefficient. A two-sided P<0.05 was considered statistically significant.
Results
Baseline Clinical Characteristics and Laboratory Parameters
The control group included of 12 males and 18 females, with a mean age of 54.2±11.9 years. Group C2 included 13 males and 20 females (mean age 54.9±11.2 years), Group C3 included 14 males and 21 females (mean age 58.5±10.0 years), Group C4a included 9 males and 15 females (mean age 59.5±12.4 years), and Group C4b included 8 males and 12 females (mean age 57.1±10.5 years). No statistically significant differences were observed in baseline clinical characteristics or WBC counts among the five groups (all P>0.05). Compared with the control and C2 groups, the levels of CRP, MMP-2, IL-6, and TNF-α were significantly increased in the C3, C4a, and C4b groups (all P<0.05), with a sequential increase observed from the C3, C4a to C4b groups (all P<0.05). No significant differences were found in laboratory parameters between the C2 and control groups (all P>0.05) (Table 1).
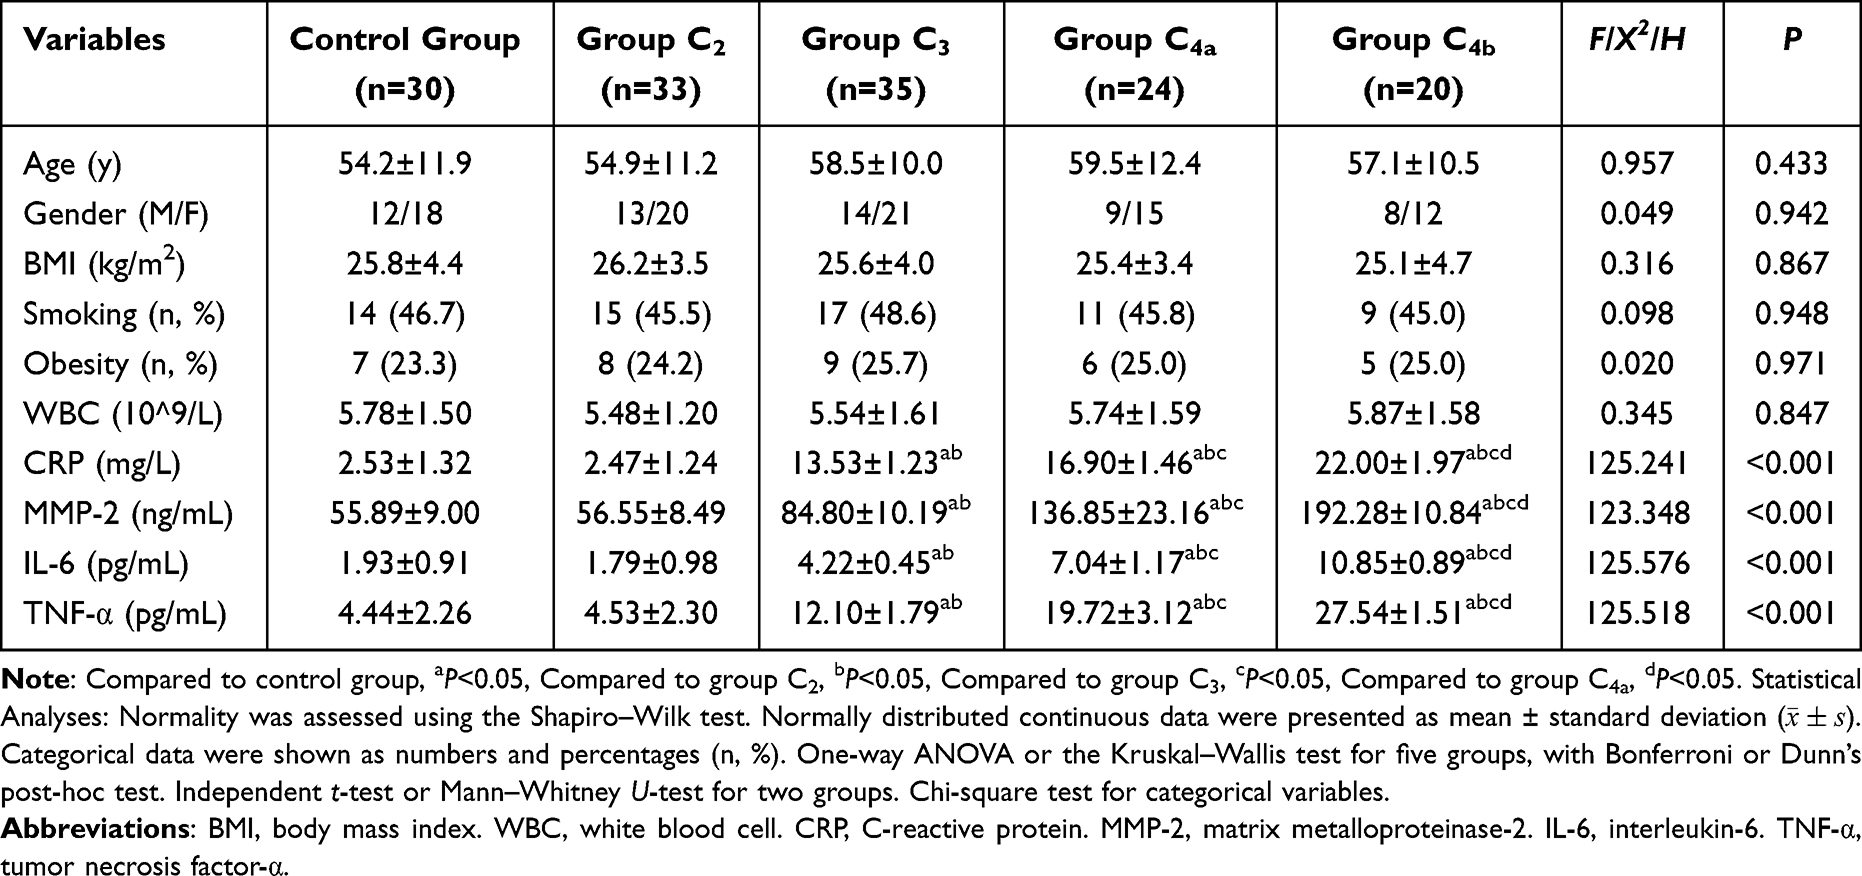 |
Table 1 Baseline Clinical Characteristics and Laboratory Parameters of the Five Groups |
Conventional Ultrasound Parameters, SWE Parameters and Correlation Analysis
Compared with the control, C2, and C3 groups, the DT, D-Emax, D-Emean, and D-Emin were significantly higher in the C4a and C4b groups (all P<0.05), with group C4b showing higher values than group C4a (all P<0.05). Compared with the control and C2 groups, the SCTT, SCT-Emax, SCT-Emean, and SCT-Emin were significantly higher in the C3, C4a, and C4b groups, with a sequential increase from C3, C4a to C4b groups (all P<0.05) (Figures 2, 3, and Table 2). Correlation analysis indicated that D-Emax, D-Emean, and D-Emin were positively correlated with MMP-2 (rs=0.763, 0.766, 0.765, all P<0.001) and IL-6 (rs=0.752, 0.755, 0.754, all P<0.001) across patient groups. Similarly, SCT-Emax, SCT-Emean, and SCT-Emin were positively correlated with MMP-2 (rs=0.819, 0.813, 0.801, all P<0.001) and IL-6 (rs=0.838, 0.833, 0.822, all P<0.001) (Figure 4).
 |
Table 2 Conventional Ultrasound and SWE Parameters of the Dermal and Subcutaneous Tissue Layers of the Five Groups ( |

 |
Figure 2 SWE images of the dermal layers. (A) Control group: D-Emax = 55.61 kPa, D-Emean = 49.81 kPa, D-Emin = 46.19 kPa. (B) Group C3: D-Emax = 60.16 kPa, D-Emean =50.69 kPa, D-Emin = 50.31 kPa. (C) Group C4a: D-Emax = 131.25 kPa, D-Emean = 122.31 kPa, D-Emin =111.94 kPa. (D) Group C4b: D-Emax = 182.76 kPa, D-Emean = 156.99 kPa, D-Emin = 133.70 kPa. Notes: Frequency: 20MHz. Depth: 2cm. Scale: 0–250kPa. Diameter of the Q-box: 1mm. The white colored squared box indicates the region of interest (ROI) with dimensions of 20 mm × 10 mm. |
 |
Figure 3 SWE images of the subcutaneous tissue layers. (A) Control group: SCT-Emax = 48.63kPa, SCT-Emean = 38.28kPa, SCT-Emin = 29.45kPa. (B) Group C3, SCT-Emax = 60.27kPa, SCT-Emean = 46.28kPa, SCT-Emin = 38.57kPa. (C) Group C4a: SCT-Emax = 122.57kPa, SCT-Emean = 93.46kPa, SCT-Emin = 77.45kPa. (D) Group C4b: SCT-Emax = 133.56kPa, SCT-Emean = 116.46kPa, SCT-Emin = 103.28kPa. Notes: Frequency: 20MHz. Depth: 2cm. Scale: 0–250kPa. Diameter of the Q-box: 1mm. The white colored squared box indicates the region of interest (ROI) with dimensions of 20mm × 10mm. |
 |
Figure 4 Scatter plots illustrating the correlation between SWE parameters and levels of MMP-2 and IL-6 in patient groups. (A–C) The correlation of MMP-2 levels with D-Emax, D-Emean, and D-Emin, respectively. (D–F) The correlation of IL-6 levels with D-Emax, D-Emean, and D-Emin, respectively. (G–I) The correlation of MMP-2 levels with SCT-Emax, SCT-Emean, and SCT-Emin, respectively. (J–L) The correlation of IL-6 levels with SCT-Emax, SCT-Emean, and SCT-Emin, respectively. Note: Statistical Analysis: Spearman’s rank correlation coefficient. |
Reproducibility Analysis Results
The intraobserver and interobserver intraclass correlation coefficients (ICCs) for the SWE parameters of the dermal and subcutaneous tissue layers were excellent (ICC>0.90), indicating excellent reproducibility and consistency of the SWE measurements (Table 3).
 |
Table 3 Reliability Analysis of Young’s Modulus in the Dermal and Subcutaneous Tissue Layers |
Discussion
We applied SWE to assess skin elasticity in CVD patients with different severity levels. Our results demonstrated that SWE parameters of the dermal and subcutaneous tissue layers in group C2 showed no significant difference compared to the control group. In contrast, group C3 showed a marked increase in SWE parameters of the subcutaneous tissue layers, while the values in the dermal layers remained unchanged. Furthermore, both the C4a and C4b groups exhibited significantly increased SWE values in both the dermal and subcutaneous tissue layers, with substantially higher values in group C4b compared to group C4a. Furthermore, a positive correlation was observed between SWE parameters and relevant laboratory parameters.
CVD is a commonly encountered pathology of the circulatory system of the legs, which represents both a significant medical problem for patients and a substantial burden for healthcare systems.2 It is characterized by blood stasis and abnormally elevated venous pressure. Persistent venous hypertension can lead to chronic skin inflammatory manifestations. Mild cases present with lower extremity edema, skin hyperpigmentation, or eczema. If left untreated, the lesion may progress to lipodermatosclerosis (LDS) and, even in severe cases, result in venous ulcers that are difficult to treat and heal slowly.2,9 The beginning of the inflammatory response gives rise to a series of clinical symptoms in patients, such as pruritus, pain, and swelling.10,11 A study demonstrated that approximately 82.7% of CVD patients develop cutaneous abnormalities.12 However, quantitative assessment tools for evaluating the severity and early changes in CVD remain scarce in clinical practice. Although skin biopsy can accurately diagnose LDS, it is generally not adopted by clinicians due to the risk of causing additional tissue damage and potentially causing the injured wound to not heal.13 Traditional methods for assessing skin elasticity include indentation and torsion methods. However, both techniques are limited by poor reproducibility, low accuracy, and high operator dependency, which have been restricted their widespread adoption in clinical practice.14,15
SWE generates shear waves by applying acoustic radiation force impulses to tissues, thereby quantitatively assessing tissue stiffness. This quantitative, non-invasive, real-time, and operator-independent technique provides objective and highly reproducible imaging results with minimal reliance on examiners’ or subjects’ variability.16,17 The propagation velocity of shear waves in tissue can be converted into real-time color-coded images reflecting tissue stiffness. In this representation, red areas indicate higher tissue stiffness, whereas blue areas correspond to lower stiffness.18 In recent years, SWE has been increasingly applied to evaluate the dermatological lesions. A study demonstrated its capability to assess cutaneous elasticity in multiple anatomical regions.15 Guiotto M et al19 utilized SWE to evaluate postoperative scar stiffness, facilitating the early diagnosis of pathological scars and potentially avoiding invasive patients interventions. Cai R et al20 employed SWE to assess skin stiffness in patients with systemic sclerosis, revealing that SWE provided more reliable evaluation of disease activity compared to the modified Rodnan skin score and could detect early changes in cutaneous fibrosis. Guazzzroni M et al21 demonstrated that SWE held significant value in diagnosing and managing of psoriasis by quantifying plaque stiffness and monitoring treatment response in psoriatic lesions. Their findings indicated that SWE can detect changes in skin stiffness earlier than conventional clinical scores, thereby allowing prediction of therapeutic response at an earlier stage.
The findings of our study revealed that the dermal thickness and SWE parameters were significantly higher in the C4a and C4b groups compared to the control, C2, and C3 groups, with group C4b showing higher values than group C4a. Additionally, the subcutaneous tissue layer thickness and SWE parameters were significantly greater in the C3, C4a, and C4b groups than both the control and C2 groups, showing a progressive increase from group C3, group C4a to group C4b. The key pathological mechanism for these changes is chronic venous hypertension in the lower extremities. Sustained venous hypertension induces changes in vascular shear stress, leading to endothelial dysfunction and accumulation of white blood cells, which thereby initiates an inflammatory response.22 The inflammatory cytokines released by white blood cells, such as IL-6 and TNF-α, increase additional inflammatory cells, exacerbating tissue inflammatory infiltration and ultimately leading to microcirculatory impairment in the dermal and subcutaneous tissue layers.23,24 This process subsequently results in changes in the elasticity of the dermal and subcutaneous tissue layers. Furthermore, increased levels of inflammatory cytokines also contribute to increased CRP production, which exacerbates local microcirculatory impairment.25 In addition, inflammatory cytokines can stimulate inflammatory cells, such as neutrophils, eosinophils, macrophages, to overexpress matrix metalloproteinases (eg, MMP-2). MMP-2 degrades extracellular matrix (ECM) components, such as collagen, elastin, and leads to changes in ECM structural proteins. In severe cases, it can cause the degradation of collagen in the epidermal basement membrane and loss of epidermal integrity, which may progress to ulcer formation.24,26 On the other hand, the combined impact of venous hypertension and the inflammatory response in the lower extremities induces venous wall remodeling and increased vascular permeability, resulting in the extravasation of macromolecules such as red blood cells, white blood cells, fibrinogen, which ultimately triggers a widespread chronic inflammatory response.27 Following the extravasation of red blood cells, hemoglobin is degraded and converted into hemosiderin. The subsequent deposition of hemosiderin in the skin not only causes hyperpigmentation but also contributes to tissue hypoxia, ultimately resulting in reduced elasticity of the dermal and subcutaneous layers.2,28 In our study, the higher DT, SCTT, and SWE parameters in group C4b compared to group C4a were attributed to increased extravasation of fibrinogen. This extravasated fibrinogen forms “pericapillary fibrin cuffs” that impede oxygen and nutrient uptake in the dermal and subcutaneous tissue layers, ultimately causing localized skin malnutrition and severe fibrosis, which clinically presents as skin thickening and hardening, known as LDS.29 Moreover, the absence of significant differences in various parameters between group C2 and the control group can be attributed to the fact that the inflammatory response in group C2 was confined to the vascular structures and had not yet induced inflammatory infiltration or serological changes in the dermal and subcutaneous tissue layers.30 Similarly, the DT and SWE parameters of the dermal layers in group C3 showed no significant differences compared to both the control and C2 groups. This is because, during the edema stage, only parts of the fluid, proteins, and blood cells extravasate into the subcutaneous tissue layers without invading the dermal layers, thus primarily manifesting as edema within the subcutaneous tissue layers.31,32 These findings suggested that the activation of the inflammatory cascade may contribute to increased disease severity while concurrently reducing the elasticity of both the dermal and subcutaneous tissue.
In our study, serum levels of CRP, MMP-2, IL-6, and TNF-α in the C3, C4a, and C4b groups were significantly increased compared to both the control and C2 groups, demonstrating a progressive increase from group C3, group C4a to group C4b. These findings further highlighted that inflammatory activation drives the progression of pathological changes in the dermal and subcutaneous tissue layers. Furthermore, correlation analysis in our study demonstrated that SWE parameters of both the dermal and subcutaneous tissue layers were positively correlated with MMP-2 and IL-6 levels, providing additional evidence that SWE can be effectively used to evaluate changes in skin elasticity in the dermal and subcutaneous tissue layers in patients with CVD.
This study is a retrospective cross-sectional study, which has several limitations. Firstly, this was a single-center study, which inherently limited the sample size. Therefore, further research involving more participants is needed for more detailed analyses in the future. Secondly, prospective research of SWE assessing skin elasticity with a patient cohort that includes follow-ups after treatment, would give more detailed knowledge regarding evaluation for CVD. Finally, measurements of skin stiffness may be biased because of the inevitable use of ultrasound gel pad and slight compression, so we applied two operators with 6 years of SWE experience to perform skin examination in our study and minimize this human error as much as possible, and repeated measurements were averaged to minimize this effect.
Conclusion
This study aimed to quantitatively evaluate skin elasticity in patients with CVD of different CEAP classifications using SWE. The results demonstrated a significant reduction in the dermal and subcutaneous tissue layer among patients classified as C4a and C4b. In contrast, only the subcutaneous tissue layer exhibited reduced elasticity in C3 patients, while no significant change in the dermal and subcutaneous tissue layer was observed in C2 patients. Significantly, SWE parameters revealed a statistically positive correlation with laboratory parameters.
In conclusion, SWE enables quantitative assessment of skin elasticity during early changes in patients with CVD of the lower extremity.
Data Sharing Statement
The datasets used and/or analyzed during the current study are available from the corresponding author, Guangsen Li, upon reasonable request.
Ethics Approval and Consent to Participate
The study protocol was reviewed and approved by the Ethics Committee of the Second Affiliated Hospital of Dalian Medical University (Approval No. KY2025-300-01-01). The study was conducted in accordance with all standard protocols and ethical principles outlined in the 1964 Declaration of Helsinki and its later amendments. Written informed consent was obtained from all participants prior to their inclusion in the study.
Funding
There is no funding to report.
Disclosure
The authors declare no competing interests in this work.
References
1. Yosipovitch G, Nedorost ST, Silverberg JI, Friedman AJ, Canosa JM, Cha A. Stasis dermatitis: an overview of its clinical presentation, pathogenesis, and management. Am J Clin Dermatol. 2023;24(2):275–286. doi:10.1007/s40257-022-00753-5
2. Kumar P, Khan IA, Das A, Shah H. Chronic venous disease. Part 1: pathophysiology and clinical features. Clin Exp Dermatol. 2022;47(7):1228–1239. doi:10.1111/ced.15143
3. Kokkinidis DG, Ochoa chaar CI, Mena-Hurtado CI, Attaran RR. Correlation between reflux time and venous clinical severity score in patients undergoing saphenous vein ablation: a prospective study. Phlebology. 2023;38(1):62–66. doi:10.1177/02683555221146730
4. Yang Y, Tang X, Zhong L, et al. Shear wave elastography-based skin assessment system for systemic sclerosis: a supplement or alternative to conventional ultrasound? Quant Imaging Med Surg. 2023;13(7):4405–4414. doi:10.21037/qims-22-1267
5. Zarrad M, Duflos C, Marin G, et al. Skin layer thickness and shear wave elastography changes induced by intensive decongestive treatment of lower limb lymphedema. Lymphat Res Biol. 2022;20(1):17–25. doi:10.1089/lrb.2021.0036
6. Etesami I, Azizi N, Sabrinejad R, et al. Sonographic skin features and shear wave elastography in distinguishing active from inactive morphea lesions: a case-control study. J Am Acad Dermatol. 2025;92(1):155–157. doi:10.1016/j.jaad.2024.09.026
7. Lurie F, Passman M, Meisner M, et al. The 2020 update of the CEAP classification system and reporting standards. J Vasc Surg Venous Lymphat Disord. 2020;8(3):342–352. doi:10.1016/j.jvsv.2019.12.075
8. Gloviczki P, Lawrence PF, Wasan SM, et al. The 2023 Society for Vascular Surgery, American Venous Forum, and American Vein and Lymphatic Society clinical practice guidelines for the management of varicose veins of the lower extremities. Part II: endorsed by the Society of Interventional Radiology and the Society for Vascular Medicine. J Vasc Surg Venous Lymphat Disord. 2024;12(1):101670. doi:10.1016/j.jvsv.2023.08.011
9. Girdhani B, Savlania A, Vaddavalli VV, et al. Assessment of skin and associated soft tissue changes with ultrasonography in chronic venous disease. Phlebology. 2024;39(2):125–131. doi:10.1177/02683555231211404
10. Janßen S, Schmölders J, Jansen TM, et al. Intermittent pneumatic impulse compression in the treatment of stasis dermatitis-a monocenter randomized controlled trial. J Clin Med. 2025;14(10):3321. doi:10.3390/jcm14103321
11. Yosipovitch G, Jackson JM, Nedorost ST, et al. Stasis dermatitis: the burden of disease, diagnosis, and treatment. Dermatitis. 2024;35(4):337–344. doi:10.1089/derm.2022.0076
12. Kılınç F, Akbaş A, Şener S, Hayran Y, Aktaş A. Cutaneous findings in patients with chronic venous insufficiency. J Cosmet Dermatol. 2022;21(5):2106–2112. doi:10.1111/jocd.14337
13. Woźniak W, Danowska A, Mlosek RK. The use of high-frequency skin ultrasound in the diagnosis of lipodermatosclerosis. J Ultrason. 2021;20(83):e284–e290. doi:10.15557/JoU.2020.0050
14. Sun Y, Ma C, Liang X, et al. Reproducibility analysis on shear wave elastography (SWE)-based quantitative assessment for skin elasticity. Medicine. 2017;96(19):e6902. doi:10.1097/MD.0000000000006902
15. Yang Y, Wang L, Yan F, et al. Determination of normal skin elasticity by using real-time shear wave elastography. J Ultrasound Med. 2018;37(11):2507–2516. doi:10.1002/jum.14608
16. Paluch Ł, Pietruski P, Noszczyk B, Kwiek B, Ambroziak M. Intra-rater reproducibility of shear wave elastography in the evaluation of facial skin. Postepy Dermatol Alergol. 2020;37(3):371–376. doi:10.5114/ada.2018.81144
17. Daskareh M, Mehdipour Dalivand M, Esmaeilian S, et al. Diagnostic accuracy of shear wave elastography versus ultrasound in plantar fasciitis among patients with and without ankylosing spondylitis. Diagnostics. 2025;15(15):1967. doi:10.3390/diagnostics15151967
18. Chai K, Zhu R, Luo F, et al. Updated role of high-frequency ultrasound in assessing dermatological manifestations in autoimmune skin diseases. Acta Derm Venereol. 2022;102:adv00765. doi:10.2340/actadv.v102.1969
19. Guiotto M, Sciboz OC, Arquero C, et al. Shear wave elastography of the skin following radial forearm free flap surgery in transgender patients: observational study. J Clin Med. 2024;13(16):4903. doi:10.3390/jcm13164903
20. Cai R, Lin Z, Xu D, Sun Y, Cui L, Mu R. The value of shear wave elastography in diagnosis and assessment of systemic sclerosis. Rheumatol Adv Pract. 2023;7(3):rkad075. doi:10.1093/rap/rkad075
21. Guazzaroni M, Ferrari D, Lamacchia F, et al. Shear wave elastography and microvascular ultrasound in response evaluation to calcipotriol+betamethasone foam in plaque psoriasis. Postgrad Med J. 2021;97(1143):16–22. doi:10.1136/postgradmedj-2020-138150
22. Diaz JA, Gianesini S, Khalil RA. Glycocalyx disruption, endothelial dysfunction and vascular remodeling as underlying mechanisms and treatment targets of chronic venous disease. Int Angiol. 2024;43(6):563–590. doi:10.23736/S0392-9590.24.05339-2
23. Lutze S, Westphal T, Jünger M, Arnold A. Microcirculation disorders of the skin. J Dtsch Dermatol Ges. 2024;22(2):236–264. doi:10.1111/ddg.15242
24. Silverberg J, Jackson JM, Kirsner RS, et al. Narrative review of the pathogenesis of stasis dermatitis: an inflammatory skin manifestation of venous hypertension. Dermatol Ther. 2023;13(4):935–950. doi:10.1007/s13555-023-00908-0
25. Petrascu FM, Matei SC, Margan MM, et al. The impact of inflammatory markers and obesity in chronic venous disease. Biomedicines. 2024;12(11):2524. doi:10.3390/biomedicines12112524
26. Kolano P, Bednarski IA, Kraska-Gacka M, Narbutt J, Lesiak A. Serum concentration of matrix metalloproteinases and angiogenic factors in patients with venous leg ulcers. Postepy Dermatol Alergol. 2021;38(2):230–234. doi:10.5114/ada.2021.106201
27. Lee BB, Nicolaides AN, Myers K, et al. Venous hemodynamic changes in lower limb venous disease: the UIP consensus according to scientific evidence. Int Angiol. 2016;35(3):236–352.
28. Spiewak R. Diseases from the spectrum of dermatitis and eczema: can “omics” sciences help with better systematics and more accurate differential diagnosis? Int J Mol Sci. 2023;24(13):10468. doi:10.3390/ijms241310468
29. Balasubramanyam S, Migden MR, Silapunt S. Venous treatment of lipodermatosclerosis to improve ambulatory function. Dermatol Surg. 2018;44(5):749–752. doi:10.1097/DSS.0000000000001314
30. Tiwary SK, Kumar A, Mishra SP, Kumar P, Khanna AK. Study of association of varicose veins and inflammation by inflammatory markers. Phlebology. 2020;35(9):679–685. doi:10.1177/0268355520932410
31. Matei SC, Matei M, Anghel FM, Carabenciov E, Murariu MS, Olariu S. Utility of routine laboratory tests in the assessment of chronic venous disease progression in female patients. Exp Ther Med. 2022;24(3):571. doi:10.3892/etm.2022.11508
32. Caggiati A. Ultrasonographic study of the effects of compressive stockings on legs with venous edema. Vascular. 2024;32(3):685–693. doi:10.1177/17085381221140172
 © 2025 The Author(s). This work is published and licensed by Dove Medical Press Limited. The
full terms of this license are available at https://www.dovepress.com/terms
and incorporate the Creative Commons Attribution
- Non Commercial (unported, 4.0) License.
By accessing the work you hereby accept the Terms. Non-commercial uses of the work are permitted
without any further permission from Dove Medical Press Limited, provided the work is properly
attributed. For permission for commercial use of this work, please see paragraphs 4.2 and 5 of our Terms.
© 2025 The Author(s). This work is published and licensed by Dove Medical Press Limited. The
full terms of this license are available at https://www.dovepress.com/terms
and incorporate the Creative Commons Attribution
- Non Commercial (unported, 4.0) License.
By accessing the work you hereby accept the Terms. Non-commercial uses of the work are permitted
without any further permission from Dove Medical Press Limited, provided the work is properly
attributed. For permission for commercial use of this work, please see paragraphs 4.2 and 5 of our Terms.