Back to Journals » Breast Cancer: Targets and Therapy » Volume 17
Shear Wave Elastography: A Non-Invasive Approach for Assessing TGF-β1/MAPK Signaling Molecules and EMT in Breast Cancer
Authors Huang S ![]() , Wang B, Jiang Y, Li S, Li J, Wang Z
, Wang B, Jiang Y, Li S, Li J, Wang Z
Received 28 September 2024
Accepted for publication 28 February 2025
Published 26 March 2025 Volume 2025:17 Pages 275—287
DOI https://doi.org/10.2147/BCTT.S498497
Checked for plagiarism Yes
Review by Single anonymous peer review
Peer reviewer comments 2
Editor who approved publication: Dr Pooja Advani
Sisi Huang, Bo Wang, Ying Jiang, Shiyu Li, Junkang Li, Zhili Wang
Department of Ultrasound, the First Medical Center, Chinese PLA General Hospital, Beijing, 100853, People’s Republic of China
Correspondence: Zhili Wang, Department of Ultrasound, the First Medical Center, Chinese PLA General Hospital, 28 Fuxing Road, Beijing, 100853, People’s Republic of China, Tel +86015727396682, Email [email protected]
Background: This study investigated the relationship between Shear Wave Elastography (SWE), TGF-β 1/MAPK signaling molecules, and epithelial-to-mesenchymal transition (EMT) in breast lesions, exploring the feasibility of SWE in early EMT identification for breast cancer.
Methods: 117 breast lesions in 107 patients from July to November 2023 were consecutively enrolled. SWE was performed preoperatively, and elastic parameters were documented. Immunohistochemistry (IHC) assessed the expression levels of TGF-β 1, p38 MAPK, p-p38 MAPK, ERK1/2, p-ERK1/2, ERK5, p-ERK5, JNK, p-JNK, E-cadherin, β-catenin, N-cadherin, and Vimentin. Correlations between SWE parameters and biomarkers were analysed, and their diagnostic efficacy for axillary lymph node metastasis (LNM) was evaluated.
Results: Among 117 breast lesions, 53 were classified as benign and 64 as malignant (25 exhibiting axillary LNM). Optimal SWE thresholds for distinguishing benign from malignant lesions were Emax = 106.7 kPa, Emean = 62.9 kPa, Emin = 22.5 kPa, Eratio = 3.4, and Esd = 21.2 kPa. For LNM prediction, cut-offs were Emax = 170.1 kPa, Emean = 118.5 kPa, and Eratio = 10.5. TGF-β 1 and E-cadherin showed significant predictive value for LNM (AUCs: 0.774 and 0.704, respectively). E-cadherin negatively correlated with SWE parameters, while TGF-β 1 and MAPK molecules (p38 MAPK, p-p38 MAPK) showed positive correlations. Lesions with “stiff rim sign” had significantly lower E-cadherin expression but elevated levels of TGF-β 1 (P< 0.001). Additionally, Vimentin, p38 MAPK and p-p38 MAPK levels were higher in the occurrence of the “stiff rim sign” (P all < 0.05).
Conclusion: TGF-β 1, p38 MAPK, and E-cadherin demonstrated strong diagnostic capabilities and correlated with SWE parameters. SWE offers a promising non-invasive approach for assessing prognosis by identifying EMT characteristics at an earlier stage in breast cancer.
Keywords: breast lesions, shear wave elastography, SWE, epithelial-to-mesenchymal transition, EMT, TGF-β 1, MAPK signaling molecules, axillary LNM
Introduction
Breast cancer has emerged as the leading malignancy identified in women, constituting a major contributor to mortality rates in the female patients.1 Patients diagnosed with metastatic breast cancer generally exhibit a poorer prognosis, as indicated by a 5-year survival rate of only 27%.2 Axillary lymph node metastasis (LNM) is a crucial prognostic risk factor, substantially affecting the likelihood of disease recurrence and overall survival rates.3 Shear Wave Elastography (SWE) is a non-invasive ultrasound imaging technique noted for its excellent reproducibility, which leverages the velocity of shear wave propagation through tissues. SWE calculates the elastic modulus, ultimately generating elasticity maps that enable the quantitative assessment of lesion stiffness. Prior investigations have highlighted the impressive discriminatory accuracy of SWE in identifying breast lesion malignancy.4,5
Epithelial-to-mesenchymal transition (EMT) represents a biological process characterized by transformation of epithelial cells into a mesenchymal phenotype. During EMT, breast tumour epithelial cells epithelial cells relinquish their cellular polarity and intercellular adhesion, thereby acquiring migratory and invasive traits that are characteristic of the process.6,7 And these changes are often accompanied by the modelling of the extracellular matrix and an increase in stiffness.8 EMT is orchestrated by various molecules, chief among them transforming growth factor β1 (TGF-β1), as it serves as a principal inducer of EMT in cancer.9 The MAPK Pathway serves as a vital signaling route within cells, regulating various physiological and pathological effects such as cell growth, differentiation, and stress responses through a cascade of phosphorylation processes. This pathway encompasses four primary sub-pathways: ERK, p38 MAPK, JNK, and ERK5.10 TGF-β1 often mediates this signaling cascade, and its aberrant activation has been linked to unfavourable prognoses and drug resistance in breast cancer.11,12 The interplay among TGF-β1, MAPK, and EMT is complex, with each component exerting influence over the others throughout the initiation and progression of breast cancer. Aberrant TGF-β1 expression may promote breast cancer advancement by triggering the MAPK signaling cascade and initiating EMT, with these biological alterations potentially reflected in the stiffness changes of breast tissue.
However, there is currently a lack of literature exploring the correlation between SWE and TGF-β1, MAPK, and EMT in breast cancer. This research sought to explore potential associations between SWE and these biological factors in breast lesions, thereby offering a novel perspective and methodology for clinical diagnosis, monitoring therapeutic efficacy, and predicting prognosis.
Methods
Patients
Ultrasound and SWE data were prospectively and consecutively collected on 117 breast lesions from 107 female patients treated at our institution between July and November 2023 before surgical resection. The pathological findings were regarded as the definitive “gold standard”. Exclusion criteria for patients included: 1. Prior treatment with radiotherapy or neoadjuvant chemotherapy before the SWE assessment; 2. Concurrent diagnosis of other malignant tumours; 3. Presence of breast implants, such as prostheses; 4. Incomplete clinical and pathological information.
The study complied with the revised 2013 helsinki Declaration and secured ethical clearance from the Ethics Review Board of the Chinese PLA General Hospital (No. S2023-423-02). All individuals provided their voluntary and informed consent.
SWE Examination
The AixPlorer ultrasound system from SuperSonic Imagine (Aix-en-Provence, France) was utilized for SWE, equipped with an L14-5 linear array transducer operating within a frequency range of 4–15 MHz, following a conventional ultrasound examination. Examinations were performed by four sonographers, each of whom had undergone professional training with a minimum of 3 years of expertise in breast SWE, including one senior radiologist with expertise in this domain. Patients were positioned supine, with both breasts exposed, for an initial conventional ultrasound examination. After an optimal two-dimensional image was obtained, the system was switched to the SWE mode to acquire the cross-sectional plane of the lesion’s maximum diameter. The operator applied minimal scanning pressure to reduce the influence of manual compression and maintains the probe stationary for 10 seconds. Patients were instructed to hold their breath to minimize artifacts and enable stable imaging. A region of interest (ROI) was then set, adjusted to encompass the stiffest part of the lesion or adjacent tissue. Elasticity parameters (Emax, Emin, Emean, Esd) were measured, and an Eratio was calculated by comparing an ROI of equivalent size and depth with normal tissue. This process was repeated thrice for averaging.
Immunohistochemistry
The specimens underwent fixation in formalin, followed by embedding in paraffin, and were subsequently sectioned into slices with a thickness of 4 micrometres. IHC assessment was conducted to express the levels of TGF-β1, MAPK molecules and their phosphorylated forms (including p38 MAPK, p-p38 MAPK, ERK1/2, p-ERK1/2, ERK5, p-ERK5, JNK and p-JNK), E-cadherin, β-catenin, N-cadherin, and Vimentin. The IHC staining was analysed using Image-Pro Plus 6.0 software (Media Cybernetics, Rockville, MD, USA). For each sample, five random ROIs were selected and captured at a magnification of 200×. The integrated optical density (IOD) and the area were measured, and the average optical density AOD (IOD/area) was calculated to quantify the expression levels of the target proteins.
Statistical Analysis
Statistical analysis was performed using SPSS 26.0 (IBM Corp., Armonk, NY, USA) and GraphPad Prism 9.5 (GraphPad Software, Inc., San Diego, CA, USA). Quantitative data were presented as mean ± SD and analysed using independent t-tests, while qualitative data were reported as percentages and analysed with chi-square tests or their corrected variants. Receiver operating characteristic (ROC) curves were generated for each variable, assessing the area under the curve (AUC), cut-off values, sensitivity, and specificity. Additionally, Spearman rank correlation tests were utilized for correlation assessments. Significance was set at P<0.05.
Results
Clinicopathological Characteristics
This study analysed 117 breast lesions from patients with a mean age of 48±12 years (ranging from 24 to 77 years). The average lesion size was 2.0±1.3 cm (spanning 0.2 to 6.3 cm). Postoperative pathological results identified 53 lesions as benign and 64 as malignant (Figure 1). The malignant lesions were further categorized as negative LNM group (LNM-, n=39) and positive group (LNM+, n=25). The benign lesions comprised 26 fibroadenomas, 9 adenoses, 15 intraductal papillomas, 2 florid adenoses and 1 sclerosing adenosis. The malignant lesions comprised 41 invasive ductal carcinomas, 10 cases of invasive ductal carcinomas combined with ductal carcinoma in situ (DCIS), 2 mucinous adenocarcinomas, 1 malignant phyllodes tumour, and 10 DCIS cases.
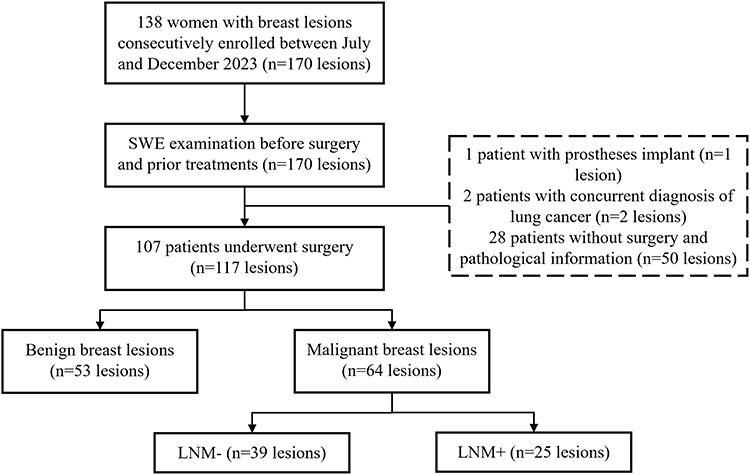 |
Figure 1 Flowchart of patient enrolment. |
Analysis of SWE Parameters of Breast Lesions
The SWE parameters for the three groups are presented in Table 1, as well as Figures 2 and 3. Notably, the values of Emax, Emean, Emin, Eratio, Esd, and the “stiff ring sign” rate were markedly elevated in malignant breast lesions compared to benign lesions (P all <0.001). However, no significant differences were observed in Emin (P=0.104) and Esd (P=0.100) between the LNM- and LNM+ groups. The ROC curves for the elasticity parameters utilized in differential diagnosis are illustrated in Figure 4, Tables 2 and 3. The distinguishing thresholds for Emax, Emean, Emin, Eratio, and Esd in benign vs malignant breast lesions were established as exceeding 106.7 kPa, 62.9 kPa, 22.5 kPa, 3.4, and 21.2 kPa, respectively, with corresponding AUC of 0.933 (95% CI 0.887–0.979), 0.934 (95% CI 0.889–0.980), 0.892 (95% CI 0.829–0.955), 0.906 (95% CI 0.850–0.962), and 0.911 (95% CI 0.852–0.970).
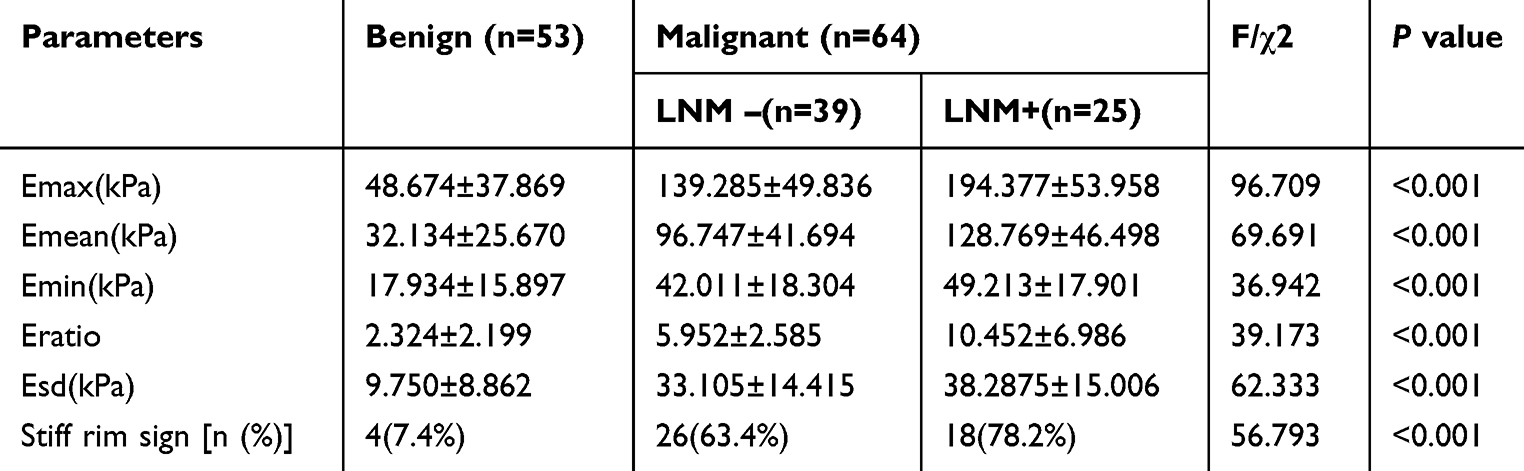 |
Table 1 Comparison of Elastic Parameters Between Benign and Malignant Breast Lesions |
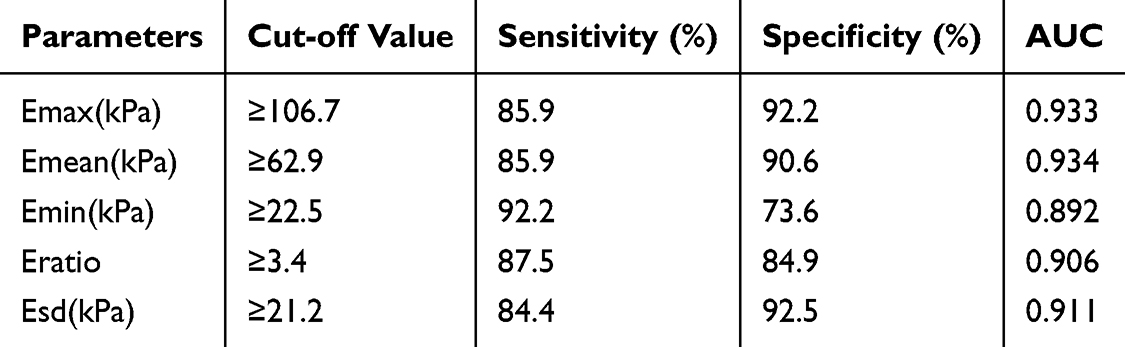 |
Table 2 The Diagnostic Efficacy of Elastic Parameters for Benign and malignant Breast Lesions |
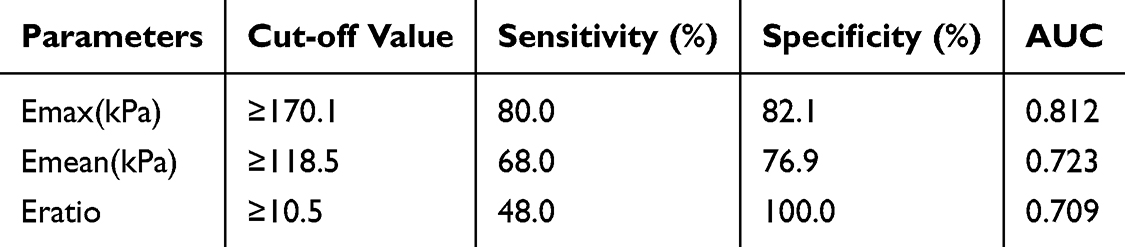 |
Table 3 The Diagnostic Efficacy of Elastic Parameters in Malignant Breast Lesions With or Without Axillary Lymph Node Metastasis |
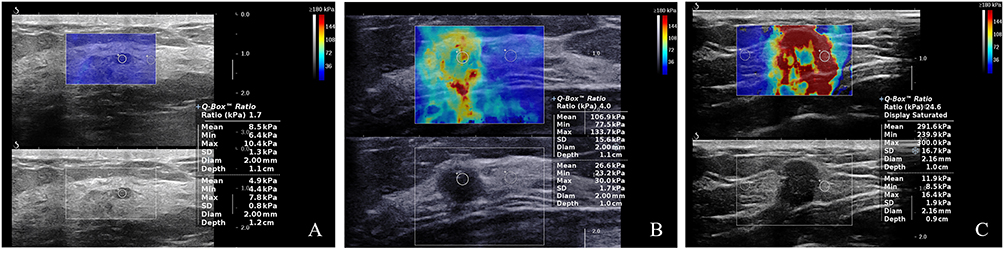 |
Figure 2 SWE images of breast lesions. (A)Benign. (B) Malignant with LNM-. (C) Malignant with LNM+. Abbreviations: SWE, shear wave elastography; LNM, lymph node metastasis. |
 |
Figure 3 Pairwise comparison of elasticity parameters in three groups. Data are presented as mean ± standard deviation (SD). The bars represent the mean values, and the whiskers indicate the SD of the data. ****P<0.0001; ***P<0.001. Abbreviations: ns, non-significant; LNM, lymph node metastasis; Emax, maximum elasticity modulus; Emean, mean elasticity modulus; Emin, minimum elasticity modulus; Eratio, the elasticity ratio of the lesions to the peripheral tissue; Esd, elasticity standard deviation. |
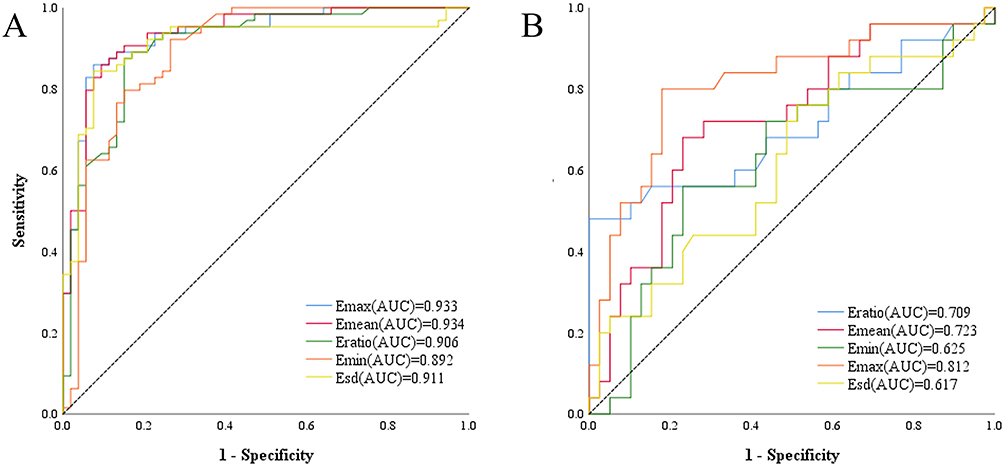 |
Figure 4 The ROC curve of elastic parameters in the differential diagnosis. (A) The ROC curve of elastic parameters in the differential diagnosis of benign and malignant groups.(B) The ROC curve of elastic parameters in the differential diagnosis of LNM- and LNM+ groups. Abbreviations: ROC, receiver operating characteristic; LNM, lymph node metastasis; Emax, maximum elasticity modulus; Emean, mean elasticity modulus; Emin, minimum elasticity modulus; Eratio, elasticity ratio of the lesions to the peripheral tissue; Esd, elasticity standard deviation. |
Figure 4A and 4B depict the LNM- and LNM+ groups, respectively. Among the various elastic parameters assessed, Emax, Emean, and Eratio exhibited superior diagnostic efficacy in determining the presence of axillary LNM, with cut-off values established at 170.1 kPa, 118.5 kPa, and 10.5 for Emax, Emean, and Eratio. And the AUCs for these parameters were recorded as 0.812 (95% CI 0.697–0.926), 0.723 (95% CI 0.593–0.853), and 0.709 (95% CI 0.567–0.851), respectively.
Expression Levels of TGF- β1, MAPK Signaling Molecules and EMT Markers
The expression levels of biomarkers of the three groups were shown in Table 4, Figures 5 and 6. Notably, the expression of E-cadherin demonstrated a significant decline among the three groups (P<0.001), whereas Vimentin exhibited an increasing trend (P=0.006). IHC staining revealed significantly elevated TGF-β1 level and phosphorylated MAPK molecules in malignant lesions compared to benign ones (P all <0.05). The AUC values for differentiating benign from malignant breast lesions were calculated as 0.811 (95% CI 0.734–0.889) for TGF-β1, 0.797 (95% CI 0.716–0.877) for E-cadherin, 0.764 (95% CI 0.678–0.850) for p-p38 MAPK, 0.727 (95% CI 0.636–0.818) for p38 MAPK, and 0.719 (95% CI 0.626–0.811) for p-ERK1/2, respectively, with optimal cut-off AOD values of 0.1015, 0.0963, 0.1006, 0.0904, and 0.1683 (Figure 7 and Table 5). Additionally, we observed that an AOD greater than 0.1087 for TGF-β1 and less than 0.0957 for E-cadherin were significant predictors of axillary LNM, the AUC values were 0.774 (95% CI 0.655–0.894) and 0.704 (95% CI 0.578–0.830), respectively (Table 6).
 |
Table 4 Comparison of Expression Levels of EMT, TGF-β1 and MAPK Signaling Molecules Between Benign and Malignant Breast Lesions |
 |
Table 5 The Diagnostic Efficacy of IHC Biomarkers for Benign and malignant Breast Lesions |
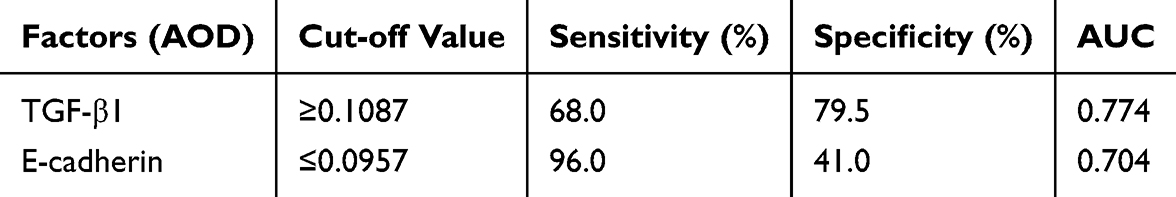 |
Table 6 The Diagnostic Efficacy of IHC Biomarkers in Malignant Breast Lesions With or Without Axillary Lymph Node Metastasis |
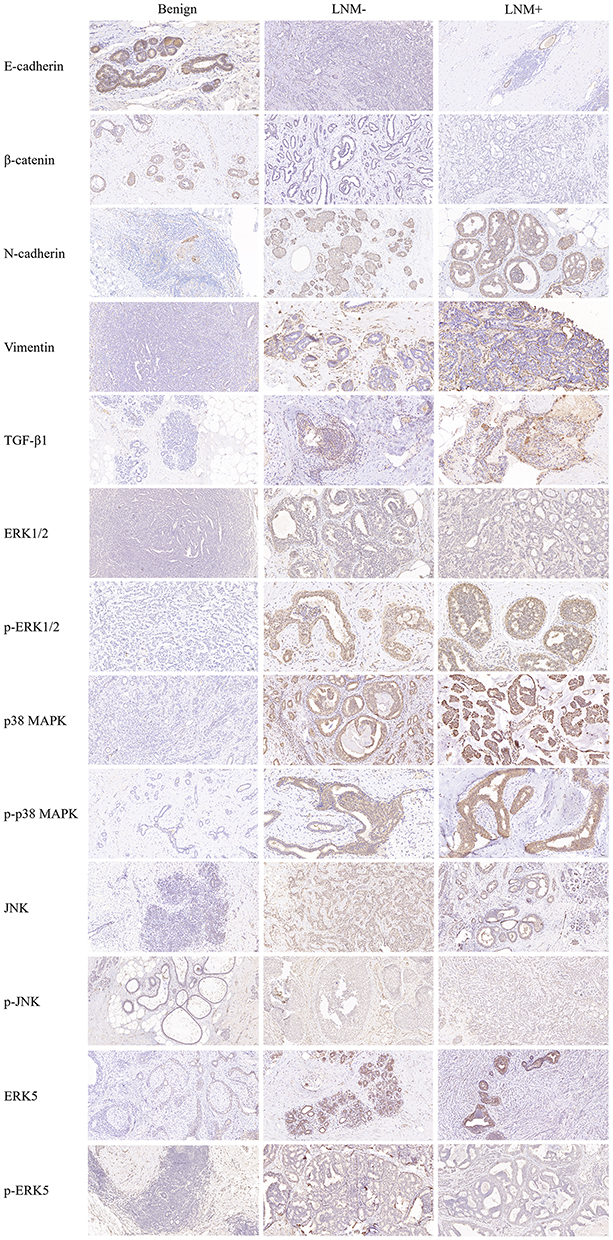 |
Figure 5 The IHC staining of EMT markers, TGF- β1 and MAPK signaling molecules in three groups. Scale bars: 50 µm. Abbreviations: LNM, lymph node metastasis; IHC, Immunohistochemistry. |
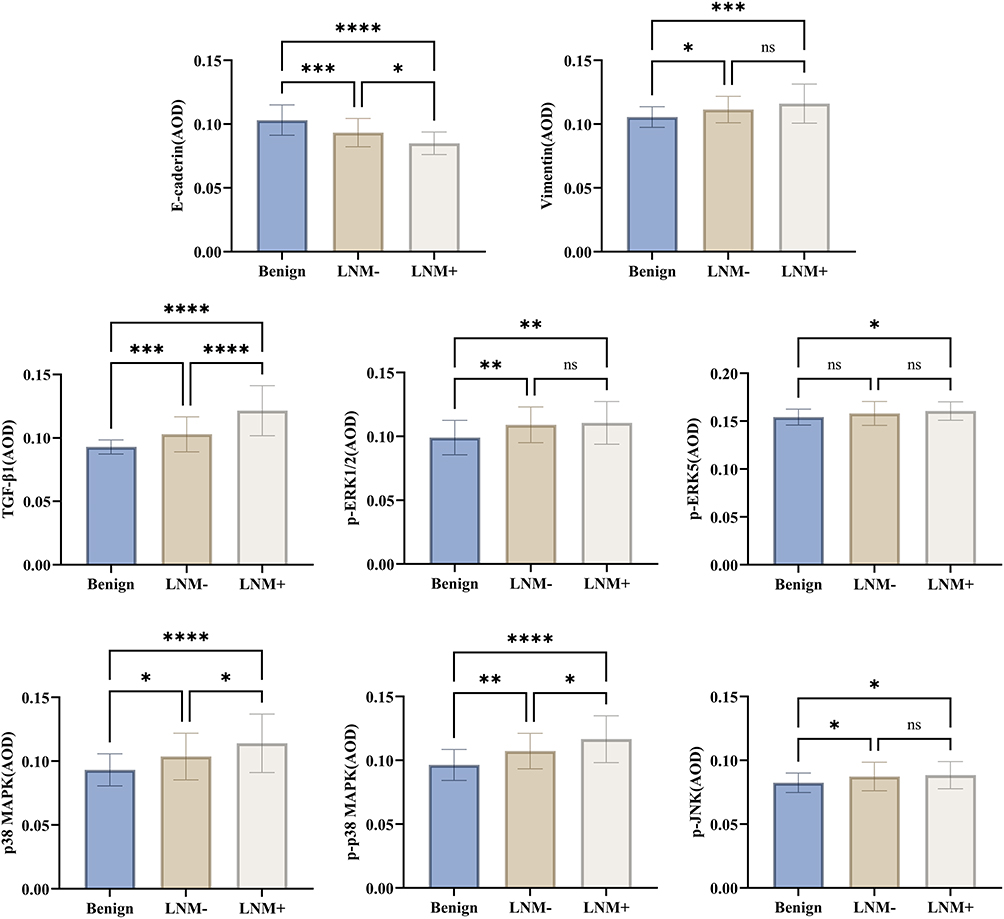 |
Figure 6 Pairwise comparison of the expression levels of EMT markers, TGF- β1 and MAPK signal molecules in three groups. Data are presented as mean ± standard deviation (SD). The bars represent the mean values, and the whiskers indicate the SD of the data. ****P<0.0001; ***P<0.001; **P<0.01; *P<0.05. Abbreviations: ns, non-significant; LNM, lymph node metastasis; EMT, epithelial to mesenchymal transition; AOD, Average optical density. |
 |
Figure 7 The ROC curve of IHC biomarkers in the differential diagnosis. (A) The ROC curve of IHC biomarkers in the differential diagnosis of benign and malignant groups. (B) The ROC curve of IHC biomarkers in the differential diagnosis of LNM- and LNM+ groups. Abbreviations: ROC, receiver operating characteristic; LNM, lymph node metastasis; IHC: Immunohistochemistry. |
Correlation Analysis
We conducted correlation analysis on SWE modulus, EMT markers, TGF-β1 and MAPK signaling molecules (Table 7 and Table 8 and Figure 8). The Spearman correlation test revealed a negative association between E-cadherin expression and the parameters Eratio, Emean, Emin, Emax, and Esd in breast lesions, and the correlation coefficients were −0.398, −0.474, −0.376, −0.536, and −0.474, respectively (P<0.01). Conversely, TGF-β1 expression exhibited a positive correlation with Eratio, Emean, Emin, Emax, and Esd (correlation coefficients = 0.480, 0.624, 0.441, 0.651, and 0.535, P<0.01). Additionally, several MAPK signaling molecules demonstrated a similar positive correlation with the elasticity modulus, particularly p38 MAPK and p-p38 MAPK. Notably, p-p38 MAPK was positively correlated with Eratio, Emean, Emin, Emax, and Esd (correlation coefficient=0.383, 0.449, 0.376, 0.453 and 0.312, P<0.01).
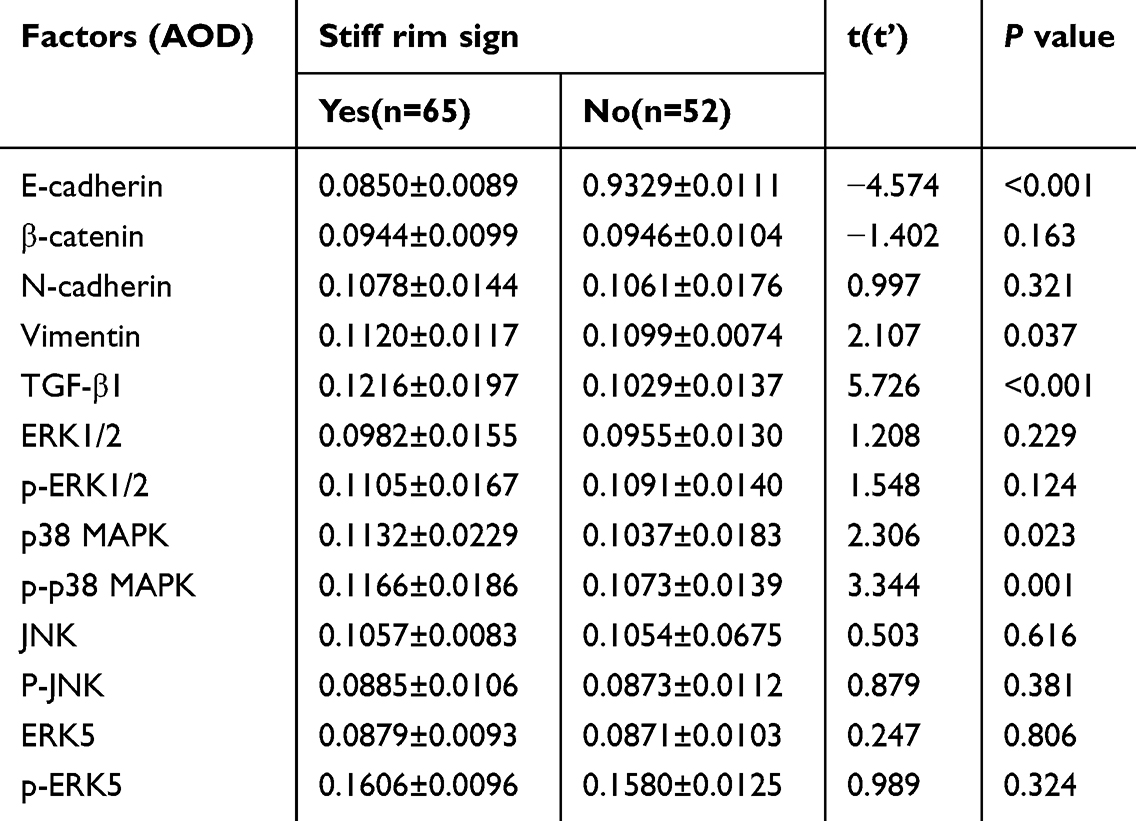 |
Table 7 Comparison of Expression Levels of EMT, TGF-β1 and MAPK Signaling Molecules in Breast Lesions With and Without “Stiff Rim Sign” (X±s) |
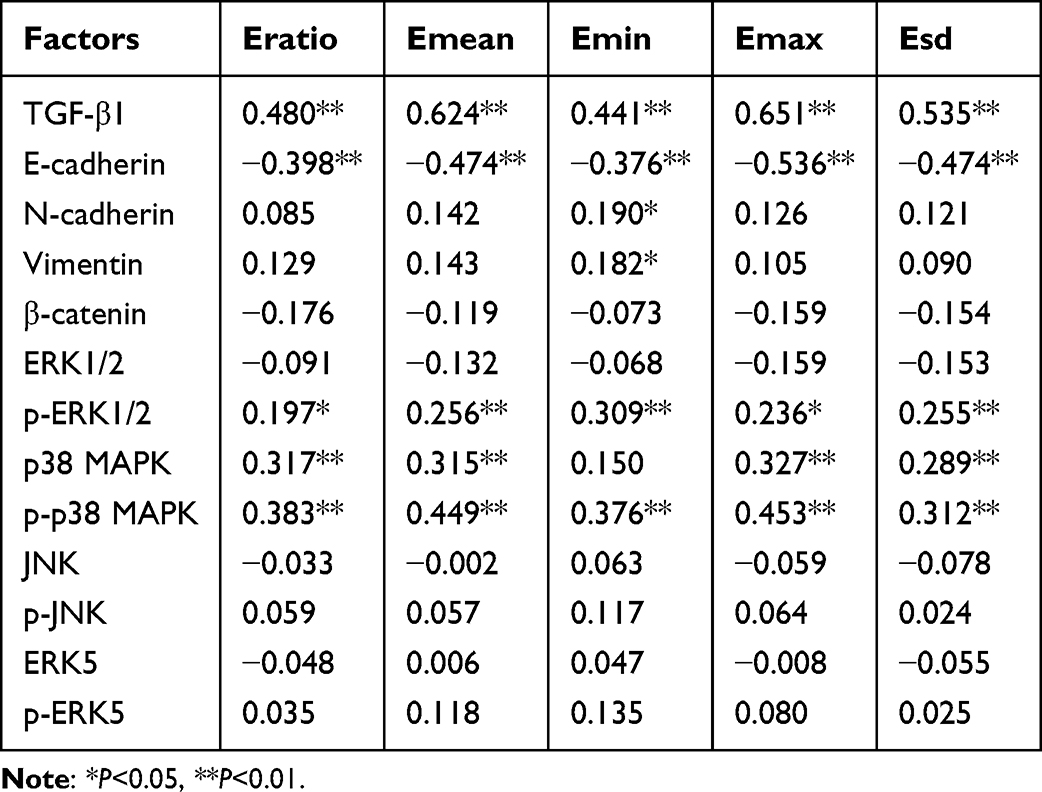 |
Table 8 Correlation of SWE Elastic Modulus and EMT Markers, TGF-β1 and MAPK Signaling Molecules |
 |
Figure 8 (A) Correlations of TGF-β1, E-cadherin, p-p38 MAPK expression with Emax; (B) Correlations of TGF-β1, E-cadherin, p-p38 MAPK expression with Emean. Abbreviations: Emax, maximum elasticity modulus; Emean, mean elasticity modulus. |
These IHC biomarkers expression exhibited significant variations in breast lesions characterized by the “stiff rim sign”. Specifically, E-cadherin levels were significantly lower (P < 0.001), while TGF-β1 levels were markedly higher (P < 0.001) in lesions with the “stiff rim sign”. Additionally, Vimentin (P = 0.037), p38 MAPK (P = 0.023), and p-p38 MAPK (P = 0.001) were significantly elevated in these lesions.
Discussion
The application of SWE in breast diseases diagnosis has become increasingly widespread. By measuring the elastic differences of tissues in real-time and quantitatively, SWE can quantify the stiffness of lesions, manifesting excellent diagnostic value for benign-malignant differentiation of breast lesions.5,13,14 However, opinions on the diagnostic significance of elastic modulus parameters remain varied in current literature.15–17 In this study, SWE exhibited great diagnostic value in distinguishing benign vs malignant breast lesions and predicting axillary LNM. Previous literature has extensively reported that among the SWE parameters, Emax demonstrates the best diagnostic performance.18–20 In terms of Emax, irrespective of the dimensions of the region of interest (ROI), the most rigid segment within the tissue is consistently included, and its absolute measurement is unaffected by the size of the ROI. Although Emean is influenced by the ROI size and lesion depth,21 Au et al22 employed Emean as the evaluation criterion, Emean positively correlating with the aggressiveness, histological grade and degree of vascular invasion in invasive breast cancer. Whereas Youk et al23 contended that Eratio exhibited the best diagnostic efficacy, significantly correlating with larger tumour diameters, ER and PR negative statuses, and higher Ki-67 indices. Our findings were consistent with these reports, particularly with Emax, Emean and Eratio in LNM assessment according to the AUC of 0.812, 0.723, 0.709 and 0.906, respectively. The optimal cut-off values were 170.1kPa, 118.5kPa and 10.5 of Emax, Emean and Eratio. Higher SWE elasticity parameters are more commonly observed in malignant lesions, which may be related to the increased tissue stiffness caused by fibromatous stroma hyperplasia and increased cell density within the malignant carcinoma.
TGF-β1, a multifunctional cytokine, contributes to the advancement and metastasis of cancer, particularly in its later stages. It plays a crucial role in the remodelling of the extracellular matrix in breast cancer by modifying the stiffness and composition of this matrix. This is achieved through the enhancement of collagen synthesis, secretion, and cross-linking, along with other matrix proteins. Such alterations have a profound effect on the microenvironment surrounding breast cancer cells, influencing their proliferation, migration, and invasive potential.24 In this study, when the AOD value of TGF-β1 exceeded a specific threshold (>0.1087), it showed a high AUC of 0.774 (95% CI 0.655–0.894) in predicting axillary LNM. Additionally, a positive correlation was identified between TGF-β1 levels and SWE parameters (correlation coefficient=0.651 with Emax, P<0.01), suggesting that elevated TGF-β1 levels were linked to increased tissue stiffness.
In breast cancer, the dysregulation of the MAPK signaling pathway can trigger abnormal cell proliferation and malignant transformation, leading to drug resistance.12,25 The MAPK signaling pathway, primarily activated by TGF-β1, mainly includes several subtypes such as ERK, p38, JNK and ERK5, and their expression in breast cancer is closely related to the patient’s clinical pathological characteristics and prognosis.10,26,27 Our study demonstrated the diagnostic potential of p-p38 MAPK, p38 MAPK, and p-ERK1/2 in differentiating benign from malignant breast lesions, with AUC values of 0.764 (95% CI 0.678–0.850), 0.727 (95% CI 0.636–0.818), and 0.719 (95% CI 0.626–0.811), respectively. Furthermore, p38 MAPK and its phosphorylated form, p-p38 MAPK, positively correlated with SWE parameters and showed higher expression in lesions displaying “stiff rim sign” (P=0.023 and P=0.001). This indicated that the activation of the p38 MAPK pathway may contribute to an increase in the stiffness of malignant lesions. It is important to note that the AUC values for MAPK molecules in this study were relatively lower, potentially due to the fact that the MAPK pathway can also be activated in benign conditions, such as inflammation.
E-cadherin, a vital protein facilitating adhesion among epithelial cells, serves as a pivotal biomarker for EMT.28 The reduced expression of E-cadherin frequently correlates with tumour dedifferentiation and heightened invasiveness.29 In our study, the predictive value of E-cadherin for axillary LNM with AUC of 0.701 (95% CI 0.578–0.830) also underscored its importance in the prognostic assessment of breast cancer. Lesions exhibiting the “stiff rim sign” were associated with increased TGF-β1 level and decreased E-cadherin expression. This sign in malignant lesions stems from a desmoplastic response, featuring cancer cell infiltration into surrounding tissues, increasing lesion stiffness.30 It is often correlated with the malignancy of the carcinoma. Decreased E-cadherin expression and elevated TGF-β1 levels can instigate alterations in the tumour microenvironment, leading to diminished cell adhesion, enhanced infiltration, and modified stroma, suggesting potential mechanisms underlying the formation of the ‘stiff rim sign’.
Our study provided evidence for the interaction between the biomechanical properties of breast lesions assessed by SWE and markers of TGF-β1, MAPK signaling molecules and EMT biomarkers. These results hold considerable importance for the non-invasive evaluation of cancer and may inform future inquiries into the influence of these molecular markers on the advancement of breast cancer and its therapeutic responses. Nevertheless, the present study still has certain limitations. For instance, the sample size may not be able to fully reveal all the variations and complexities of breast lesions. Additionally, the study was conducted at a single medical centre, the general applicability of its results may be limited. The efficacy of SWE and biomarkers in this study did not explore the dynamic changes of these factors nor analyse their potential impact on long-term disease prognosis. Consequently, Large-scale and multi-centre studies to further corroborate these findings are needed, as well as for more in-depth explorations of the mechanisms underlying the relationships between SWE and the identified biomarkers.
Conclusions
TGF-β1, p38 MAPK molecules, and EMT biomarkers effectively differentiate breast lesions and predict LNM, correlating well with SWE. The application of SWE as a non-invasive modality may offer valuable insights into breast cancer prognosis by detecting EMT features at their initial stages.
Abbreviations
SWE: Shear wave elastography; US: Ultrasound; EMT: Epithelial-mesenchymal transformation; TGF-β1: Transforming growth factor β1; LNM: Lymph node metastasis; LNM-: Negative axillary lymph node metastasis; LNM+: Positive axillary lymph node metastasis; Emax: Maximum elasticity modulus; Emin: Minimum elasticity modulus; Emean: Mean elasticity modulus; Eratio: Elasticity ratio of the lesions to the peripheral tissue; Esd: Elasticity standard deviation; IHC: Immunohistochemistry; IOD: Integrated optical density; AOD: Average optical density; ROC: Receiver operator characteristic curve; ROI: Region of interest; AUC: Area under the curve; Cl: Confidence interval; DCIS: ductal carcinomas in situ.
Data Sharing Statement
All data analysed in this study are included in this published article.
Ethics Approval and Consent to Participate
The study was conducted in accordance with the Declaration of Helsinki (as revised in 2013). The study was approved by the Ethics Committee of the Chinese PLA General Hospital (No. S2023-423-02), and informed consent was taken from all individual participants.
Author Contributions
All authors made a significant contribution to the work reported, whether that is in the conception, study design, execution, acquisition of data, analysis and interpretation, or in all these areas; took part in drafting, revising or critically reviewing the article; gave final approval of the version to be published; have agreed on the journal to which the article has been submitted; and agree to be accountable for all aspects of the work.
Funding
This study was supported by grants from the National Natural Science Foundation of China (82371972).
Disclosure
The authors report no conflicts of interest in this work.
References
1. Siegel RL, Miller KD, Wagle NS, Jemal A. Cancer statistics, 2023. CA Cancer J Clin. 2023;73(1):17–48. doi:10.3322/caac.21763
2. Sundquist M, Brudin L, Tejler G. Improved survival in metastatic breast cancer 1985-2016. Breast. 2017;31:46–50. doi:10.1016/j.breast.2016.10.005
3. Jamaris S, Jamaluddin J, Islam T, et al. Is pre-operative axillary ultrasound alone sufficient to determine need for axillary dissection in early breast cancer patients? Medicine. 2021;100(19):e25412. doi:10.1097/md.0000000000025412
4. Golatta M, Pfob A, Büsch C, et al. The potential of combined shear wave and strain elastography to reduce unnecessary biopsies in breast cancer diagnostics - an international, multicentre trial. Eur J Cancer. 2022;161:1–9. doi:10.1016/j.ejca.2021.11.005
5. Barr RG, Engel A, Kim S, Tran P, De Silvestri A. Improved breast 2D SWE algorithm to eliminate false-negative cases. Invest Radiol. 2023;58(10):703–709. doi:10.1097/rli.0000000000000972
6. Park M, Kim D, Ko S, Kim A, Mo K, Yoon H. Breast cancer metastasis: mechanisms and therapeutic implications. Int J mol Sci. 2022;23(12). doi:10.3390/ijms23126806
7. Ribatti D, Tamma R, Annese T. Epithelial-mesenchymal transition in cancer: a historical overview. Transl Oncol. 2020;13(6):100773. doi:10.1016/j.tranon.2020.100773
8. Tian H, Shi H, Yu J, Ge S, Ruan J. Biophysics role and biomimetic culture systems of ECM stiffness in cancer EMT. Glob Chall. 2022;6(6):2100094. doi:10.1002/gch2.202100094
9. Hao Y, Baker D, Ten Dijke P. TGF-β-mediated epithelial-mesenchymal transition and cancer metastasis. Int J mol Sci. 2019;20(11):2767. doi:10.3390/ijms20112767
10. Kim EK, Choi EJ. Compromised MAPK signaling in human diseases: an update. Arch Toxicol. 2015;89(6):867–882. doi:10.1007/s00204-015-1472-2
11. Perez Kerkvliet C, Dwyer AR, Diep CH, et al. Glucocorticoid receptors are required effectors of TGFβ1-induced p38 MAPK signaling to advanced cancer phenotypes in triple-negative breast cancer. Breast Cancer Res. 2020;22(1):39. doi:10.1186/s13058-020-01277-8
12. Lee S, Rauch J, Kolch W. Targeting MAPK signaling in cancer: mechanisms of drug resistance and sensitivity. Int J mol Sci. 2020;21(3). doi:10.3390/ijms21031102
13. Tian J, Liu Q, Wang X, Xing P, Yang Z, Wu C. Application of 3D and 2D quantitative shear wave elastography (SWE) to differentiate between benign and malignant breast masses. Sci Rep. 2017;7:41216. doi:10.1038/srep41216
14. Bö MD D, Buğdaycı OM, Ertaş G, Şanlı DM, Kaya HM, Arıbal EM. Linear regression modeling based scoring system to reduce benign breast biopsies using multi-parametric us with color Doppler and SWE. Acad Radiol. 2023;30(Suppl 2):S143–s53. doi:10.1016/j.acra.2023.01.024
15. Berg WA, Cosgrove DO, Doré CJ, et al. Shear-wave elastography improves the specificity of breast US: the BE1 multinational study of 939 masses. Radiology. 2012;262(2):435–449. doi:10.1148/radiol.11110640
16. Gweon HM, Youk JH, Son EJ, Kim JA. Visually assessed colour overlay features in shear-wave elastography for breast masses: quantification and diagnostic performance. Eur Radiol. 2013;23(3):658–663. doi:10.1007/s00330-012-2647-3
17. Youk JH, Gweon HM, Son EJ, Han KH, Kim JA. Diagnostic value of commercially available shear-wave elastography for breast cancers: integration into BI-RADS classification with subcategories of category 4. Eur Radiol. 2013;23(10):2695–2704. doi:10.1007/s00330-013-2873-3
18. Hari S, Paul SB, Vidyasagar R, et al. Breast mass characterization using shear wave elastography and ultrasound. Diagn Interv Imaging. 2018;99(11):699–707. doi:10.1016/j.diii.2018.06.002
19. Youk JH, Gweon HM, Son EJ. Shear-wave elastography in breast ultrasonography: the state of the art. Ultrasonography. 2017;36(4):300–309. doi:10.14366/usg.17024
20. Evans A, Sim YT, Pourreyron C, et al. Pre-operative stromal stiffness measured by shear wave elastography is independently associated with breast cancer-specific survival. Breast Cancer Res Treat. 2018;171(2):383–389. doi:10.1007/s10549-018-4836-5
21. Skerl K, Vinnicombe S, Giannotti E, Thomson K, Evans A. Influence of region of interest size and ultrasound lesion size on the performance of 2D shear wave elastography (SWE) in solid breast masses. Clin Radiol. 2015;70(12):1421–1427. doi:10.1016/j.crad.2015.08.010
22. Au FW, Ghai S, Moshonov H, et al. Diagnostic performance of quantitative shear wave elastography in the evaluation of solid breast masses: determination of the most discriminatory parameter. AJR Am J Roentgenol. 2014;203(3):W328–36. doi:10.2214/ajr.13.11693
23. Youk JH, Son EJ, Gweon HM, Han KH, Kim J-A, Tagliabue E. Quantitative lesion-to-fat elasticity ratio measured by shear-wave elastography for breast mass: which area should be selected as the fat reference? PLoS One. 2015;10(9):e0138074. doi:10.1371/journal.pone.0138074
24. Jiang Y, Wang B, Li JK, et al. Collagen fiber features and COL1A1: are they associated with elastic parameters in breast lesions, and can COL1A1 predict axillary lymph node metastasis? BMC Cancer. 2022;22(1):1004. doi:10.1186/s12885-022-10092-7
25. Sarg NH, Zaher DM, Abu Jayab NN, Mostafa SH, Ismail HH, Omar HA. The interplay of p38 MAPK signaling and mitochondrial metabolism, a dynamic target in cancer and pathological contexts. Biochem Pharmacol. 2024;225:116307. doi:10.1016/j.bcp.2024.116307
26. Yan W, Wang X, Wang W, et al. The p38/MAPK pathway as a therapeutic target to prevent therapeutic escape of breast cancer stem cells. Sci China Life Sci. 2024;67(9):1867–1880. doi:10.1007/s11427-023-2585-5
27. Zhang YE. Non-Smad pathways in TGF-beta signaling. Cell Res. 2009;19(1):128–139. doi:10.1038/cr.2008.328
28. Yang J, Antin P, Berx G, et al. Guidelines and definitions for research on epithelial-mesenchymal transition. Nat Rev mol Cell Biol. 2020;21(6):341–352. doi:10.1038/s41580-020-0237-9
29. Wong SHM, Fang CM, Chuah LH, Leong CO, Ngai SC. E-cadherin: its dysregulation in carcinogenesis and clinical implications. Crit Rev Oncol Hematol. 2018;121:11–22. doi:10.1016/j.critrevonc.2017.11.010
30. Zhou J, Zhan W, Chang C, et al. Breast lesions: evaluation with shear wave elastography, with special emphasis on the “stiff rim” sign. Radiology. 2014;272(1):63–72. doi:10.1148/radiol.14130818
 © 2025 The Author(s). This work is published and licensed by Dove Medical Press Limited. The
full terms of this license are available at https://www.dovepress.com/terms
and incorporate the Creative Commons Attribution
- Non Commercial (unported, 3.0) License.
By accessing the work you hereby accept the Terms. Non-commercial uses of the work are permitted
without any further permission from Dove Medical Press Limited, provided the work is properly
attributed. For permission for commercial use of this work, please see paragraphs 4.2 and 5 of our Terms.
© 2025 The Author(s). This work is published and licensed by Dove Medical Press Limited. The
full terms of this license are available at https://www.dovepress.com/terms
and incorporate the Creative Commons Attribution
- Non Commercial (unported, 3.0) License.
By accessing the work you hereby accept the Terms. Non-commercial uses of the work are permitted
without any further permission from Dove Medical Press Limited, provided the work is properly
attributed. For permission for commercial use of this work, please see paragraphs 4.2 and 5 of our Terms.