Back to Journals » Drug Design, Development and Therapy » Volume 13
Sevoflurane post-conditioning alleviates neonatal rat hypoxic-ischemic cerebral injury via Ezh2-regulated autophagy
Authors Xue H, Xu Y, Wang S, Wu ZY, Li XY, Zhang YH, Niu JY, Gao QS, Zhao P ![]()
Received 6 December 2018
Accepted for publication 4 March 2019
Published 15 May 2019 Volume 2019:13 Pages 1691—1706
DOI https://doi.org/10.2147/DDDT.S197325
Checked for plagiarism Yes
Review by Single anonymous peer review
Peer reviewer comments 2
Editor who approved publication: Dr Qiongyu Guo
Hang Xue, Ying Xu, Shuo Wang, Zi-Yi Wu, Xing-Yue Li, Ya-Han Zhang, Jia-Yuan Niu, Qiu-Shi Gao, Ping Zhao
Department of Anesthesiology, Shengjing Hospital, China Medical University, Shenyang 110004, People’s Republic of China
Background: When neonatal rats suffer hypoxic-ischemic brain injury (HIBI), autophagy is over-activated in the hippocampus, and inhibition of autophagy provides neuroprotection. The aim of this study was to investigate the possible roles of autophagy and Ezh2-regulated Pten/Akt/mTOR pathway in sevoflurane post-conditioning (SPC)-mediated neuroprotection against HIBI in neonatal rats.
Methods: Seven-day-old Sprague–Dawley rats underwent left common artery ligation followed by 2 h hypoxia as described in the Rice–Vannucci model. The roles of autophagy and the Ezh2-regulated Pten/Akt/mTOR signaling pathway in the neuroprotection conferred by SPC were examined by left-side intracerebroventricular injection with the autophagy activator rapamycin and the Ezh2 inhibitor GSK126.
Results: SPC was neuroprotective against HIBI through the inhibition of over-activated autophagy in the hippocampus as characterized by the rapamycin-induced reversal of neuronal density, neuronal morphology, cerebral morphology, and the expression of the autophagy markers, LC3B-II and Beclin1. SPC significantly increased the expression of Ezh2, H3K27me3, pAkt, and mTOR and decreased the expression of Pten induced by HI. The Ezh2 inhibitor, GSK126, significantly reversed the SPC-induced changes in expression of H3K27me3, Pten, pAkt, mTOR, LC3B-II, and Beclin1. Ezh2 inhibition also reversed SPC-mediated attenuation of neuronal loss and behavioral improvement in the Morris water maze.
Conclusion: These results indicate that SPC inhibits excessive autophagy via the regulation of Pten/Akt/mTOR signaling by Ezh2 to confer neuroprotection against HIBI in neonatal rats.
Keywords: sevoflurane post-conditioning, hypoxic-ischemic brain injury, neonatal rat, autophagy, Ezh2, Pten/Akt/mTOR
Introduction
Neonatal hypoxic-ischemic brain injury (HIBI), which is associated with a morbidity of 2.5/1,000 live births (4–9 million infants globally), is a perinatal brain injury that occurs during fetus distress in utero, suffocating asphyxia during or after parturition, or intrauterine infection.1 In addition to the high mortality (23%), HIBI can cause long-term neurological sequelae, such as epilepsy as well as cognitive and memory impairment.2 Numerous studies have investigated the effects of various drugs and strategies on HIBI in neonatal rats and the underlying mechanisms.3–11 Volatile anesthetics, such as sevoflurane and isoflurane, are neuroprotective against HIBI in neonatal rats.9–14
Sevoflurane, with its non-pungent smell and small blood gas distribution coefficient that can induce anesthesia rapidly, is the most commonly used anesthetic in neonates in the clinic. Autophagy is an essential process for degradation and recycling of intracellular macromolecules;15 however, it is a double-edged sword to the developing central nervous system (CNS).16–20 Stimuli (eg, HI) can induce excessive autophagy, which is destructive.18,20–22 Our previous studies have shown that autophagy is over-activated in the hippocampus in neonatal rats under HI insult, and inhibiting excessive autophagy attenuates HI-induced brain injury, as well as cognitive and memory impairment.21 Therefore, we were interested in determining whether sevoflurane-conferred neuroprotection against HIBI in neonatal rats is related to inhibited autophagy.
Enhancer of zeste homolog 2 (Ezh2), the subunit of Polycomb repressive complex 2 (PRC2), plays a critical role in mammalian CNS development.23–25 Ezh2 is essential for hippocampal learning, memory, and neurogenesis through trimethylation at lysine 27 of histone H3 (H3K27me3), which silences downstream phosphatase and tensin homolog on chromosome 10 (Pten) expression.26 Moreover, inhibiting or deleting Pten results in downregulation of autophagy through Akt/mTOR signaling.27,28 In this study, we hypothesized that sevoflurane post-conditioning (SPC) would inhibit excessive autophagy to confer neuroprotection against HIBI in neonatal rats, which might be related to regulation of Pten/Akt/mTOR signaling by Ezh2.
Materials and methods
Animals
All animal experiments were carried out in accordance with the recommendations of the National Institutes of Health Guidelines for the Care and Use of Laboratory Animals. All protocols described were approved by the Animal Review Board of Shengjing Hospital, China Medical University.
Neonatal HIBI model
HIBI in neonatal rats was induced as previously described.12,29 Briefly, 7-day-old Sprague–Dawley rats were subjected to permanent double ligation of the left common carotid artery using 7–0 surgical silk under sevoflurane anesthesia. Each operation was performed within 5 mins. After waking, the pups were returned to their mothers for 2 hrs. The pups were then placed in a chamber with constant gas (8% O2, 92% N2) exposure for 2 hrs. The air temperature was controlled at 37°C by submerging the chamber in a temperature-controlled water bath.12 Hippocampi from each group were harvested 24 hrs or 34 d post-HI.
Study groups and sevoflurane post-conditioning
A total of 288 neonatal rats were randomly divided into 8 groups (n=36 per group; 18 males and 18 female, sexed according to the distance from the reproductive organ to the anus). An equal sex ratio was used to eliminate any estrogen effects. The groups were:
Rats in the sham + S or HI + S groups were placed in a chamber containing 2.5% sevoflurane, which equals 1 minimum alveolar concentration (MAC), in 30% O2 and 70% N2 for 30 mins immediately after HI. The protective concentration of sevoflurane was determined previously and was consistent with previous reports.13,14 The dose used is also commonly used for neonates in the clinic.30 The sample size (n=36) was determined by power analysis based on pilot experiment data.
Drug administration
Rats in the HI + R and HI + S + R groups received a left-side intra-cerebroventricular injection of the mTOR inhibitor rapamycin (5 µL, 1 mM; S1093, Selleck). Rats in the HI + G and HI + S + G groups received a left-side intra-cerebroventricular injection of the Ezh2 inhibitor GSK126 (5 µL, 50 µM; S7061, Selleck). Rats in the remaining groups were injected with the same volume of vehicle (1% DMSO). The drugs or vehicle were administered 30 mins before HI.
Protein isolation and western blotting
The cerebral hemispheres were harvested 24 hrs post-HI, and the hippocampal tissues were extracted (n=6 per group). For total protein extraction, each hippocampus was homogenized in RIPA lysis buffer (p0013B, Beyotime) containing protease inhibitors (P8349, Sigma-Aldrich) on ice and then incubated on ice for 30 mins. Samples were centrifuged at 14,000 rpm for 30 mins at 4°C and the supernatants collected. Histones were extracted using the EpiQuik Total Histone Extraction Kit (OP-0006-100, Epigentek). Protein concentrations were determined using the BCA protein assay kit (p0011, Beyotime). Equal amounts of protein were separated using sodium dodecyl-sulfate polyacrylamide gel electrophoresis (SDS-PAGE; 12.5% and 10% for small and large molecular weights, respectively) and transferred to PVDF membranes (IPFL 000 10, Millipore). The membranes were blocked with 5% nonfat milk for 1.5 hrs at room temperature, and then incubated overnight at 4°C with primary antibodies against LC3B (Rabbit polyclonal 1:1,000; Cell Signaling Technology, 2775S), Beclin1 (Rabbit monoclonal 1:1,000; Cell Signaling Technology, 3738s), mTOR (Rabbit monoclonal 1:1,000; Cell Signaling Technology, 2983s), p-Akt (Rabbit polyclonal 1:1,000; Cell Signaling Technology, 9271s), Akt (Rabbit polyclonal 1:1,000; Cell Signaling Technology, 9272s), Pten (Rabbit monoclonal 1:1,000; Cell Signaling Technology, 9188s), Ezh2 (Rabbit monoclonal 1:1,000; Cell Signaling Technology, 5246s), H3K27me3 (Rabbit monoclonal 1:1,000; Cell Signaling Technology, 9733s), and H3 (Mouse monoclonal 1:1,000; Cell Signaling Technology, 14269s). The membranes were incubated with horseradish peroxidase-conjugated secondary antibodies (Zhongshanjinqiao Corporation) at room temperature for 2 hrs and developed using enhanced chemiluminescence (NC15079, SuperSignal West Pico Trial Kit, Thermo). Western blot images were captured using a chemiluminescence imaging system (C300, Azure Biosystems), and quantified using Image-Pro plus 6.0 (Media Cybernetics). The signal intensities of LC3B-II, mTOR, Pten, and Ezh2 were normalized to GAPDH and expressed relative to the control. The p-Akt intensity was normalized to total Akt and H3K27me3 was normalized to H3.
Immunofluorescence
Rats were deeply anesthetized and transcardially perfused with normal saline followed by 4% paraformaldehyde in 0.1 M PBS 24 h post-HI, and then embedded in paraffin after dehydration in graded ethanol. Immunofluorescence was performed on 3.5 μm-thick coronal sections. After hot repairing, the sections were incubated with 10% serum in 0.1 M PBS for 40 mins, and incubated overnight at 4°C with primary antibodies against LC3B (Rabbit polyclonal 1:100; 2775S, Cell Signaling Technology), NeuN (Mouse 1:1,000; 2,742,283, Millipore), or both. Following washing with 0.1 M PBS three times for 5 mins each time, sections were incubated with a FITC-conjugated secondary antibody (Goat anti-rabbit IgG 1:100; SA00003-2, Proteintech) or TRITC-conjugated anti-Mouse IgG (1:100; SA00007-1, Proteintech) at room temperature for 4 hrs. The sections were counterstained with DAPI for 5 mins. Immunofluorescence images were collected using a Nikon Eclipse NI microscope.
Mortality, body weight, and weight ratio of left to right hemisphere
The deaths of rats were recorded during the period from the onset of cerebral HI to day 34 post-HI, and the mortality was calculated. Body weights were measured prior to HI, and then on day 7 and 34 post-HI. Rats (n=10 per group) were euthanized, and the two hemispheres were separated and weighed. The weight ratios of the left to the right hemisphere were measured on day 7 post-HI.
Suspension test
Suspension tests began on day 21 and lasted to day 28 post-HI to reflect sensory and motor function (n=10 per group). Every day at the same time, rats were forced to hold onto a 0.6-cm-wide plastic level with their anterior limbs. The level was 45 cm above the ground. The tests were stopped when the rats fell, their posterior limbs caught the level, or the suspension time was greater than 60 s.12
Morris water maze
The Morris water maze (MWM) test was performed following the suspension test from day 29 to day 34 post-HI to reflect spatial learning and memory as described previously with minor modifications (n=10 per group).21 Briefly, the maze was a 160-cm-wide and 60-cm-high round pool with a black wall. The water level was 30 cm deep and kept at 20±1°C. A 12-cm-wide cylindrical platform was set 1.5 cm below the water face and 30 cm away from the wall in the second quadrant. Four trials were carried out per day at 30-min intervals for 5 days at the same time each day. The rats were placed in one of the four quadrants, each time facing the pool wall to search for the underwater platform. If a rat found the platform within 90 s, it was made to sit on the platform for 20 s. If the rat did not find the platform, it was guided to the platform for 20 s, and the escape latency was recorded as 90 s. For the probe trials on day 34 post-HI, the platform was removed, and the rats were allowed to swim for 90 s. The times for crossing the platform quadrant were recorded. An automatic camera system was set up above the pool and recorded each test route. Data were analyzed using Image Analysis Software (Shanghai Mobiledatum, China).
During the trials, silence and the same constant light intensity were maintained, and the placement of objects was constant. The behavioral tests (suspension and MWM) were conducted by an observer, who was blinded to the group assignments.
Brain histopathology
After the behavioral tests (day 34 post-HI), brains were harvested as described for immunofluorescence (n=9 for each group). Coronal sections (3.5 μm-thick) approximately 3.5 mm from caudal to bregma were obtained for Nissl staining.12 The sections were examined by an observer, who was blinded to the group assignments. The neuronal density in the cornu ammonis 3 (CA3) region was determined by counting the number of cells that were positive for Nissl staining in a reticle (approximately 0.0025 mm2). Three different reticles in the CA3 area of each section were examined to yield the neuronal density in each rat.
Statistical analysis
All data (eg, body weight, brain weight, brain weight ratio, neuronal density ratio, protein expression levels, suspension time, swimming speed, platform quadrant crossing times,time spent in each quadrant) are presented as the mean±the standard deviation (SD), and were analyzed using one-way ANOVA followed by the Student–Newman–Keuls post-hoc test. The escape latency was tested using a two-way repeated ANOVA (treatment as between-groups and time as repeated measure factors) followed by the Bonferroni post-hoc test. The mortality among the groups was analyzed by Z testing. All statistical analyses were performed using GraphPad Prism Version 6.0 (GraphPad Software, USA). A P-value of <0.05 was considered statistically significant.
Results
The general characteristics of each group are presented in Table 1. The mortality of each group post-HI without SPC was approximately 8.3% and was not significantly different from the groups with SPC. There was no significant difference in the body weights between the different groups at any time point.
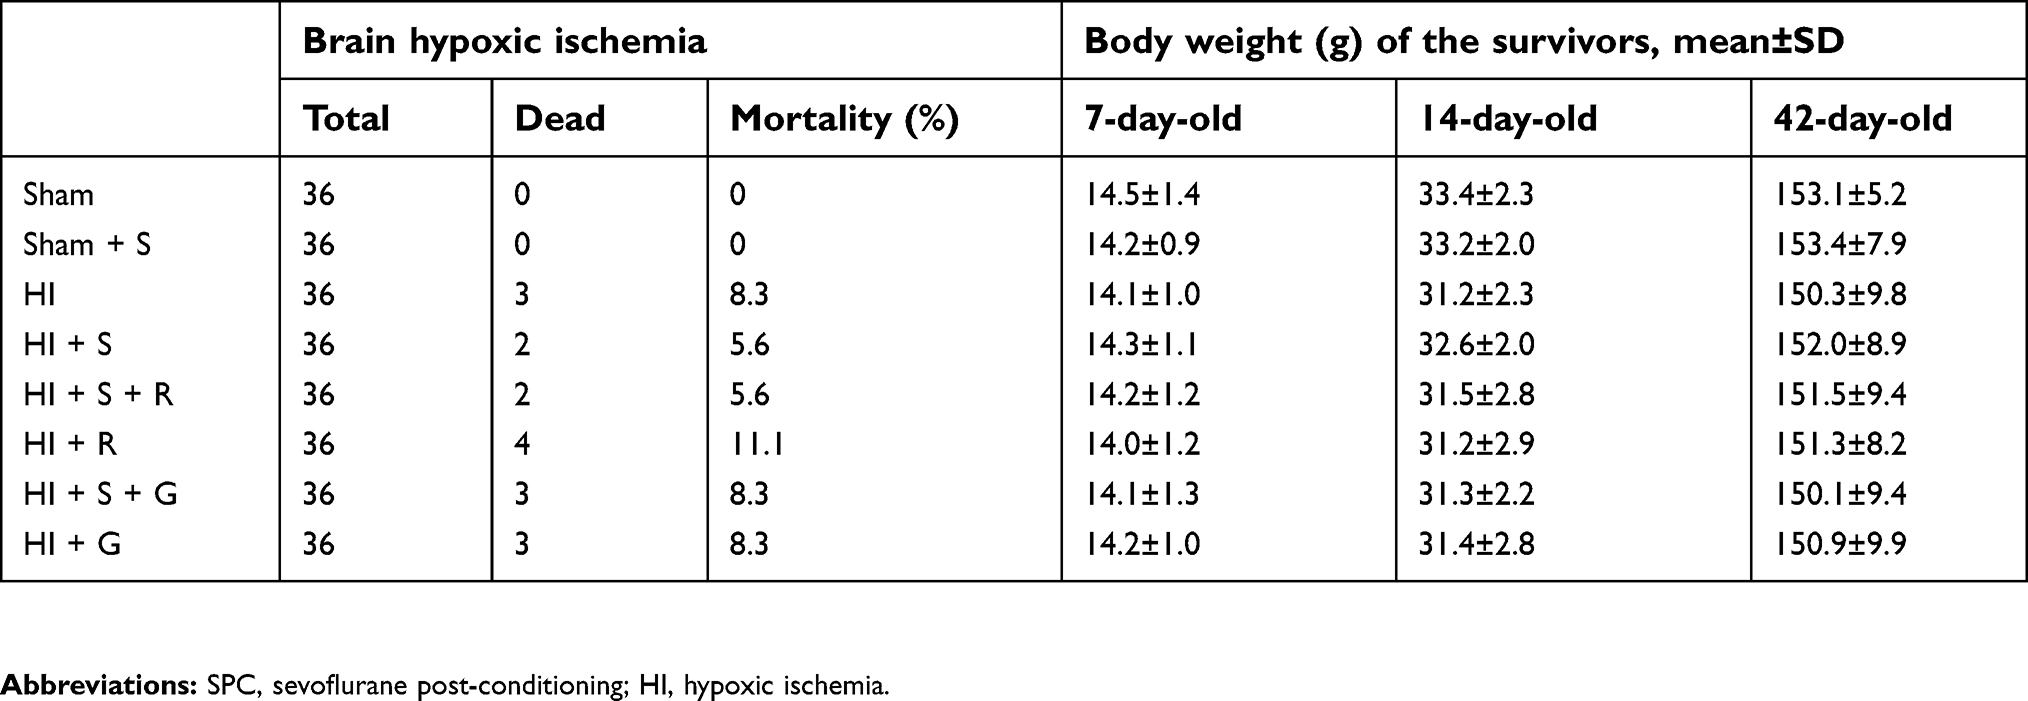 | Table 1 General characteristics |
SPC protects neurons against HI through inhibition of excessive autophagy
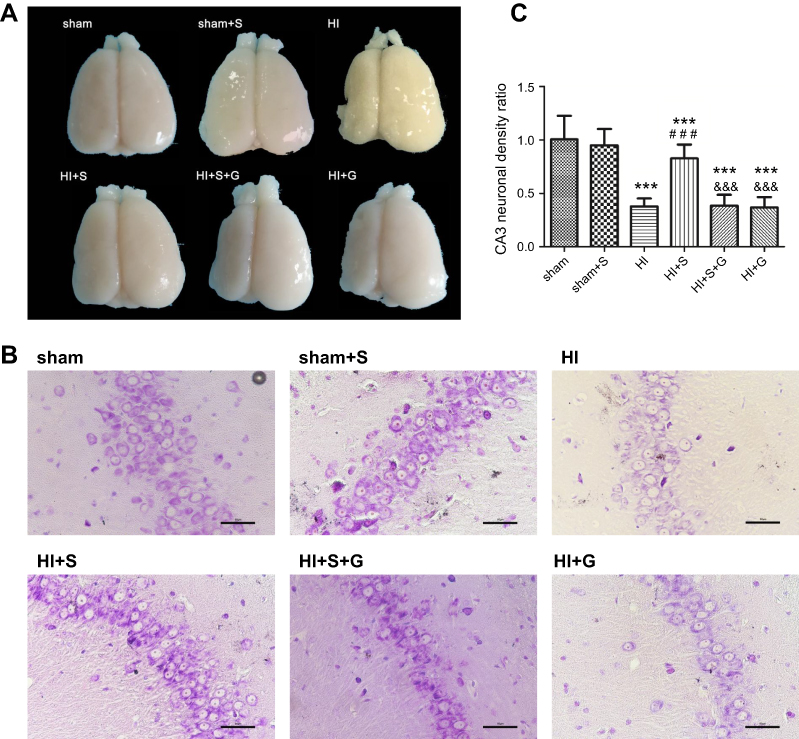
SPC (2.5% for 30 mins) was neuroprotective against HIBI in neonatal rats through the inhibition of over-activated autophagy. Representative images of the cerebral and neuronal morphology on day 34 post-HI are presented in Figure 1A and B. Neurons in the hippocampus of the HI group rats appeared to be in a scattered and irregular distribution with increased intracellular space compared to the sham group (Figure 1B). In addition, the neuronal density in the CA3 region of the hippocampus and the weight ratio of the left to the right hemisphere in the HI group were significantly decreased (Figure 1C, P<0.001; Table 2, P<0.001). SPC attenuated this pathological damage and ameliorated the decreased neuronal density (Figure 1C, P<0.001), weight ratio (Table 2, P<0.01), and cerebral and neuronal morphological damage (Figure 1A and B). Rapamycin treatment (HI + S + R group) reversed the SPC-induced neuroprotection. However, it did not significantly worsen the HI injury (HI + R group versus HI group).
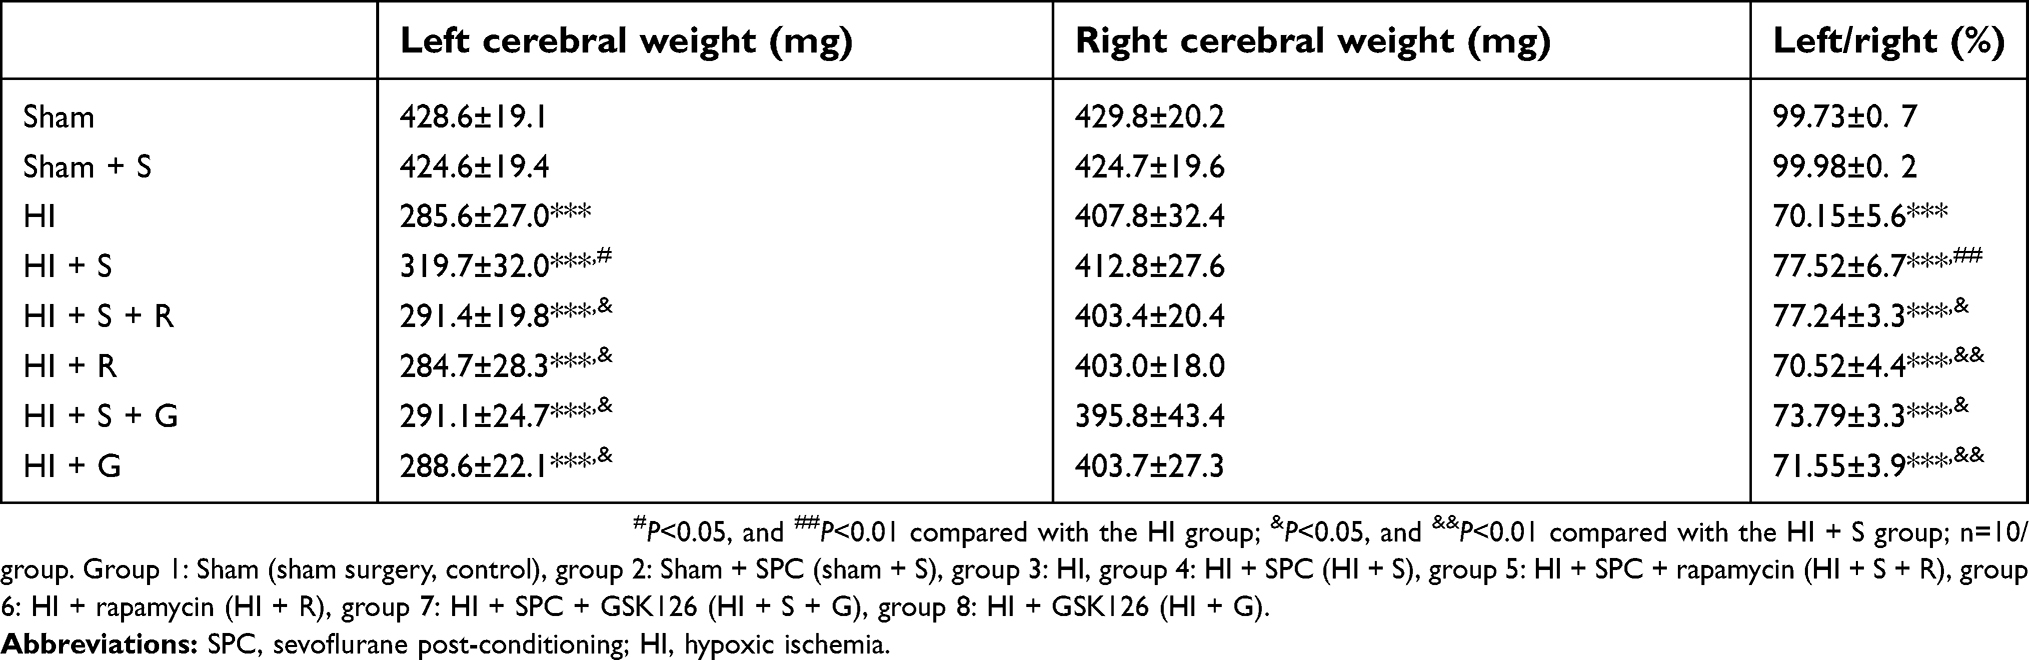 | Table 2 Weight ratio of left/right cerebral hemispheres (mean±SD) |
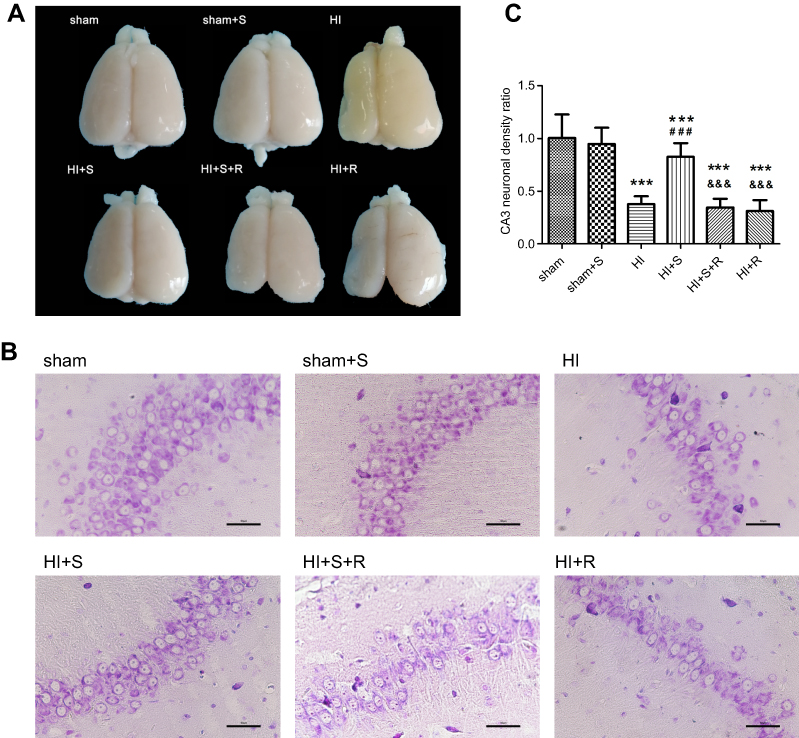 | Figure 1 Long-term neurological changes after HI suffering, SPC or rapamycin injection in each group. (A) Representative cerebral morphological graphs day 34 post-HI. (B) Histological Nissil staining in CA3 region of hippocampus day 34 post-HI, scale bar =50 μm. (C) Neuronal density ratio in CA3 region of hippocampus (n=9/group), values are presented as mean±SD; ***P<0.001 compared with sham group; ###P<0.001 compared with HI group; &&&P<0.001 compared with HI + S group. Group 1: Sham (sham surgery, control), group 2: Sham + SPC (sham + S), group 3: HI, group 4: HI + SPC (HI + S), group 5: HI + SPC + rapamycin (HI + S + R), group 6: HI + rapamycin (HI + R), group 7: HI + SPC + GSK126 (HI + S + G), group 8: HI + GSK126 (HI + G).Abbreviations: SPC, sevoflurane post-conditioning; HI, hypoxic ischemia. |
To further demonstrate the mechanisms underpinning the SPC neuroprotective effects, we measured the protein expression levels of two autophagy markers, microtubule-associated protein 1 light chain 3 (LC3)B-II and Beclin1, 24 hrs post-HI, which represents the peak time point.21 LC3II is produced by forming autophagosomes and allows substrate uptake by binding to several autophagy receptors.31 Beclin1 is involved in the autophagic reaction for the elongation of the pre-autophagosomal membrane.32 HI insult enhances autophagy flux in the hippocampus of neonatal rats.21 Therefore, LC3B-II and Beclin1 can reflect the extent of autophagy. Compared to the sham group, autophagy in the HI group was over-activated as indicated by the significantly elevated expression of the two autophagy markers (Figure 2A and B, P<0.01; Figure 2C, P<0.01). SPC significantly inhibited the elevated autophagy in the HI + S group compared to the HI group (Figure 2A and B, P<0.01; Figure 2C, P<0.05). After treatment with rapamycin, which activates autophagy, inhibition of autophagy by SPC was abrogated (Figure 2A and B, P<0.05; Figure 2C, P<0.05). We also investigated autophagy of the hippocampus by immunofluorescence staining (Figure 2D). Double immunostaining for LC3B and NeuN showed that LC3B was expressed in the hippocampal neurons (Figure 2D). LC3B co-localized with NeuN showed a punctate pattern in the HI, HI + S + R, and HI + R groups, whereas the sham, sham + S, and HI + S groups presented diffused green light labeling. Meanwhile, we observed that there was no significant difference in Beclin1, LC3BII levels between sham group and sham group with rapamycin intra-cerebroventricular injection (Figure S1). Together with the morphological results, these data suggest that SPC inhibited over-activated autophagy in neonatal rats following HI, which could lead to long-term neuroprotective outcomes.
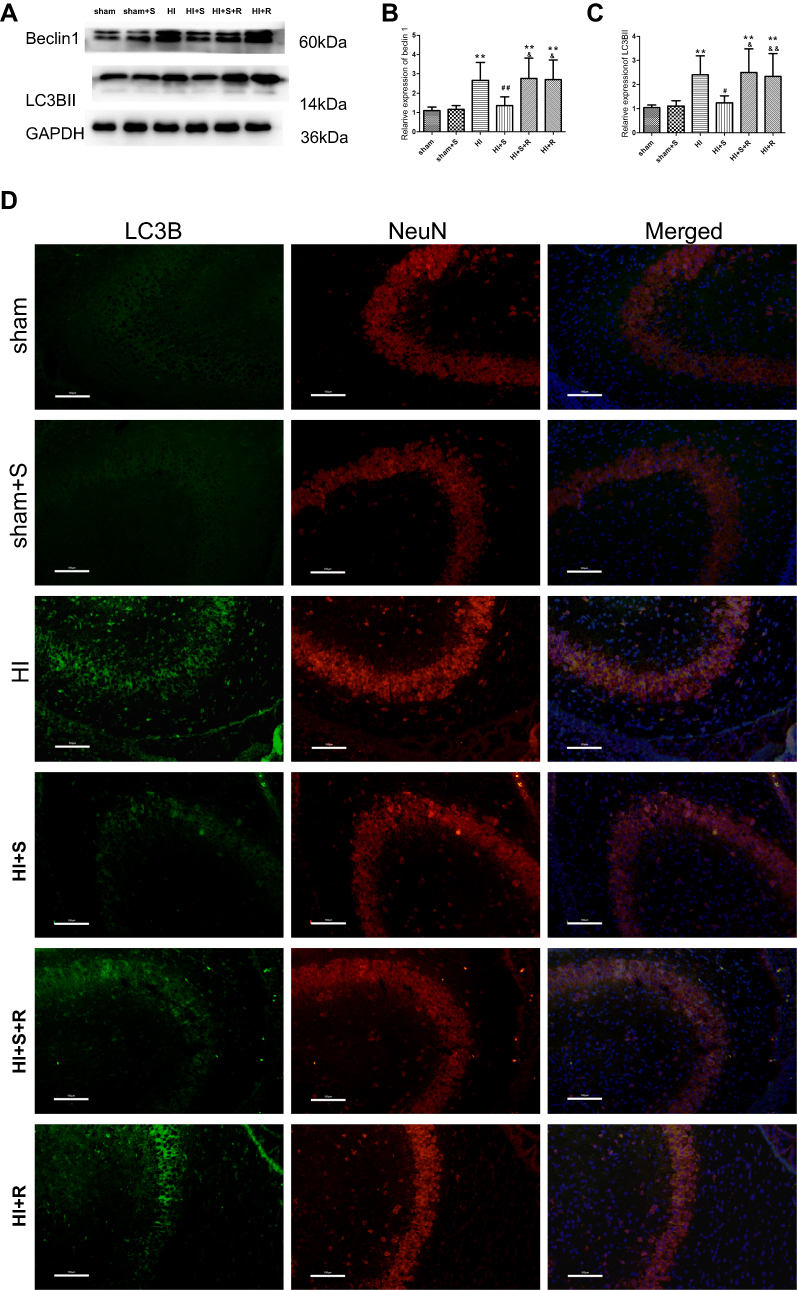 | Figure 2 Autophagy markers expression level changes 24 hrs after HI suffering, SPC or rapamycin injection in each group. Representative western blots (A) and quantification of (B) Beclin1 and (C) LC3B-II, values are presented as mean±SD (n=6/group); **P<0.01 compared with the sham group; #P<0.05, and ##P<0.01 compared with the HI group; &P<0.05, and &&P<0.01 compared with the HI + S group. (D) Representative immunofluorescent staining of LC3B (green) with NeuN (red) in hippocampus, scale bar =100 μm. Group 1: Sham (sham surgery, control), group 2: Sham + SPC (sham + S), group 3: HI, group 4: HI + SPC (HI + S), group 5: HI + SPC + rapamycin (HI + S + R), group 6: HI + rapamycin (HI + R), group 7: HI + SPC + GSK126 (HI + S + G), group 8: HI + GSK126 (HI + G).Abbreviations: SPC, sevoflurane post-conditioning; HI, hypoxic ischemia. |
SPC inhibits excessive autophagy via Ezh2 regulation of Pten/Akt/mTOR pathway
To further explore the underlying mechanisms of SPC-mediated neuroprotection through inhibition of autophagy, we assessed the protein expression level of Ezh2, a critical regulator of autophagy and an epigenetic regulator of Pten;26,33 the level of H3K27me3, and levels of their downstream signaling proteins Pten, Akt, and mTOR 24 h after HI (Figure 3). Our results revealed that the Ezh2, H3K27me3, p-Akt, and mTOR levels decreased and the Pten level increased in the HI group compared to the sham group (Figure 3A and B, P<0.001; Figure 3C, P<0.001; Figure 3D, P<0.01; Figure 3E, P<0.001; Figure 3F, P<0.001). This trend was reversed by SPC in the HI + S group (Figure 3A and B, P<0.01; Figure 3C, P<0.001; Figure 3D, P<0.01; Figure 3E, P<0.001; Figure 3F, P<0.001). Therefore, Ezh2, H3K27me3, and Pten/Akt/mTOR might be involved in SPC-induced neuroprotection after neonatal HIBI.
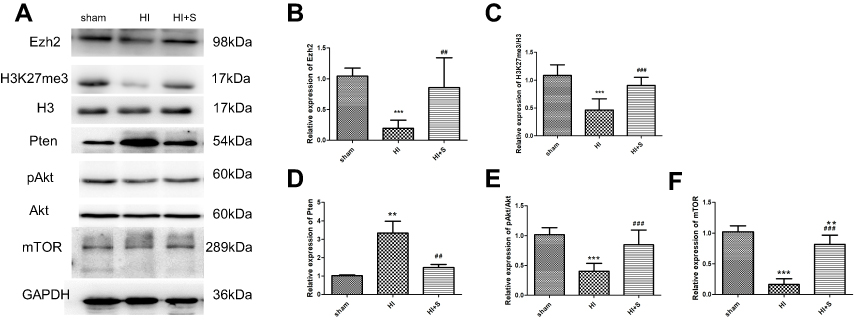 | Figure 3 The 2.5% SPC treatment for 30 mins reversed the HI-induced elevation of Pten, and the decrease in Ezh2, H3K27me3, pAkt/Akt, and mTOR expression 24 hrs post-HI. Representative western blots (A) and quantification of (B) Ezh2, (C) H3K27me3/H3, (D) Pten, (E) pAkt/Akt, and (F) mTOR values are presented as mean±SD (n=6/group); **P<0.01, and ***P<0.001 compared with the sham group; ##P<0.01, and ###P<0.001 compared with the HI group. Group 1: Sham (sham surgery, control), group 2: Sham + SPC (sham + S), group 3: HI, group 4: HI + SPC (HI + S), group 5: HI + SPC + rapamycin (HI + S + R), group 6: HI + rapamycin (HI + R), group 7: HI + SPC + GSK126 (HI + S + G), group 8: HI + GSK126 (HI + G).Abbreviations: SPC, sevoflurane post-conditioning; HI, hypoxic ischemia; Ezh2, Enhancer of zeste homolog 2; Pten, phosphatase and tensin homolog on chromosome 10. |
To further verify that Ezh2 affected the Pten/mTOR pathway during SPC-mediated regulation of autophagy following HIBI to neonatal rats, we injected GSK126, an Ezh2 inhibitor, into the left lateral cerebral ventricle 30 min before HI. GSK126 inhibits the catalytic site of Ezh2 and reduces H3K27 trimethylation. As expected, H3K27mes3 levels were down-regulated in the HI + S + G group compared to the HI + S group (Figure 4A and C, P<0.001). The Ezh2 levels did not differ between these two groups (Figure 4A, and B). Further analysis showed that the Pten level was upregulated and p-Akt and mTOR levels were downregulated in the HI + S + G group compared to the HI + S group (Figure 4A and D, P<0.001; Figure 4E, P<0.001; Figure 4F, P<0.001). Meanwhile, we observed that the dose of GSK126 that we injected into intra-cerebroventricular did not cause significant changes in Ezh2, H3K27me3, Pten level, and the downstream proteins (Akt, mTOR) in sham group rats (Figure S2). We also measured LC3B-II and Beclin1 levels and investigated autophagy in the CA3 region by immunofluorescence staining (Figure 5). The analysis showed that LC3B-II and Beclin1 levels were upregulated in the HI + S + G group compared to the HI + S group (Figure 5A and B, P<0.001; Figure 5C, P<0.05). The dose of GSK126 that we injected into intra-cerebroventricular did not significantly change LC3B-II and Beclin1 levels in sham group rats (Figure S3). LC3B/DAPI-labeled neurons exhibited punctate green LC3B expression in the cytoplasm with blue nuclei in the HI, HI + S + G, and HI + G groups. In contrast, the hippocampus of the sham and HI + S groups contained diffuse light green staining (Figure 5D). Collectively, these results suggest that SPC inhibited autophagy of the hippocampus via Ezh2-mediated regulation of the Pten/Akt/mTOR pathway.
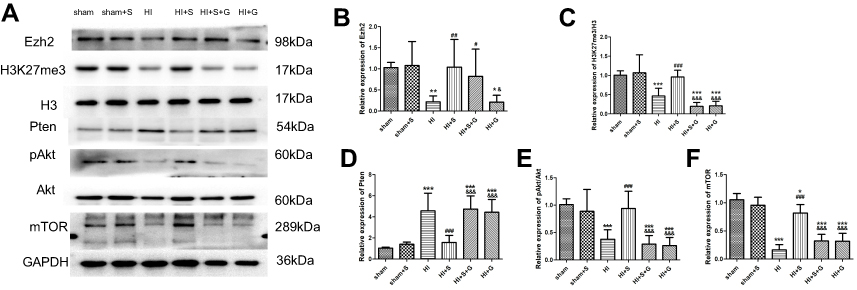 | Figure 4 The Ezh2 inhibitor GSK126 reversed the SPC-conferred increase in H3K27me3, pAkt/Akt, mTOR expression, and the decrease in Pten. Representative western blots (A) and quantification of (B) Ezh2, (C) H3K27me3/H3, (D) Pten, (E) pAkt/Akt, (F) mTOR values are presented as mean±SD (n=6/group); *P<0.05, **P<0.01, ***P<0.001 compared with the sham group; #P<0.05, ##P<0.01, P<0.001 compared with the HI group; &P<0.05, and &&&P<0.001 compared with the HI + S group. Group 1: Sham (sham surgery, control), group 2: Sham + SPC (sham + S), group 3: HI, group 4: HI + SPC (HI + S), group 5: HI + SPC + rapamycin (HI + S + R), group 6: HI + rapamycin (HI + R), group 7: HI + SPC + GSK126 (HI + S + G), group 8: HI + GSK126 (HI + G).Abbreviations: SPC, sevoflurane post-conditioning; HI, hypoxic ischemia; Ezh2, Enhancer of zeste homolog 2; Pten, phosphatase and tensin homolog on chromosome 10. |
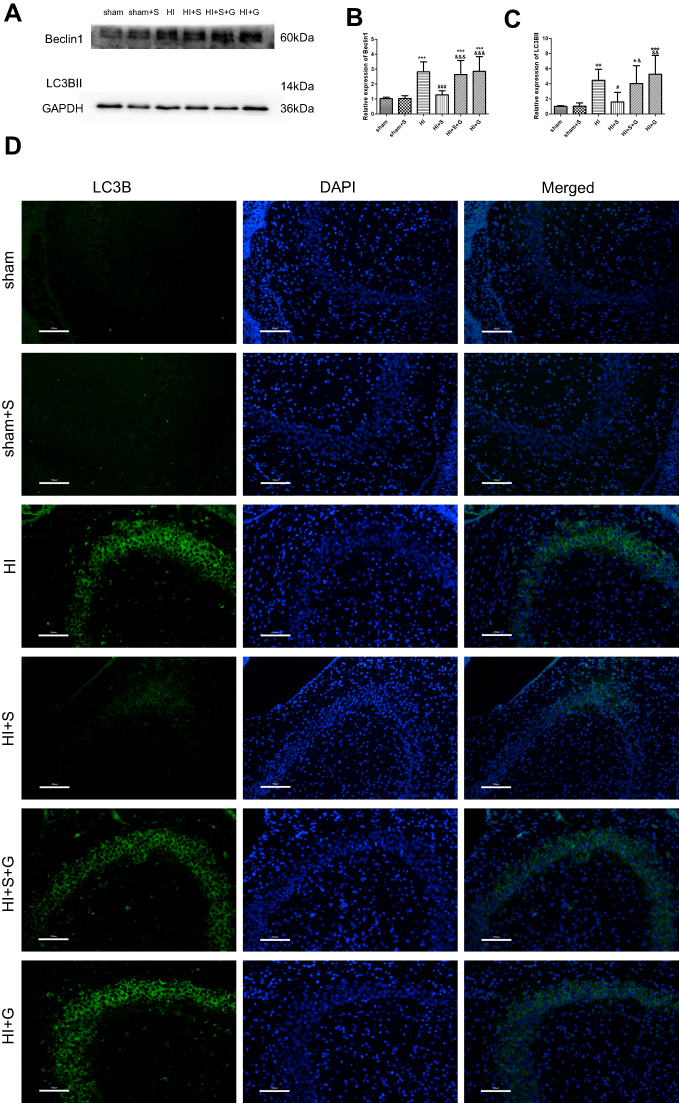 | Figure 5 GSK126 reverses the SPC-conferred decrease in Beclin1 and LC3B-II expression and attenuates HI-induced excessive autophagy in the CA3 hippocampal region 24 hrs post-HI. Representative western blots (A) and quantification of (B) Beclin1, (C) LC3B-II values are presented as mean±SD (n=6/group); *P<0.05, **P<0.01, and ***P<0.001 compared with the sham group; #P<0.05, and ###P<0.001 compared with the HI group; &P<0.05, &&P<0.01, and &&&P<0.001 compared with the HI + S group. One-way ANOVA with Newman-Keuls post-hoc test was used for the data analysis. (D) Representative immunofluorescent staining of LC3B. LC3B (green) showed punctate pattern in HI, HI + S + G and HI + G group, whereas sham and HI + S group presented diffused green light labeling, scale bar =100 μm. Group 1: Sham (sham surgery, control), group 2: Sham + SPC (sham + S), group 3: HI, group 4: HI + SPC (HI + S), group 5: HI + SPC + rapamycin (HI + S + R), group 6: HI + rapamycin (HI + R), group 7: HI + SPC + GSK126 (HI + S + G), group 8: HI + GSK126 (HI + G).Abbreviations: SPC, sevoflurane post-conditioning; HI, hypoxic ischemia. |
SPC improves long-term neurological outcomes via Ezh2 regulation
To further verify Ezh2-mediated SPC long-term neurological protection in neonatal rats after HI, the MWM test was performed to evaluate the spatial learning and memory of rat 34 d post-HI (Figure 6). As shown in Figure 6B, the escape latency of all groups showed a downward trend in the MWM test. Compared with the HI group, rats in the HI + S group took significantly less time to find the underwater platform in the second quadrant on days 4 and 5 (Figure 6B; day 4, P<0.05; day 5, P<0.05). GSK126 injection significantly prolonged the escape latency of the HI + S + G group compared to the HI + S group on days 3 to 5 (Figure 6B; day 3, P<0.01; day 4, P<0.01; day 5, P<0.001). In the probe test, rats in the HI + S + G group crossed the former platform location fewer times compared to the HI + S group (Figure 6D, P<0.01), and spent less time in the target quadrant (the second quadrant) (Figure 6C; P<0.05 versus the HI + S group). There were no differences between the HI + S + G, HI + G, and HI groups. There were also no differences in swimming speed in the probe test or the suspension time test performed before the MWM test to assess motor function in each group (Figure 6E and F). Representative tracings of the probe test for the groups are shown in Figure 6A. Rats in the HI + S + G, HI + G, and HI groups appeared to swim aimlessly (Figure 6A). Consistent with the behavioral results, neurons with increased intracellular space were scattered in an irregular arrangement in the hippocampus of the rats in the HI + S + G and HI groups (Figure 7A and B). The neuronal density in the CA3 region of the hippocampus and the weight ratio of the left to the right hemisphere were decreased in the HI + S + G group compared to that of the HI + S group (Figure 7C, P<0.001; Table 2, P<0.05). There were no differences between the neuro-density or weight ratios of the HI + S + G, HI + G, and HI groups.
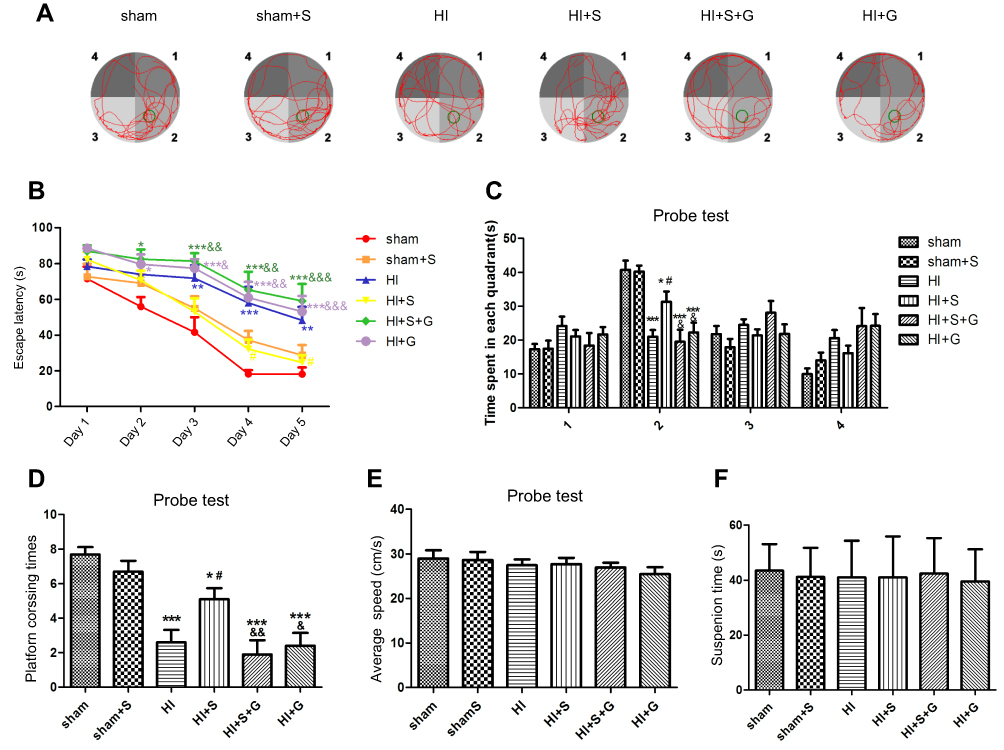 | Figure 6 SPC improves long-term neurological outcomes partly by regulating Ezh2. (A) Representative tracing way in probe test. (B) Escape latency in place trials evaluated the acquisition of spatial information. Values are presented as mean±SD (n=10/group). (C) Time spent in each quadrant and (D) platform crossing times in probe test evaluated the memory retention ability. (E) Swimming speed in probe test and (F) suspension time performed before MWM evaluated the motor function. Numbers indicate the four quadrants of MWM, and the second quadrant was the target quadrant. Values are presented as mean±SD (n=10/group); *P<0.05, **P<0.01, ***P<0.001 compared with sham group; #P<0.05 compared with HI group; &P<0.05, &&P<0.01, &&&P<0.001 compared with HI + S group. Group 1: Sham (sham surgery, control), group 2: Sham + SPC (sham + S), group 3: HI, group 4: HI + SPC (HI + S), group 5: HI + SPC + rapamycin (HI + S + R), group 6: HI + rapamycin (HI + R), group 7: HI + SPC + GSK126 (HI + S + G), group 8: HI + GSK126 (HI + G).Abbreviations: SPC, sevoflurane post-conditioning; HI, hypoxic ischemia; MWM, Morris water maze. |
 | Figure 7 SPC improves long-term neurological outcomes partly by regulating Ezh2. (A) Representative cerebral morphological graphs on day 34 post-HI. (B) Histological Nissil staining in CA3 region of hippocampus at day 34 after HI, scale bar =50μm. (C) Neuronal density ratio in CA3 region of hippocampus (n=9/group), values are presented as mean±SD; ***P<0.001 compared with the sham group; ###P<0.001 compared with the HI group; &&&P<0.001 compared with the HI + S group. Group 1: Sham (sham surgery, control), group 2: Sham + SPC (sham + S), group 3: HI, group 4: HI + SPC (HI + S), group 5: HI + SPC + rapamycin (HI + S + R), group 6: HI + rapamycin (HI + R), group 7: HI + SPC + GSK126 (HI + S + G), group 8: HI + GSK126 (HI + G).Abbreviations: SPC, sevoflurane post-conditioning; HI, hypoxic ischemia. |
Discussion
HIBI in neonates can lead to neuro-developmental disabilities.1,2 Many studies have shown that inhibition of autophagy in vivo and in vitro neonatal models of cerebral HI can provide neuroprotection.19–21,34,35 In this study, we found that: (1) 2.5% SPC administered for 30 mins immediately following HI protected against neonatal brain injury through the inhibition of over-activated autophagy in the hippocampus; (2) the Pten/Akt/mTOR pathway was involved in SPC-mediated neuroprotection in neonatal rats after HI; (3) the protection by SPC was through Ezh2, which worked as an epigenetic regulator and down-regulated Pten expression by catalyzing trimethylated histone3 at lys 27.
Previous studies have demonstrated that the volatile anesthetic sevoflurane confers neuroprotection against neonatal HIBI.13,14 SPC in this study was performed at 2.5% for 30 mins immediately after HI and was consistent with the conditions used by Lai.13 Ren et al demonstrated that 1% to 3% sevoflurane for 1 hr could induce the post-conditioning effect in HIBI neonatal rats.14 Xie et al found that the one minimum alveolar concentration (MAC) (the concentration in the lungs to prevent movement in 50% subjects in response to surgical stimuli) of sevoflurane was 2.64% in 7-day-old rats.30 Therefore, the concentration of sevoflurane in our study was similar to that used for neonates in the clinic. Taken together, clinical and subclinical doses of sevoflurane for a short exposure time could induce post-conditioning neuroprotection in neonatal rats after HI.
Autophagy occurs constitutively at a basal level to eliminate damaged or aged organelles and proteins through lysosomes, which maintains quality and energy balance. When over-activated autophagy is induced by stimuli (eg, HI), it is deleterious and contributes to neonatal brain injury.20–22,34,35 Our previous study revealed that HI in neonatal rats enhanced the autophagy flux, especially in CA3 region, and the increased LC3-II expression was due to the elevated formation of autophagosomes, not the blockade of lysosome degradation (a situation in which the autophagy substrates are not disposed of).21 Therefore, the autophagy markers LC3B-II and Beclin1 used in the current study reflected the extent of autophagy. SPC protected neonatal rats from HIBI by the inhibition of excessive autophagy, especially in the CA3 region of the hippocampus. As an important part of the hippocampus loop, only active neurons in the CA3 region receive input from both mature and immature neurons in the DG area and then become bound to each other through recurrent CA3 connection, which works as one part of “memory encoding”.36 In our study, when rapamycin was administered to SPC-treated pups, the extent of autophagy was increased at 24 hrs post-HI. At the same time, the neuronal density of the hippocampus at day 34 post-HI was decreased with increased intracellular space. The decreased neuronal density of the hippocampus in the rats 34 d post-HI was likely due to massive cell death induced by over-activated autophagy without sufficient compensation during the short period after HI. Thus, it was natural that rats with poor hippocampal morphology appeared aimless in the behavioral test (MWM). Interestingly, rapamycin did not increase the expression of autophagy markers or exacerbate injury when the HI + R group was compared with the HI group. Considering that our previous study showed that the autophagy flux marker gene reaches its expression peak 24 hrs post-HI in neonatal rats, autophagy may have reached its extreme, which needs further investigation. Collectively, SPC-inhibited over-activated autophagy played an important role in neuroprotection against neonatal HIBI.
Our results also suggest that components of the Ezh2-regulated Pten/Akt/mTOR pathway were under the regulation of SPC during the inhibition of autophagy. Ezh2, which is the active component of PRC2, could be upregulated by HIF-1α upon hypoxia treatment in mammalian cells.37 Volatile anesthetics, such as isoflurane, upregulate the expression of HIF-1α in vivo and in vitro.38–40 As sevoflurane and isoflurane are both halogenated hydrocarbon ethers, we hypothesized that sevoflurane could also upregulate Ezh2 by increasing HIF-1α in a hypoxic-ischemic environment. Ezh2 catalyzes trimethylated histone 3 at lys 27, which leads to transcriptional repression of downstream genes (eg, Pten, BDNF).41 Ezh2 plays a critical role in hippocampal development,23,26,42 and regulates autophagy through a mTOR-dependent pathway.33 Ezh2 expression regulates Pten in hippocampal learning and memory.26 Pten plays a key role in the regulation of autophagy in the developing brain and is critical for controlling cell death after ischemic brain injury.43,44 Its inhibition enhances GABAA expression and function against ischemic brain injury.45 Pten is a dual phosphatase that dephosphorylates both proteins and substrates and dephosphorylates PIP3 at the 3-OH position of the inositol ring to counteract PI3K.46 This process downregulates downstream Akt/mTOR signaling,47 which regulates cell growth, proliferation, and metabolism during mammalian CNS development,48 and is critical for memory consolidation, reconsolidation, storage, and retrieval processes.49 mTOR is the best-characterized regulator of autophagy. mTOR phosphorylates specific components of the multi-protein complex assembled during autophagosome formation, which inhibits activity of the complex and prevents activation of autophagy. As expected, SPC upregulated Ezh2 and H3K27me3 expression, and downregulated Pten/Akt/mTOR signaling in neonatal rats 24 hrs after HI, suggesting that Ezh2-regulated Pten/Akt/mTOR signaling might be involved in the SPC attenuation of neonatal HIBI. In further study, GSK126, an inhibitor of Ezh2 on H3K27me3, reversed the effects of SPC on H3K27me3, Pten/Akt/mTOR signaling and the autophagy markers LC3B-II and Beclin1. The reversal of H3K27me3 suggests that Ezh2 functions as an epigenetic regulator to some degree, which is consistent with the data of Wei et al showing that Ezh2 epigenetically regulates autophagy through an mTOR-dependent pathway.33 GSK126 also reversed SPC-mediated long-term neuroprotection, which is consistent with the hypothesis that excessive autophagy causes neurological impairment of learning and memory. Collectively, our results suggested that SPC confers neuroprotection against HIBI in neonatal rats through the regulation of autophagy by Ezh2 via the Pten/Akt/mTOR pathway.
There are a few limitations to our study. We did not observe the acute phase of cerebral injury after HI. Instead, we performed behavioral and morphological assessments 34 days after HI to evaluate the injury. Second, we focused only on the Pten/Akt/mTOR signaling pathway. We did not study other pathways that may be involved in this process. Further studies are needed to address these issues.
In conclusion, our study demonstrated that 2.5% sevoflurane post-conditioning for 30 mins conferred neuroprotection against HIBI in neonatal rats, which was due to the inhibition of overactivated autophagy in the hippocampus. The inhibition of autophagy was through Ezh2 suppression of Pten/Akt/mTOR signaling, which may represent a new mechanism for SPC-mediated neuroprotection against neonatal HIBI.
Abbreviations list
HIBI, hypoxic-ischemic brain injury; SPC, sevoflurane post-conditioning; CA, cornu ammonis; MWM, morris water maze; DG, dentate gyrus; CNS, central nervous system; MAC, minimum alveolar concentration.
Highlights
- As high as 2.5% sevoflurane post-conditioning for 30 mins provided neuroprotection of the hippocampus in neonatal rats after hypoxic ischemia.
- Sevoflurane post-conditioning conferred neuroprotection through the inhibition of over-activated autophagy in the hippocampus.
- The Pten/Akt/mTOR pathway was involved in sevoflurane post-conditioning conferred neuroprotection.
- Sevoflurane post-conditioning mediated neuroprotection through Ezh2, which functioned as an epigenetic regulator and down-regulated Pten expression by catalyzing trimethylated histone3 at lys 27.
Acknowledgments
This study was supported by the following grants: the National Natural Science Foundation of China (No. 81671311), the Outstanding Scientific Fund of Shengjing Hospital (No. 201708), and the Colleges and Universities Basic Research Project Fund of Liaoning Province (No. LQNK201709).
Disclosure
The authors report no conflicts of interest in this work.
References
1. Barkhuizen M, van Den Hove DL, Vles JS, Steinbusch HW, Kramer BW, Gavilanes AW. 25 years of research on global asphyxia in the immature rat brain. Neurosci Biobehav Rev. 2017;1(75):166–182. doi:10.1016/j.neubiorev.2017.01.042
2. Armstrong-Wells J, Bernard TJ, Boada R, Manco-Johnson M. Neurocognitive outcomes following neonatal encephalopathy. Neuro Rehabil. 2010;26:27–33.
3. Wang H, Chen Z, Li Y, Ji Q. NG25, an inhibitor of transforming growth factor‑β‑activated kinase 1, ameliorates neuronal apoptosis in neonatal hypoxic-ischemic rats. Mol Med Rep. 2018;17(1):1710–1716. doi:10.3892/mmr.2017.8024
4. Nabetani M, Shintaku H, Hamazaki T. Future perspectives of cell therapy for neonatal hypoxic-ischemic encephalopathy. Pediatr Res. 2018;83(1–2):356–363. doi:10.1038/pr.2017.260
5. Daadi MM, Davis AS, Arac A, et al. Human neural stem cell grafts modify microglial response and enhance axonal sprouting in neonatal hypoxic-ischemic brain injury. Stroke. 2010;41:516–523. doi:10.1161/STROKEAHA.109.572750
6. Azzopardi D, Strohm B, Marlow N, et al. Effects of hypothermia for perinatal asphyxia on childhood outcomes. New Engl J Med. 2014;371:140–149. doi:10.1056/NEJMoa1315788
7. Van Velthoven CTJ, Kavelaars A, van Bel F, Heijnen CJ. Mesenchymal stem cell transplantation changes the gene expression profile of the neonatal ischemic brain. Brain Behav Immun. 2011;25:1342–1348. doi:10.1016/j.bbi.2011.03.021
8. Zhang Z, Jyoti A, Balakrishnan B, et al. Trajectory of inflammatory and microglial activation markers in the postnatal rabbit brain following intrauterine endotoxin exposure. Neurobiol Dis. 2017;20:
9. Xu Y, Xue H, Zhao P, et al. Isoflurane postconditioning induces concentration- and timing-dependent neuroprotection partly mediated by the GluR2 AMPA receptor in neonatal rats after brain hypoxia-ischemia. J Anesth. 2016;30(3):427–436. doi:10.1007/s00540-015-2132-7
10. Zhao P, Zuo Z. Isoflurane preconditioning induces neuroprotection that is inducible nitric oxide synthase-dependent in neonatal rats. Anesthesiology. 2004;101(3):695–703.
11. Zhao P, Peng L, Li L, Xu X, Zuo Z. Isoflurane preconditioning improves long-term neurologic outcome after hypoxic-ischemic brain injury in neonatal rats. Anesthesiology. 2007;107(6):963–970. doi:10.1097/01.anes.0000291447.21046.4d
12. Zhao P, Ji G, Xue H, et al. Isoflurane postconditioning improved long-term neurological outcome possibly via inhibiting the mitochondrial permeability transition pore in neonatal rats after brain hypoxia-ischemia. Neuroscience. 2014;7(280):193–203. doi:10.1016/j.neuroscience.2014.09.006
13. Lai Z, Zhang L, Su J, Cai D, Xu Q. Sevoflurane postconditioning improves long-term learning and memory of neonatal hypoxia-ischemia brain damage rats via the PI3K/Akt-mPTP pathway. Brain Res. 2016;1630:25–37. doi:10.1016/j.brainres.2015.10.050
14. Ren X, Wang Z, Ma H, Zuo Z. Sevoflurane postconditioning provides neuroprotection against brain hypoxia-ischemia in neonatal rats. Neurol Sci. 2014;35(9):1401–1404. doi:10.1007/s10072-014-1726-4
15. Yu L, McPhee CK, Zheng L, et al. Termination of autophagy and reformation of lysosomes regulated by mTOR. Nature. 2010;465(7300):942–946. doi:10.1038/nature09076
16. Carloni S, Buonocore G, Balbuini W. Protective role of autophagy in neonatal hypoxia-ischemia induced brain injury. Neurobiol Dis. 2008;32:329–339. doi:10.1016/j.nbd.2008.08.010
17. Carloni S, Girelli S, Scopa C, Buonocore G, Longini M, Balduini W. Activation of autophagy and Akt/CREB signaling play an equivalent role in the neuroprotective effect of rapamycin in neonatal hypoxia-ischemia. Autophagy. 2010;6:366–377. doi:10.4161/auto.6.3.11261
18. Luo J. Autophagy and ethanol neurotoxicity. Autophagy. 2014;10(12):2099–2108. doi:10.4161/15548627.2014.981916
19. Xie C, Ginet V, Sun Y, et al. Neuroprotection by selective neuronal deletion of Atg7 in neonatal brain injury. Autophagy. 2016;12(2):410–423. doi:10.1080/15548627.2015.1132134
20. Koike M, Shibata M, Tadakoshi M, et al. Inhibition of autophagy prevents hippocampal pyramidal neuron death after hypoxic-ischemic injury. Am J Pathol. 2008;172(2):454–469. doi:10.2353/ajpath.2008.070876
21. Xu Y, Tian Y, Tian Y, Li X, Zhao P. Autophagy activation involved in hypoxic-ischemic brain injury induces cognitive and memory impairment in neonatal rats. J Neurochem. 2016;139(5):795–805. doi:10.1111/jnc.13851
22. Weis SN, Toniazzo AP, Ander BP, et al. Autophagy in the brain of neonates following hypoxia-ischemia shows sex- and region-specific effects. Neuroscience. 2014;3(256):201–209. doi:10.1016/j.neuroscience.2013.10.046
23. Henriquez B, Bustos FJ, Aguilar R, et al. Ezh1 and Ezh2 differentially regulate PSD-95 gene transcription in developing hippocampal neurons. Mol Cell Neurosci. 2013;57:130–143. doi:10.1016/j.mcn.2013.07.012
24. He D, Wang J, Lu Y, et al. lncRNA functional networks in oligodendrocytes reveal stage-specific myelination control by an lncOL1/Suz12 complex in the CNS. Neuron. 2017;93(2):362–378. doi:10.1016/j.neuron.2016.11.044
25. Zemke M, Draganova K, Klug A, et al. Loss of Ezh2 promotes a midbrain-to-forebrain identity switch by direct gene derepression and Wnt-dependent regulation. BMC Biol. 2015;13:103. doi:10.1186/s12915-015-0210-9
26. Zhang J, Ji F, Liu Y, et al. Ezh2 regulates adult hippocampal neurogenesis and memory. J Neurosci. 2014;34(15):5184–5199. doi:10.1523/JNEUROSCI.4129-13.2014
27. Ma H, Guo R, Yu L, Zhang Y, Ren J. Aldehyde dehydrogenase 2 (ALDH2) rescues myocardial ischaemia/reperfusion injury: role of autophagy paradox and toxic aldehyde. Eur Heart J. 2011;32(8):1025–1038. doi:10.1093/eurheartj/ehq253
28. Ning L, Guo-Chun Z, Sheng-Li A, et al. Inhibition of autophagy induced by PTEN loss promotes intrinsic breast cancer resistance to trastuzumab therapy. Tumour Biol. 2016;37(4):5445–5454. doi:10.1007/s13277-015-4392-0
29. Rice JE, Vannucci RC, Brierley JB. The influence of immaturity on hypoxic-ischemic brain damage in the rat. Ann Neurol. 1981;9(2):131–141. doi:10.1002/ana.410090206
30. Xie SN, Ye H, Li JF, An LX. Sevoflurane neurotoxicity in neonatal rats is related to an increase in the GABAA R α1/GABAA R α2 ratio. J Neurosci Res. 2017;95(12):2367–2375. doi:10.1002/jnr.24118
31. Galluzzi L, Baehrecke EH, Ballabio A, et al. Molecular definitions of autophagy and related processes. Embo J. 2017;36(13):1811–1836. doi:10.15252/embj.201796697
32. Kihara A, Kabeya Y, Ohsumi Y, Yoshimori T. Beclin-phosphatidylinositol 3-kinase complex functions at the trans-Golgi network. EMBO Rep. 2001;2(4):330–335. doi:10.1093/embo-reports/kve061
33. Wei FZ, Cao Z, Wang X, et al. Epigenetic regulation of autophagy by the methyltransferase EZH2 through an MTOR-dependent pathway. Autophagy. 2015;11(12):2309–2322. doi:10.1080/15548627.2015.1117734
34. Hu Y, Wang Z, Y L, et al. Melatonin reduces hypoxic-ischaemic (HI) induced autophagy and apoptosis: an in vivo and in vitro investigation in experimental models of neonatal HI brain injury. Neurosci Lett. 2017;653:105–112. doi:10.1016/j.neulet.2016.11.050
35. Zhao F, Qu Y, Zhu J, et al. miR-30d-5p plays an important role in autophagy and apoptosis in developing rat brains after hypoxic-ischemic injury. J Neuropathol Exp Neurol. 2017;76(8):709–719. doi:10.1093/jnen/nlx052
36. Aimone JB, Deng W, Gage FH. Resolving new memories: a critical look at the dentate gyrus, adult neurogenesis, and pattern separation. Neuron. 2011;70(4):589–596. doi:10.1016/j.neuron.2011.05.010
37. Chang CJ, Yang JY, Xia W, et al. EZH2 promotes expansion of breast tumor initiating cells through activation of RAF1-β-catenin signaling. Cancer Cell. 2011;19(1):86–100. doi:10.1016/j.ccr.2010.10.035
38. Benzonana LL, Perry NJ, Watts HR, et al. Isoflurane, a commonly used volatile anesthetic, enhances renal cancer growth and malignant potential via the hypoxia-inducible factor cellular signaling pathway in vitro. Anesthesiology. 2013;119(3):593–605. doi:10.1097/ALN.0b013e31829e47fd
39. Li QF, Wang XR, Yang YW, Su DS. Up-regulation of hypoxia inducible factor 1alpha by isoflurane in Hep3B cells. Anesthesiology. 2006;105(6):1211–1219.
40. Yan W, Chen Z, Chen J, Chen H. Isoflurane preconditioning protects rat brain from ischemia reperfusion injury via up-regulating the HIF-1α expression through Akt/mTOR/s6K activation. Cell Mol Biol (Noisy-Le-Grand). 2016;62(2):38–44.
41. Koo JW, Mazei-Robison MS, LaPlant Q, et al. Epigenetic basis of opiate suppression of Bdnf gene expression in the ventral tegmental area. Nat Neurosci. 2015;18(3):415–422. doi:10.1038/nn.3932
42. Feng X, Juan AH, Wang HA, Ko KD, Zare H, Sartorelli V. Polycomb Ezh2 controls the fate of GABAergic neurons in the embryonic cerebellum. Development. 2016;143(11):1971–1980. doi:10.1242/dev.132902
43. Li X, Wu Z, Zhang Y, Xu Y, Han G, Zhao P. Activation of autophagy contributes to sevoflurane-induced neurotoxicity in fetal rats. Front Mol Neurosci. 2017;10:432. doi:10.3389/fnmol.2017.00432
44. Zhang ZF, Chen J, Han X, et al. Bisperoxovandium (pyridin-2-squaramide) targets both PTEN and ERK1/2 to confer neuroprotection. Br J Pharmacol. 2017;174(8):641–656. doi:10.1111/bph.13727
45. Liu B, Li L, Zhang Q, et al. Preservation of GABAA receptor function by PTEN inhibition protects against neuronal death in ischemic stroke. Stroke. 2010;41(5):1018–1026. doi:10.1161/STROKEAHA.110.579011
46. Hollander MC, Blumenthal GM, Dennis PA. PTEN loss in the continuum of common cancers, rare syndromes and mouse models. Nat Rev Cancer. 2011;11:289–301. doi:10.1038/nrc3037
47. Aoki M, Fujishita T. Oncogenic roles of the PI3K/AKT/mTOR axis. Curr Top Microbiol Immunol. 2017;407:153–189. doi:10.1007/82_2017_6
48. Ryskalin L, Lazzeri G, Flaibani M, et al. mTOR-dependent cell proliferation in the brain. Biomed Res Int. 2017;2017:7082696. doi:10.1155/2017/7082696
49. Neasta J, Barak S, Hamida SB, Ron D. mTOR complex 1: a key player in neuroadaptations induced by drugs of abuse. J Neurochem. 2014;130(2):172–184. doi:10.1111/jnc.12725
Supplementary materials
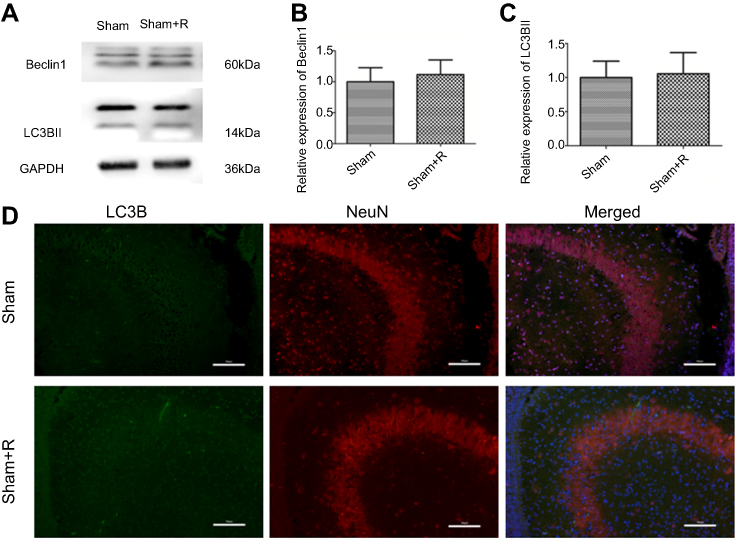 | Figure S1 Autophagy markers expression levels in sham and sham + R groups. Representative western blots (A) and quantification of (B) Beclin1 and (C) LC3B-II, values are presented as mean±SD (n=6/group). (D) Representative immunofluorescent staining of LC3B (green) with NeuN (red) in hippocampus, scale bar =100 μm. |
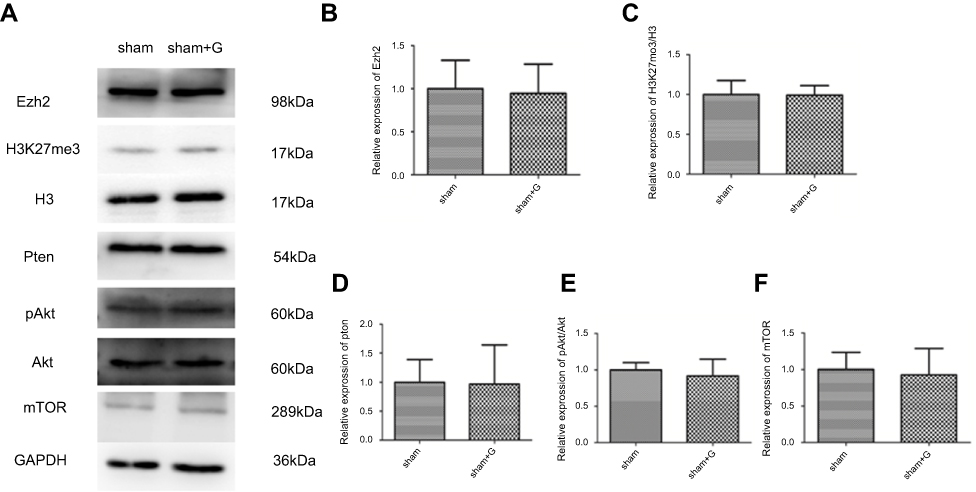 | Figure S2 Expression levels of Ezh2 regulated Pten/Akt/mTOR pathway in sham and sham + G groups. Representative western blots (A) and quantification of (B) Ezh2 (C) H3K27me3/H3 (D) Pten, (E) pAkt/Akt, and (F) mTOR, values are presented as mean±SD (n=6/group). |
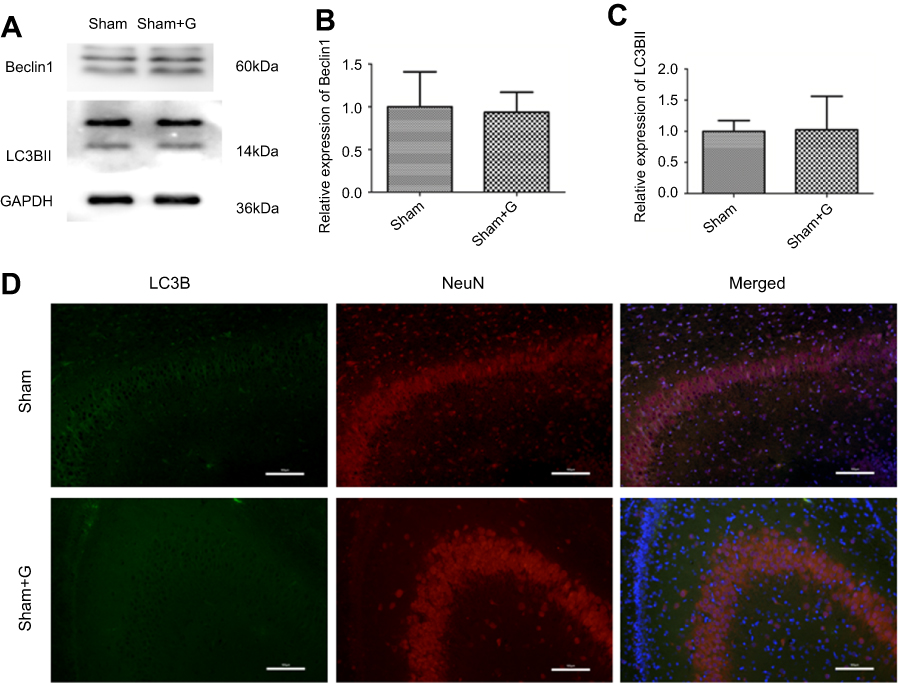 | Figure S3 Autophagy markers expression levels in sham and sham + G groups. Representative western blots (A) and quantification of (B) Beclin1 and (C) LC3B-II, values are presented as mean±SD (n=6/group). (D) Representative immunofluorescent staining of LC3B (green) with NeuN (red) in hippocampus, scale bar =100 μm. |
 © 2019 The Author(s). This work is published and licensed by Dove Medical Press Limited. The
full terms of this license are available at https://www.dovepress.com/terms
and incorporate the Creative Commons Attribution
- Non Commercial (unported, 3.0) License.
By accessing the work you hereby accept the Terms. Non-commercial uses of the work are permitted
without any further permission from Dove Medical Press Limited, provided the work is properly
attributed. For permission for commercial use of this work, please see paragraphs 4.2 and 5 of our Terms.
© 2019 The Author(s). This work is published and licensed by Dove Medical Press Limited. The
full terms of this license are available at https://www.dovepress.com/terms
and incorporate the Creative Commons Attribution
- Non Commercial (unported, 3.0) License.
By accessing the work you hereby accept the Terms. Non-commercial uses of the work are permitted
without any further permission from Dove Medical Press Limited, provided the work is properly
attributed. For permission for commercial use of this work, please see paragraphs 4.2 and 5 of our Terms.