Back to Journals » Clinical, Cosmetic and Investigational Dermatology » Volume 16
Serum Proteomics Combined with Metabolomics Analysis Explore the Molecular Biological Characteristics of Eruptive Syringoma
Authors Wang Z ![]() , Liu M
, Liu M ![]() , Lei H, Lei P, Liu X
, Lei H, Lei P, Liu X ![]() , Zhang J, Xiao S
, Zhang J, Xiao S ![]() , Zheng Y, Feng YG
, Zheng Y, Feng YG
Received 4 November 2022
Accepted for publication 14 December 2022
Published 5 January 2023 Volume 2023:16 Pages 17—26
DOI https://doi.org/10.2147/CCID.S393620
Checked for plagiarism Yes
Review by Single anonymous peer review
Peer reviewer comments 2
Editor who approved publication: Dr Anne-Claire Fougerousse
Ziyang Wang,1,2 Meng Liu,1,2 Hao Lei,1,2 Panpan Lei,3 Xinyi Liu,1,2 Jing Zhang,1,2 Shengxiang Xiao,2 Yan Zheng,1,2 Yi-Guo Feng2
1Department of Dermatology, the First Affiliated Hospital of Xi’an Jiaotong University, Xi’an, People’s Republic of China; 2Department of Dermatology, the Second Affiliated Hospital of Xi’an Jiaotong University, Xi’an, People’s Republic of China; 3Center for Mitochondrial Biology and Medicine, The Key Laboratory of Biomedical Information Engineering of Ministry of Education, Xi’an Jiaotong University School of Life Science and Technology, Xi’an, People’s Republic of China
Correspondence: Yi-Guo Feng, Department of Dermatology, the Second Affiliated Hospital of Xi’an Jiaotong University, School of Medicine, Xi’an, 730070, People’s Republic of China, Email [email protected]
Background: Eruptive syringoma (ES) is a clinical variant of the appendageal tumor syringoma. Around 75% of ES arise in the head or neck, which makes them unsightly. ES is common in patients with amyloidosis, diabetes, and Down’s syndrome, suggesting that it may be associated with potential systemic effects. ES is a rare tumor with the unclear pathogenesis and no effective treatment.
Methods: A PubMed search of ES was conducted. Plasma samples of patients with ES were acquired from the Department of Dermatology at Xi’an Jiaotong University’s Second Affiliated Hospital. After removing highly abundant proteins, plasma samples were subjected to proteomics and metabolomics analysis using liquid chromatography-tandem mass spectrometry (LC-MS/MS).
Results: LC-MS/MS revealed 71 differentially expressed proteins and 18 differentially abundant metabolites. The functional analysis highlighted the importance of complement binding, coagulation, secretory granules and vesicle lumen. Further, the study revealed 15 hub genes associated with FGG, GC, APOE, FGA, FGB, C4A, C3, CRP, C4B, FLNA, TAGLN2, ANXA5, MYL6, MYL12B, and TLN1 organized into three clusters. The seed genes in each cluster were GC, FLNA, and MYL6. In addition, glycol metabolism was associated with variable abundance of serum metabolites, which explains the relatively high rate of ES among diabetics.
Conclusion: This study suggests that immunological inflammation and tumor glycol metabolism may play significant role in the pathophysiology of ES.
Keywords: eruptive syringomas, proteomics and metabolomics analysis, complement and coagulation cascades, glycol-metabolism
Introduction
Eruptive syringoma (ES) is a rare clinical variant of syringoma which originates intraepidermally in sweat ducts. The ES lesions are small, flat-topped papules with skin-colored or light pigmentation. The histopathologic diagnosis of ES is based on the presence of multiple cystic exocrine ducts with comma-shaped tails in the dermis.1
Around 75% of ES can arise in the head or neck,2 which makes them unsightly. Currently no drug is approved for ES. Further, surgical therapies are ineffective due to the location of ES and the high risk of recurrence.3 However, the pathophysiology of ES remains an enigma. ES has been described eccrine duct reactive hyperplasia in response to inflammation than as real neoplasms.4–6 ES is common in patients with amyloidosis, diabetes, and Down’s syndrome, so it may be a systemic effect.7 Unfortunately, ES has never been studied at the protein or metabolic level. Hence, we performed serum proteomics and metabolomics analyses to identify the ES biomarkers.
Materials and Methods
Select Clinical Samples
Patient plasma samples (Table 1) of ES, were collected from the Department of Dermatology at the Second Affiliated Hospital of Xi’an Jiaotong University. The diagnosis of all samples was determined by two experienced pathologists (Figure 1). Normal plasma tissues (Table 1) were obtained from physical examination center at the Second Affiliated Hospital of Xi’an Jiaotong University. Subjects with comorbidities that needed medical attention were excluded from the study. Written informed consent was obtained from all patients, and ethics approval was obtained from the Institutional Ethics Committee of Xi’an Jiaotong University. The studies were conducted in accordance with Declaration of Helsinki guidelines.
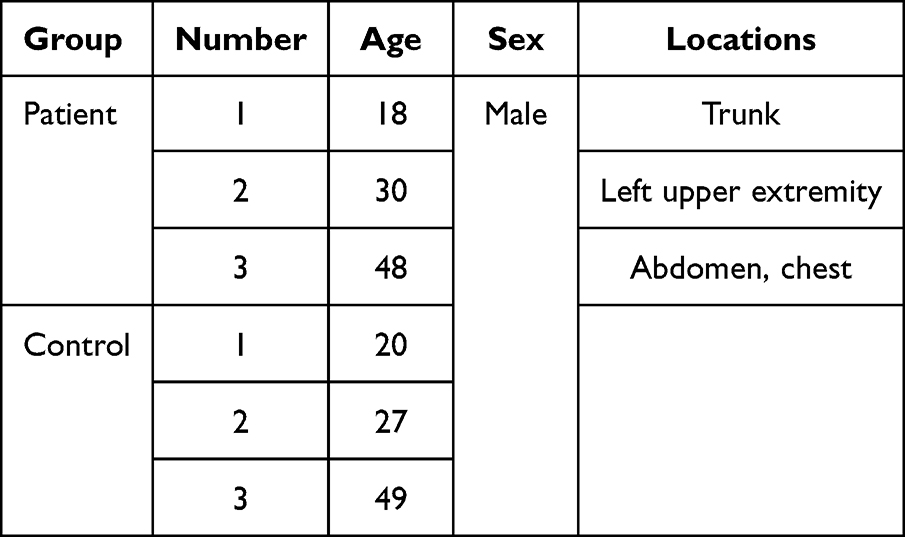 |
Table 1 Clinicopathological Features of Patients |
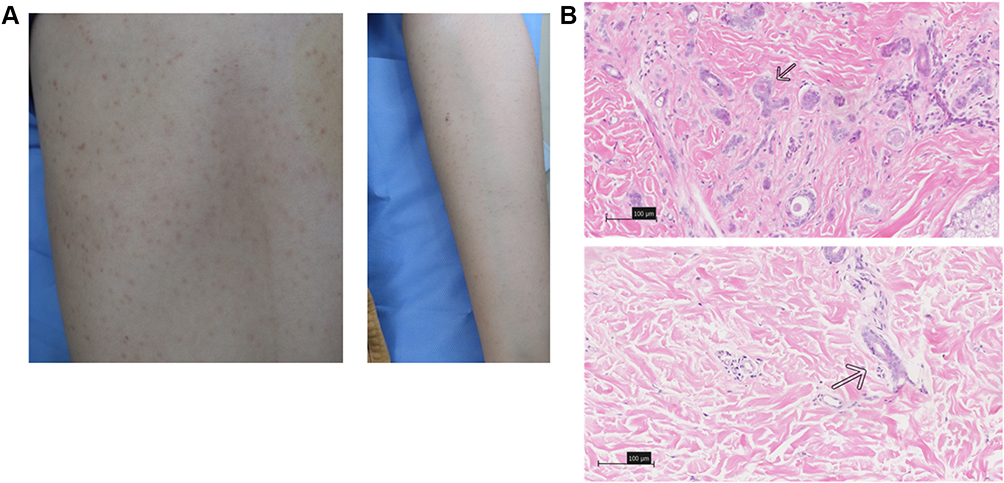 |
Figure 1 The clinical and pathological pictures of the patients. (A) Widely distributed flesh-coloured papules on the forebreast and left upper extremity region. (B) Micrographs showed that the dermis was filled with multiple vessels embedded in the dense collagen stroma; the inner layer of the duct is lined with flattened epithelial cells with a comma-like appearance (H&E; Bar length =100 μm; arrows indicate the comma-like appearance of eruptive syringoma). |
High-Abundance Proteins Depletion
In order to augment the detection and identification of low-abundance proteins, we used TOP 12 abundant proteins depletion columns (Thermo/PierceTM, 85,164, Thermo Fisher Scientific, Waltham, MA, USA) to remove the twelve most abundant proteins in serum, like HSA and IgG. The columns were used according to the manufacturer’s instructions.
Proteomic Analysis (LC-MS/MS)
LC-MS/MS analysis was conducted using an Orbitrap Q-Exactive Plus mass spectrometer (Thermo Fisher Scientific, USA) at the Instrument Analysis Center of Xi’an Jiaotong University. The peptide fragments were dissolved in solvent before separation using an Acquity UPLCBEHC (18) column (100 2.1mm, 1.7μm) (Waters, USA). The mobile phase was 0.1% formic acid solution (A)-0.1% formic acid acetonitrile (B) used for gradient elution.
The MS spectra were collected using a data dependent scanning program in the Orbitrap mass analyzer with an automatic gain control (AGC) target of 1E6, and a maximum ion accumulation time (IT) of 50 ms. For electrospray, the scan range was 80 to 1200 m/z with 70,000 resolutions. Further, the most intense ions from the full scan were isolated with an isolation width of 3.0 m/z with 17,500 resolutions. The dynamic exclusion time of tandem mass spectrometry scanning was set to 10.0 s to prevent reacquisition of parent ions spectra.
Mass spectrometry data were analyzed by MaxQuant (v.1.5.2.8 http://www.maxquant.org/). Retrieval parameter setting: the database adds an anti-database to UniProt Homo sapiens to calculate the false positive rate (FDR) caused by random matching. The FDR of protein identification and PSM identification were set to 1%.
Sample Preparation for Metabolomics Analysis
For every 40ul serums, 160ul of extraction solvent was used; solvent was composed of 1:1 of organic mixture (1:1 ACN/Methanol). The samples were gently vortexed for 2 min, placed for one hour at −20°C, centrifuged with 13,000 rpm at 4◦C for 15 min. Supernatant was concentrated after centrifugation, then frozen at −80°C and freeze-dried. The powder was dissolved with 100uL 30% ACN, and the dissolving solution was then used for LC-MS/MS analysis.
Untargeted Metabolomics Analysis (LC-MS/MS)
The untargeted metabolomics analysis on serum obtained was performed using an Orbitrap Q-Exactive Plus mass spectrometer (Thermo Fisher Scientific, USA) at the Instrument Analysis Center of Xi’an Jiaotong University. A gradient flow method with a 200ul/min flow rate was used (5% B for 2 minutes, 20% B for 4 minutes, 50% B for 6 minutes, 80% B for 4 minutes, 100% B for 4 minutes). Comparisons of normally distributed data consisting of two groups with equal variances (F-test equality of variance P > 0.05) were analyzed using Student’s t-test, and unequal variances (F-test equality of variance P < 0.05) using Two-tailed t-tests. KEGG and MetaboAnalyst were applied for further analysis.
Enrichment Analysis of Differentially Expressed Proteins
R Package “clusterProfiler” was used to perform GO and KEGG pathway enrichment analysis. The GO analysis includes cellular component (CC), biological process (BP) and molecular function (MF). R Package “ggplot2” was used for visualization. R version is 3.6.3.
PPI Network Construction and Module Analysis
Search Tool for the Retrieval of Interacting Genes (STRING; http://stringdb.org; Version 11.5) can search for the relationship between proteins of interest, such as direct binding relationships, or coexisting upstream and downstream regulatory pathways, to construct a PPI network (protein-protein interaction network) with complex regulatory relationships. Interactions with a combined score over 0.4 were considered statistically significant. Cytoscape (http://www.cytoscape.org) (version 3.9.1) was used to visualize this PPI network. Cytoscape’s plug-in molecular complex detection technology (MCODE) was used to analyze key functional modules. Set the selection criteria as: K-core = 2, degree cutoff = 2, max depth = 100, and node score cutoff = 0.2.
Interaction Network Analysis Among Metabolites
The “Joint-Pathway Analysis” module of MetaboAnalyst 5.0 was utilized for this. For the interaction analysis among metabolites based on input from both genes and metabolite data, the “Metabolite-metabolite interaction network” sub-module with default parameters was utilized.
Interaction Network Analysis Among Genes and Metabolites
We subsequently combined an integrative analysis of our earlier proteomics and metabolomics data for this investigation. The “All pathways (gene alone)”, “Metabolic pathways (metabolites only)”, “All pathways (integrated)”, and “Metabolic pathways integrated” sub-modules were used in the first round of study. The default configurations were kept, including the integration strategy of “Combined queries”, the topology measure of “Degree centrality”, and the enrichment analysis based on the “Hypergeometric test”. For each analysis, dot plots, tables of pathway outcomes, and matched features were saved and downloaded. The “All pathways (integrated)” module was also utilized to visualize the network of pathways and their enriched features.
Results
A Review of the Literature Regarding Immune Reaction in ESs
According to previous literature, 16 cases discussed in this paper in order to present the connection between ES and immune response. Eight cases demonstrated that dermatitis/eczema,4,6,8 prurigo nodularis,9 pigmented urticaria,10 vitiligo,11 and other reactive inflammatory processes including depilation8/radiation12 preceded ES (Supplementary Table 1). It is noteworthy that most of these locations overlap with inflammatory illness. Organ transplants13,14 or anti-epileptic medicines15,16 were the cause of 4 patients (Supplementary Table 1). In 4 cases of ES,4,17–19 there were signs of pathology associated with immunological response, such as a significant increase of mast cells in the interstitial connective tissue or a conspicuous infiltration of CD4+ and CD8+ T cells (Supplementary Table 2). In addition, 1 instance was successfully treated with topical adelmidrol20 (Supplementary Table 2).
Identification of Differentially Expressed Proteins and Enrichment Analysis
A total of 635 proteins were detected by LC-MS/MS, and 71 proteins exhibited significant differences, of which 40 proteins were up-regulated and 31 were down-regulated.
GO and KEGG Pathway enrichment analyses were used to examine biological functions and pathways. Wherein. GO analysis results reveal these genes were mainly enriched in complement binding, coagulation function, secretory granule and vesicle lumen, etc (Figure 2). In terms of KEGG Pathway, the 4 significant enrichment pathways are platelet activation, complement and coagulation cascades, shigellosis and staphylococcus aureus infection (Figure 3). These results strongly indicate that inflammatory and coagulation pathway are partially involved in the development of ES.
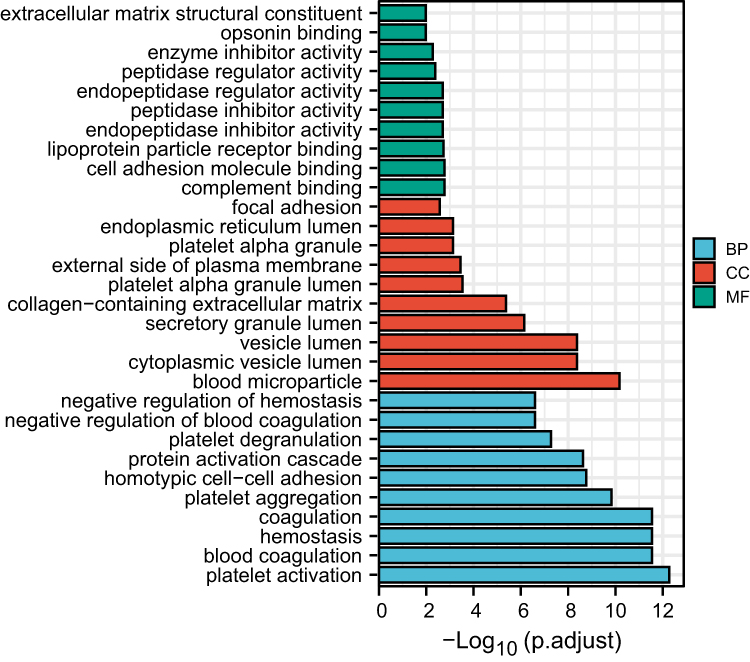 |
Figure 2 GO analysis of biological processes (BP), cellular component (CC) and molecular functions (MF). |
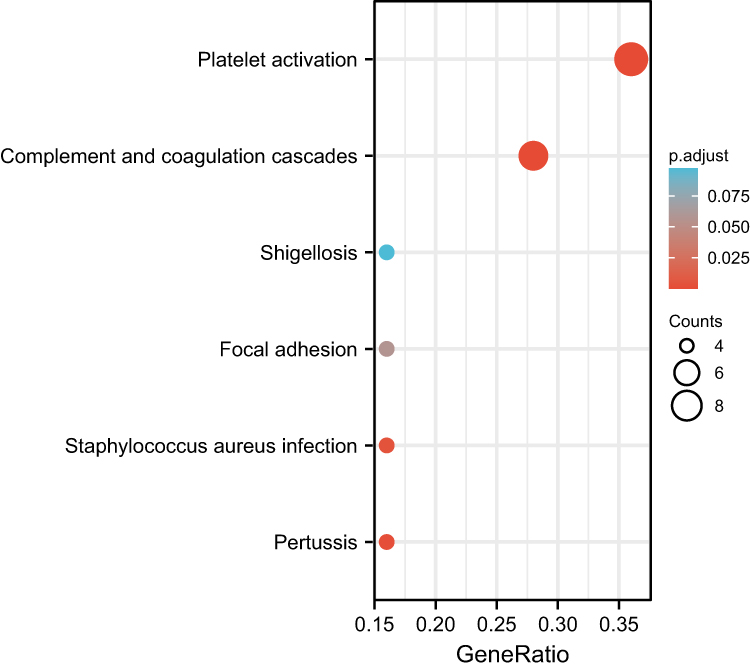 |
Figure 3 The results of the first 6 classifications in KEGG were given in the bubble diagram. |
The Analysis of PPI Network and Hub Genes
The PPI network of the DEGs with combined scores greater than 0.4 was constructed using Cytoscape (red indicated up-regulated, green was down-regulated) (Figure 4). Three closely connected gene modules were obtained through MCODE plug-in of Cytoscape, including 15 hub DEGs (Supplementary Figures 1–3). They are FGG, GC, APOE, FGA, FGB, C4A, C3, CRP, C4B, FLNA, TAGLN2, ANXA5, MYL6, MYL12B, TLN1. For each gene cluster, the seed genes are GC, FLNA and MYL6.
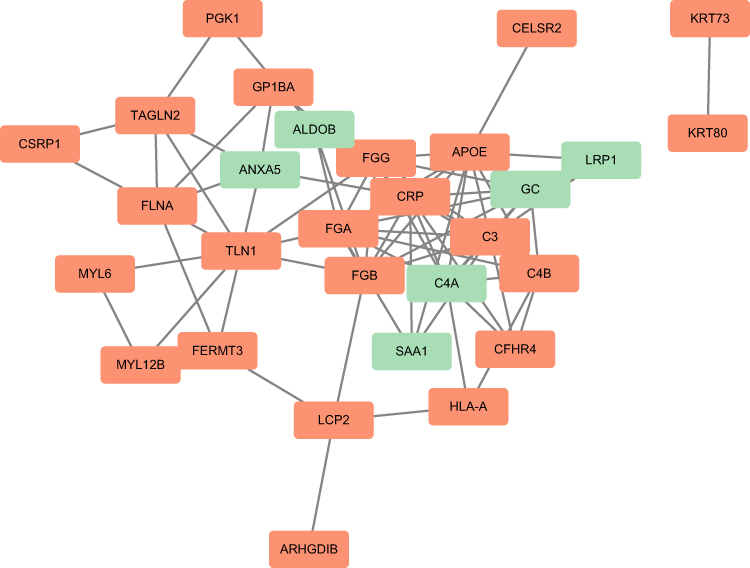 |
Figure 4 The PPI network of the DEGs. |
Changes in Serum Metabolites Detected by Metabolomics
The initial data analysis revealed excellent stability and reproducibility in our current metabolomics data set (Figure 5A) by using Principal Component Analysis (PCA). As a result, 19 metabolites showing significant differences in the plasma of ES were identified (Figure 5B). Three of these metabolites increased in the patients, whereas the remainder decreased. Based on the KEGG database, a collaborative interaction network of metabolites such as benzamide, phthalic acid, phytosphingosine, and D-tryptophan is shown (Figure 6).
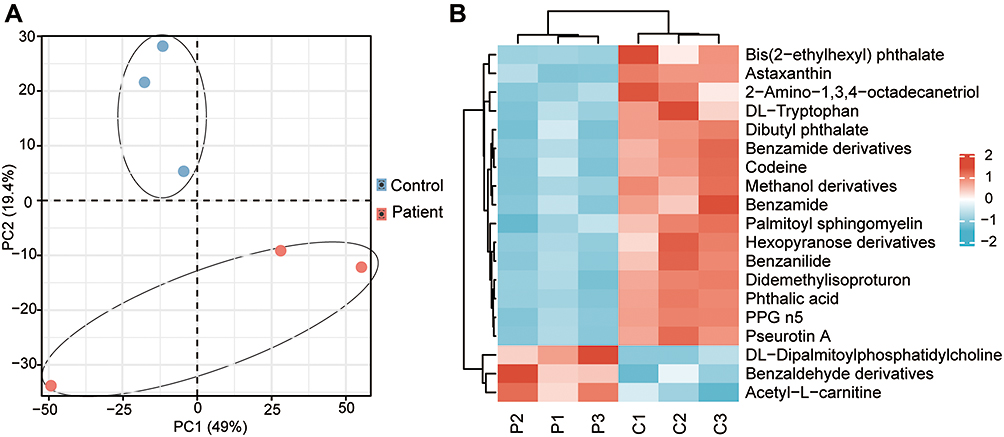 |
Figure 5 Changes in serum metabolites detected by untargeted metabolomics. (A) PCA analysis of all samples. (B) A heatmap of 19 metabolites. |
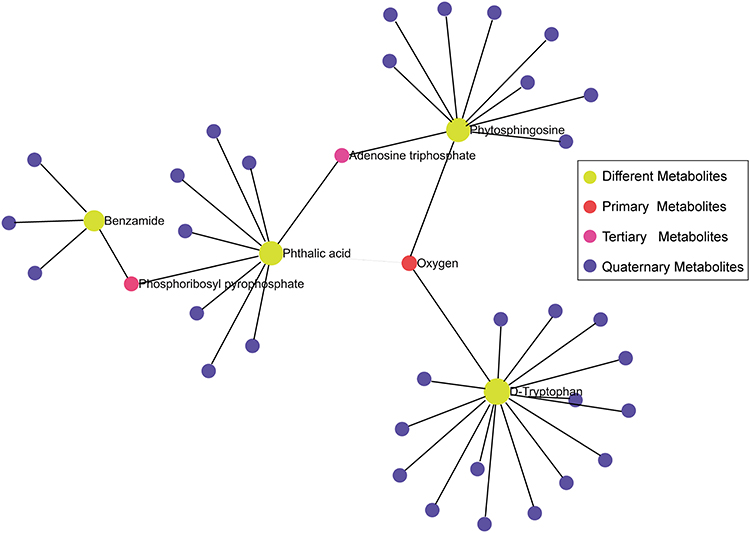 |
Figure 6 A collaborative interaction network of metabolites. |
Interaction Network Analysis Among Proteomics and Metabolomics Data
Analysis of all pathways (gene only) (Figure 7A) and metabolic pathways (metabolites only) (Figure 7B) dig up that major enriched pathways were composed of glycolysis or gluconeogenesis, cholesterol metabolism, and sphingolipid metabolism. Metabolic Pathways integrated analysis (Figure 7C) found out that glucose metabolic pathways were enriched, such as different types of N-glycan biosynthesis, fructose and mannose metabolism, and pentose phosphate pathway. A combined study of all pathway (Figure 7D) also highlights these key pathways.
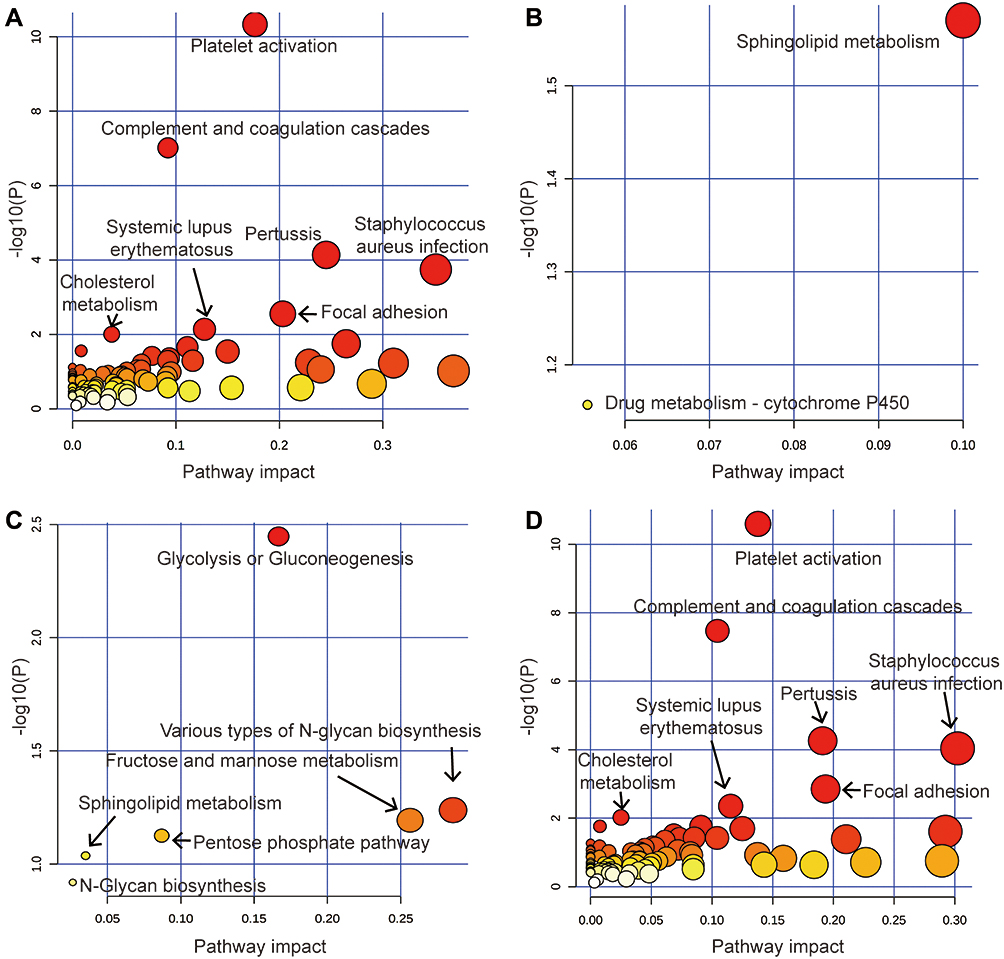 |
Figure 7 Dot plots are used to illustrate the pathway enrichment of significantly differentially expressed genes. (A) All pathway-gene only, (B) Metabolic pathways-metabolite only, (C) Metabolic pathways-integrated, (D) All pathways-integrated. |
Discussion
ES has a complex pathophysiology, making diagnosis and therapy difficult. In order to increase the precision of diagnosis and develop effective therapy, it is necessary to identify a number of biomarkers to elucidate the molecular basis of this illness. A literature review revealed a close relationship between the immune system and ES. Topical drugs with anti-inflammatory properties, such as adelmidrol, also demonstrated potential therapeutic efficacy.
The proteomics analysis of ES yielded 71 significant proteins compared with the control group. Most proteins were functionally related to complement binding, coagulation activity, secretory granules, and vesicle lumen. A KEGG study revealed that several pathways, particularly complement and coagulation cascades, were crucial for the development of ES. A crosstalk was detected between complement and coagulation cascades in cancer, septicemia, endometriosis and other diseases.21 Additionally, we found an abnormal expression of the central complement factors (C4B, GC, C3, and C4A) in ES, suggesting that the ES pathogenesis may be associated with the abnormal status of complements. Human complement C4 is a complex and diverse protein. The deficiency of C4A plays an important role in systemic lupus erythematosus (SLE) pathogenesis and manifestations in East Asian and European populations.22 Interestingly, C4A is down-regulated in the serum of patients with ES, suggesting that C4A down regulation may increase the risk of ES. Meanwhile, we found a hypercoagulable condition in patients with ES due to enhanced platelet activation, complement, and coagulation cascades.
Over the past decades, tumor immunotherapy has emerged as a viable treatment option. Monoclonal antibodies against tumor-associated antigens and non-specific stimulation of the immune system have been used in immunotherapy.23 The study revealed 15 hub genes associated with FGG, GC, APOE, FGA, FGB, C4A, C3, CRP, C4B, FLNA, TAGLN2, ANXA5, MYL6, MYL12B, and TLN1 organized into three clusters. The seed genes in each cluster were GC, FLNA, and MYL6. During active inflammation, GC (vitamin D-binding protein), which is involved in vitamin D transport and storage, increases the chemotactic activity of C5 alpha for neutrophils.24 Patients with psoriasis carry higher levels of serum vitamin D-binding protein compared with healthy controls, and the plasma vitamin D levels of patients before the start of treatment can be used to predict therapeutic efficacy.25 These findings imply that GC may contribute to disease and predict the outcome of therapy. The actin-binding protein FLNA (filamin A) regulates signal transduction which is important for cell locomotion. FLNA is highly expressed in various diseases like cervical cancer,26 seizures, atherosclerosis27 and so on. Specifically, the genetic inactivation of FLNA resulted in decreased atherosclerosis in mice, indicating that medications targeting FLNA may be effective in treating tumors and hypercoagulability.27 In our results, FLNA is up-regulated and belongs to the central hub genes. The protein-coding gene MYL6 (myosin light chain 6) encodes a myosin light chain. Analysis of additional data from the GEO and the cBioPortal databases revealed that low intra-tumoral MYL6 levels are associated with poor outcomes in patients with melanoma.28 A machine learning algorithm could link MYL6 expression to the “living without cancer” group in lung carcinoma, and in a cohort of patients with neuroblastoma. Increased intra-tumoral MYL6 expression predicted a better prognosis.29 These findings imply that MYL6 may contribute to tumor development and may serve as a biomarker in ES.
In our investigation, 19 metabolites varied significantly in the plasma of ES, with 3 of these compounds increasing in the patients. Additionally, glycolysis or gluconeogenesis, N-glycan biosynthesis, fructose and mannose metabolism, and the pentose phosphate pathway all showed significant changes in patients in our study, which may explain the relatively higher rates of ES in diabetics.7 The specific mechanisms of glycol metabolism need to be elucidated in further studies. Nonetheless, ES is a rare disease, so it is challenging to obtain samples. The relatively small sample size of our study is therefore a drawback, and additional studies with a larger sample size are required to confirm our findings.
Conclusion
This study provides insight into serum proteins and metabolites underlying ES. In addition, immunological inflammation and tumor glycol metabolism may facilitate the interaction between tumor cells and their microenvironment in the pathophysiology of ES.
Disclosure
The authors report no conflicts of interest in this work.
References
1. Williams K, Shinkai K. Evaluation and management of the patient with multiple syringomas: a systematic review of the literature. J Am Acad Dermatol. 2016;74(6):1234–1240.e1239. doi:10.1016/j.jaad.2015.12.006
2. Mohaghegh F, Amiri A, Fatemi Naeini F, Rajabi P, Soltan M. Acral eruptive syringoma: an unusual presentation with misdiagnosis. Case Rep Dermatol Med. 2020;2020:5416285. doi:10.1155/2020/5416285
3. Ibekwe P. Familial eruptive syringoma in a Nigerian girl. Clin Exp Dermatol. 2016;41(4):383–385. doi:10.1111/ced.12766
4. Guitart J, Rosenbaum MM, Requena L. “Eruptive syringoma”: a misnomer for a reactive eccrine gland ductal proliferation? J Cutan Pathol. 2003;30(3):202–205. doi:10.1034/j.1600-0560.2003.00023.x
5. Berbis P, Fabre JF, Jancovici E, Privat Y, Benderitter T. Late-onset syringomas of the upper extremities associated with a carcinoid tumor. Arch Dermatol. 1989;125(6):848–849. doi:10.1001/archderm.1989.01670180120026
6. Husein-ElAhmed H, Aneiros-Fernandez J, Aneiros-Cachaza J. ”Eruptive” facial syringomas: an inflammatory skin reaction? Skinmed. 2012;10(3):186–187.
7. Yaldiz M, Cosansu C, Erdem MT, Dikicier BS, Kahyaoglu Z. Familial eruptive syringoma. Hong Kong Med J. 2018;24(2):200–202.
8. Verma SB. An unusual case of eruptive syringomas presenting as itchy symmetrical lesions on both forearms in a patient of hyperkeratotic eczema. Indian Dermatol Online J. 2011;2(2):104–106. doi:10.4103/2229-5178.86004
9. Corredor F, Cohen PR, Tschen JA. Syringomatous changes of eccrine sweat ducts associated with prurigo nodularis. Am J Dermatopathol. 1998;20(3):296–301. doi:10.1097/00000372-199806000-00014
10. Claudy AL. Adult-onset urticaria pigmentosa and eruptive syringomas. J Am Acad Dermatol. 1988;19(1 Pt 1):135. doi:10.1016/S0190-9622(88)80226-3
11. Yasar S, Doner N, Gunes P. Coexistence of eruptive syringoma and bilateral nipple vitiligo: could there be a common immunopathogenesis? North Clinics Istanbul. 2017;4(2):195–198. doi:10.14744/nci.2016.51523
12. Yoshii N, Kanekura T, Churei H, Kanzaki T. Syringoma-like eccrine sweat duct proliferation induced by radiation. J Dermatol. 2006;33(1):36–39. doi:10.1111/j.1346-8138.2006.00006.x
13. Maeda T, Natsuga K, Nishie W, Yamashita K, Shimizu H. Extensive eruptive syringoma after liver transplantation. Acta Derm Venereol. 2018;98(1):119–120. doi:10.2340/00015555-2814
14. Litvinov IV, Jafarian F. Eruptive syringomas in the groin. CMAJ. 2014;186(8):612. doi:10.1503/cmaj.130793
15. Korekawa A, Nakajima K, Nishikawa Y, Matsuzaki Y, Nakano H, Sawamura D. Late-onset, eruptive syringoma in an elderly man: correlation with carbamazepine. Acta Derm Venereol. 2012;92(1):87–88. doi:10.2340/00015555-1156
16. Oztürk F, Ermertcan AT, Bilaç C, Temiz P. A case report of postpubertal eruptive syringoma triggered with antiepileptic drugs. J Drugs Dermatol. 2010;9(6):707–710.
17. Chandler WM, Bosenberg MW. Autoimmune acrosyringitis with ductal cysts: reclassification of case of eruptive syringoma. J Cutan Pathol. 2009;36(12):1312–1315. doi:10.1111/j.1600-0560.2009.01277.x
18. Iwao F, Onozuka T, Kawashima T. Vulval syringoma successfully treated with tranilast. Br J Dermatol. 2005;153(6):1228–1230. doi:10.1111/j.1365-2133.2005.06940.x
19. Agrawal S, Kulshrestha R, Rijal A, Sidhu S. Localized vulvar syringoma causing vulval pruritus and venerophobia. Australas J Dermatol. 2004;45(4):236–237. doi:10.1111/j.1440-0960.2004.00107.x
20. Karatzi C, Stefanidou M, Chaniotis V, Evangelou G, Krueger-Krasagakis S, Krasagakis K. Treatment of giant vulvar syringomas with topical adelmidrol: the role of mast cells. Australas J Dermatol. 2018;59(4):e305–e307. doi:10.1111/ajd.12850
21. Yu L, Shen H, Ren X, et al. Multi-omics analysis reveals the interaction between the complement system and the coagulation cascade in the development of endometriosis. Sci Rep. 2021;11(1):11926. doi:10.1038/s41598-021-90112-x
22. Chen JY, Wu YL, Mok MY, et al. Effects of complement C4 gene copy number variations, size dichotomy, and C4A deficiency on genetic risk and clinical presentation of systemic lupus erythematosus in East Asian populations. Arthritis Rheumatol. 2016;68(6):1442–1453. doi:10.1002/art.39589
23. Elinav E, Nowarski R, Thaiss CA, Hu B, Jin C, Flavell RA. Inflammation-induced cancer: crosstalk between tumours, immune cells and microorganisms. Nat Rev Cancer. 2013;13(11):759–771. doi:10.1038/nrc3611
24. Kew RR, Webster RO. Gc-globulin (vitamin D-binding protein) enhances the neutrophil chemotactic activity of C5a and C5a des Arg. J Clin Invest. 1988;82(1):364–369. doi:10.1172/JCI113596
25. Vandikas MS, Landin-Wilhelmsen K, Polesie S, Gillstedt M, Osmancevic A. Impact of etanercept on vitamin D status and vitamin D-binding protein in bio-naïve patients with psoriasis. Acta Derm Venereol. 2021;101(11):adv00604. doi:10.2340/actadv.v101.359
26. Wang A, Liu L, Yuan M, et al. Role and mechanism of FLNa and UCP2 in the development of cervical cancer. Oncol Rep. 2020;44(6):2656–2668. doi:10.3892/or.2020.7819
27. Bandaru S, Ala C, Salimi R, et al. Targeting filamin A reduces macrophage activity and atherosclerosis. Circulation. 2019;140(1):67–79. doi:10.1161/CIRCULATIONAHA.119.039697
28. Vierthaler M, Sun Q, Wang Y, et al. ADCK2 knockdown affects the migration of melanoma cells via MYL6. Cancers. 2022;14(4):1071. doi:10.3390/cancers14041071
29. Deng F, Shen L, Wang H, Zhang L. Classify multicategory outcome in patients with lung adenocarcinoma using clinical, transcriptomic and clinico-transcriptomic data: machine learning versus multinomial models. Am J Cancer Res. 2020;10(12):4624–4639.
 © 2023 The Author(s). This work is published and licensed by Dove Medical Press Limited. The
full terms of this license are available at https://www.dovepress.com/terms
and incorporate the Creative Commons Attribution
- Non Commercial (unported, 3.0) License.
By accessing the work you hereby accept the Terms. Non-commercial uses of the work are permitted
without any further permission from Dove Medical Press Limited, provided the work is properly
attributed. For permission for commercial use of this work, please see paragraphs 4.2 and 5 of our Terms.
© 2023 The Author(s). This work is published and licensed by Dove Medical Press Limited. The
full terms of this license are available at https://www.dovepress.com/terms
and incorporate the Creative Commons Attribution
- Non Commercial (unported, 3.0) License.
By accessing the work you hereby accept the Terms. Non-commercial uses of the work are permitted
without any further permission from Dove Medical Press Limited, provided the work is properly
attributed. For permission for commercial use of this work, please see paragraphs 4.2 and 5 of our Terms.