Back to Journals » Diabetes, Metabolic Syndrome and Obesity » Volume 13
Serum miR-503 is a Candidate Biomarker for Differentiating Metabolic Healthy Obesity from Metabolic Unhealthy Obesity
Authors Yue HQ, Zhou YH, Guo Y, Tang CY ![]() , Wang F, Zhou HD
, Wang F, Zhou HD ![]()
Received 19 May 2020
Accepted for publication 8 July 2020
Published 27 July 2020 Volume 2020:13 Pages 2667—2676
DOI https://doi.org/10.2147/DMSO.S262888
Checked for plagiarism Yes
Review by Single anonymous peer review
Peer reviewer comments 3
Editor who approved publication: Professor Ming-Hui Zou
Hai-Qing Yue,1 Ying-Hui Zhou,1 Yue Guo,1,2 Chen-Yi Tang,1 Fang Wang,1 Hou-De Zhou1
1National Clinical Research Center for Metabolic Diseases, Hunan Provincial Key Laboratory for Metabolic Bone Diseases, Department of Metabolism and Endocrinology, The Second Xiangya Hospital of Central South University, Changsha 410011, Hunan, People’s Republic of China; 2Department of Stomatology, The Second Xiangya Hospital, Central South University, Changsha, Hunan, People’s Republic of China
Correspondence: Hou-De Zhou
National Clinical Research Center for Metabolic Diseases, Hunan Provincial Key Laboratory for Metabolic Bone Diseases, Department of Metabolism and Endocrinology, The Second Xiangya Hospital of Central South University, Changsha 410011, Hunan, People’s Republic of China
Tel +86-731-85292223
Fax +86-731-85533525
Email [email protected]
Purpose: Overweight and obesity are associated with metabolic diseases. However, a subgroup of the overweight/obese population does not present metabolic abnormalities. Hence, there is an urgent need to identify biomarkers that can distinguish different obesity phenotypes and metabolic status.
Patients and Methods: A total of 98 individuals were divided into three groups: metabolically healthy normal weight (MHNW), metabolically healthy obese (MHO), and metabolically unhealthy obese (MUO). Participants were evaluated for anthropometric and biochemical parameters and serum BMPR1A concentration and miR-503 level. Receiver operating characteristic (ROC) curve analysis and logistic regression analysis were performed.
Results: The level of miR-503 was significantly higher in the MHO group compared with that in the MUO group, but no difference was observed between the MHNW and MHO groups. Meanwhile, no significant differences in serum BMPR1A concentration were observed between the three groups. ROC curve analysis showed that miR-503 could be used as a marker to distinguish the MUO from the MHO. Logistic regression analysis suggested that miR-503 was an important related factor associated with an unhealthy metabolic state in overweight/obese subjects.
Conclusion: miR-503 can be considered as a suitable biomarker to distinguish between the MUO and MHO, which may be a related factor for the incidence of metabolic disorders in overweight/obese subjects.
Keywords: micro RNA, metabolic syndrome, diagnosis
Introduction
Obesity is a major public health threat in the 21st century. Globally, about 2.1 billion adults are obese.1 Obesity is characterized by excessive or abnormal fat storage and is influenced by genetic and environmental factors.2 Additionally, it is associated with several cardiometabolic diseases, such as type 2 diabetes, hypertension, and coronary heart diseases.3,4 However, the presence of metabolic disturbances varies among subjects with the same body mass index (BMI). Some obese individuals will never have obesity-related metabolic abnormalities in their lifetime, which is defined as metabolically healthy obese (MHO) subject.5 Unlike subjects with a metabolically unhealthy obese (MUO), MHO subjects are at a lower risk of cardiometabolic diseases.6 Meanwhile, individuals with normal BMI but abnormal metabolic status are defined as metabolically unhealthy normal-weight (MUNW) subjects.7 The above examples show that the definition of obesity by BMI alone cannot accurately reflect the obesity-related metabolic status and susceptibility to metabolic diseases. Hence, there is an urgent requirement to identify novel obesity biomarkers that can distinguish between the different obese phenotypes.
It is now generally accepted that anatomic and physiologic derangements of adipocyte and adipose tissue are central to the pathology of different phenotypes of obesity and obesity-associated metabolic complications.8,9 Excessive triglycerides cause adipocyte hypertrophy and proliferation, which results in the accumulation of unhealthy fat and decreased blood supply.10 Under hypoxia, adipocytes and adipose tissue recruit fat cells and macrophages that release inflammatory cytokines.11 Hypertrophic adipocytes produce a wide range of pro-inflammatory adipokines, leading to insulin resistance.12 Studies have indicated that the pathological state of the adipose tissue plays an important role in the development of obesity-associated metabolic diseases. Except for the above mentioned inflammatory cytokines and adipokines, the pathological state of the adipose tissue is regulated by other factors such as hormone and resistin. More and more studies have shown that epigenetic regulation also plays important roles in the pathophysiological processes of adipose tissue.13 In our previous study, we identified miR-503 as the differential expressed gene in insulin receptor substrate-1 (IRS-1) KO mice with a decrease in fat mass.14 And bone morphogenetic proteins receptor type 1A (BMPR1a), the target gene of miR-503, whose express was synchronously declined in IRS-1 KO mice.15 We further confirmed this finding by transfecting primary preadipocytes with BMPR1A-specific small interfering RNAs (siRNAs), and the results showed a significant disruption of adipogenesis.16 Hence, we hypothesise that miR-503 and BMPR1a might be important biomarkers for obesity and set to investigate their association with different obese phenotypes.
Micro-RNAs (miRNAs) are small, non-coding RNAs that negatively regulate gene expression at the post-transcriptional level.17 They are crucial in maintaining metabolic homeostasis18 and exhibit typical characteristics of a good biomarker.19 Studies have revealed that there are significant differences between the levels of several miRNAs (miR-142-3p, miR-140-5p, miR-15a, miR-520c-3c, and miR-423-5p) in morbidly obese men, suggesting that they may serve as novel biomarkers for risk estimation and classification of morbidly obese patients.20
BMPR1A is the receptor of bone morphogenetic proteins (BMPs) which belong to the transforming growth factor-β superfamily.21 BMP signaling plays a key role in adipose biology.22,23 Among the different isoforms of BMP receptors, BMPR1A mediates most of the effects of BMP2/4 and BMP6/721 and has been linked to adipose development and metabolism in both mice and human studies. A cohort study indicated that BMPR1A expression in the adipose tissue of overweight and obese individuals was higher than that in lean subjects, and its level was correlated with the occurrence of type 2 diabetes.20 In a conditional myogenic factor 5-BMPR1A knockout (KO) model, in which BMPR1A expression was blocked in the brown adipogenic progenitor cells, these mice displayed a significant reduction in the amount of constitutive brown adipose tissue at the embryonic stage.24 Through the database of the European Bioinformatics Institute, we found BMPR1A can express in blood. Hence, these data suggested that BMPR1A is likely to participate in the metabolic disturbances caused by adipose tissue and serves as a potential marker to differentiate between different types of obesity.
In this study, we aimed to evaluate the expression of BMPR1A and miR-503 in the serum samples of subjects with different obese phenotypes and metabolic statuses, and investigate whether their expression is correlated with the different phenotypes of obesity. Our findings provide insights into potential biomarkers that can help differentiate between different obesity types, with or without metabolic abnormalities.
Materials and Methods
Study Population and Participants
A cross-sectional case–control study was undertaken from 2014 to 2015 in the Health Management Center of the Second Xiangya Hospital, Central South University. Eligible participants were Chinese adult individuals above the age of 18 (either sex) with overweight/obesity (BMI≥24 kg/m2) and their respective paired controls (BMI < 24 kg/m2).25 Individuals with the following diseases, conditions or indulgences were excluded: BMI > 40 kg/m2,26 severe liver and kidney disorders, regular drinkers, pregnancy, and malignancy, and secondary obesity caused by other diseases, such as bulimia or Cushing’s syndrome. Additionally, individuals using steroid hormones or drugs (aspirin, isoniazid, or rifampicin) that might cause weight change and glycemic and lipid metabolism imbalance in the past 6 months were excluded. Individuals were divided into the following three groups based on body weight and metabolic status: metabolically healthy normal weight (MHNW), MHO and MUO subjects, and the control is MHNW group. The MHO and MUO groups were matched by BMI, while the MHNW and overweight/obesity groups were matched by age. Considering the World Health Organization (WHO) proposed BMI cut-off points for Asian populations, normal weight was defined as BMI 18.5–23.9 kg/m2, overweight as BMI 24.0–27.9 kg/m2, and obesity as BMI ≥28 kg/m2.25 Due to the limited sample size and many overweight people already had metabolic abnormalities in China, this study combined overweight and obese people into one group, and BMI ≥ 24 kg/m2 was used to define overweight/obesity. Metabolic status, which is associated with numerous components of metabolic syndrome, was determined according to the 2007 Joint Committee for Developing Chinese Guidelines (JCDCG2007).27 Subjects defined as metabolically unhealthy had more than two of the following cardiometabolic abnormalities: 1) WC ≥ 90 cm for men and ≥ 85 cm for women, 2) serum triglyceride (TG) ≥ 1.7 mmol/L or specific treatment for dyslipidemia, 3) high-density lipoprotein cholesterol (HDL-C) < 1.04 mmol/L or specific treatment for dyslipidemia, 4) BP ≥ 130/85 mm Hg or use of any antihypertensive agents, and 5) fasting plasma glucose (FPG) ≥ 6.1 mmol/L and/or 2 h plasma glucose ≥ 7.8 mmol/L and/or diagnosed diabetic mellitus and undergoing therapy. All subjects signed a written consent form prior to their participation in the study. All experimental protocols were performed in accordance with the guidelines of the World Medical Association Declaration of Helsinki for human subjects. This study was approved by the Ethics Committee of National Clinical Research Center for Metabolic Disease, the Second Xiangya Hospital of Central South University. Clinical trial registration number: ChiCTR-EOC-16,010,194. We deposited all data and related metadata of our research in the public repository (ResMan, http://www.medresman.org/pub/cn/proj/projectshow.aspx? proj=2139).
Clinical Data Collection
All recruited subjects completed a detailed questionnaire about their basic information with the help of specialists. The sample size was obtained by online sample size calculators (https://www.sample-size.net/) and decided according to the difference of serum miR-503 levels between MHNW and overweight/obese subjects (considering the facts in our study, S = 1.09, α= 0.05, δ = 0.1). To reduce the bias caused by clinical diagnosis, each participant was evaluated by three experienced physicians based on established protocol. Anthropometric variables (body weight and height) were measured using an ultrasonic height and weight scale (Shanghe Electronic Technology Co. Ltd, Zhengzhou, China) in subjects in a quiet and fasting state, wearing light clothing and no shoes. BMI was calculated using the following formula: weight (kg)/height (m2). Waist circumference (WC) was measured during the end of exhalation, with a steel tape halfway between the lower rib margin and iliac crest in a horizontal plane. Hip circumference (HC) was measured at the widest part of the buttocks. Blood pressure (BP) was recorded three times with a standard electronic sphygmomanometer after the subject rested for 15 min in a seated position; the average of three readings was used in the analysis.
Blood Collection and Biochemical Analysis
Following an overnight fast of about 8 to 10 hours, venous blood was collected by venipuncture from all participants for biochemical tests and other analyses. We measured FPG using the hexokinase enzymatic method (Ningbo Medical System Biotechnology Co. Ltd., Zhejiang, China). TG, low-density lipoprotein cholesterol (LDL-C), HDL-C, and total cholesterol (TC) levels were measured using an automated analyzer (Architect c8000 Chemistry System, Abbott Diagnostics, USA).
Enzyme-Linked Immunosorbent Assay (ELISA)
For the determination of BMPR1A concentration, blood samples were kept for 30 min at room temperature before centrifugation for 15 min at 1000 x g. Serum aliquots were stored at –80°C until analyzed. For the detection of BMPR1A protein concentrations, sandwich ELISA was performed using a commercially available quantitative reagent kit (Cusabio Biotech Co., Ltd., Wuhan, China) according to the manufacturer’s protocol.
RNA Isolation and Quantitative Real-Time PCR
Total RNA was isolated using TRIzol LS reagent according to the manufacturer’s instructions (Invitrogen), and then reverse-transcribed with the Reverse Transcription kit (Takara) to generate first-strand miRNA-cDNA PCR templates. Quantitative real-time PCR was performed using SYBR Premix Ex Taq II kit (Takara, Otsu, Japan) on the LightCycler 480 Instrument II Real-time PCR System (Roche, Basel, Switzerland). All PCR experiments were performed in triplicate. Primers specific for human miR-503 were used, and miR-39 was used as an internal control. Relative miRNA expression was quantified with the –ΔΔCt method, and the fold-change was determined using the formula 2–ΔΔCt.28
Statistical Analysis
All statistical analyses were performed using SPSS software version 19.0 (SPSS, Inc., Chicago, USA). A P value < 0.05 was considered statistically significant. Continuous variables with normal distribution are expressed as mean ± standard deviation (SD), data transformation was used to normalize the distribution of variables with minor skewed distribution, and comparisons between different groups were made using one-way analysis of variance (ANOVA). Categorical variables are expressed as percentages (%), and comparisons between different groups were made using the Chi-square test. Age-and sex-adjusted partial correlation analysis was used to analyze the correlation between serum BMPR1A, miR-503, and anthropometric and metabolic characteristics. Receiver operating characteristic (ROC) curve analysis was performed to determine the predictive value of BMPR1A and miR-503 in subjects with different body weights and metabolic status. Logistic regression analysis was used to evaluate potential risk and related factors associated with different obesity phenotypes and metabolic status, especially to identify related factors with the presence of the MUO phenotype (coded 1) in overweight/obese subjects. In MHNW and MHO groups, MHO was coded 1, while in MHNW and MUO groups, MUO was coded 1.
Results
Baseline Characteristics of the Study Subjects
We recruited 136 subjects, 3 were unwilling to sign the informed consent, and 23 were excluded according to the exclusion criteria, and 2 were in the MUNW group which was not discussed in this research, the final sample size was 98. Of the 55 subjects in the overweight/obesity group, 27 were overweight and 28 were obese. After square transformation for TG, HDL-C, BMPR1a and log transformation for FPG, every variable is normally distributed. The characteristics of the overall study population are listed in Table 1, 98 participants aged 36 to 57 years were divided into three groups, 43 in MHNW group, 34 in MHO group and 21 in MUO group. Based on their BMI, 43 (43.9%) subjects were classified as normal weight, and 55 (56.1%) were classified as overweight/obesity. Approximately 34.7% (n = 34) of the total participants were metabolically healthy obese. There were no differences in age, sex and BMI between the MHO and MUO groups. As expected, the MUO group displayed higher BP, higher levels of TG and TC, and lower levels of HDL-C compared with the MHO group. Compared with the MHNW group, the MHO group had lower levels of HDL-C and higher BMI, WC, and waist–hip ratio (WHR).
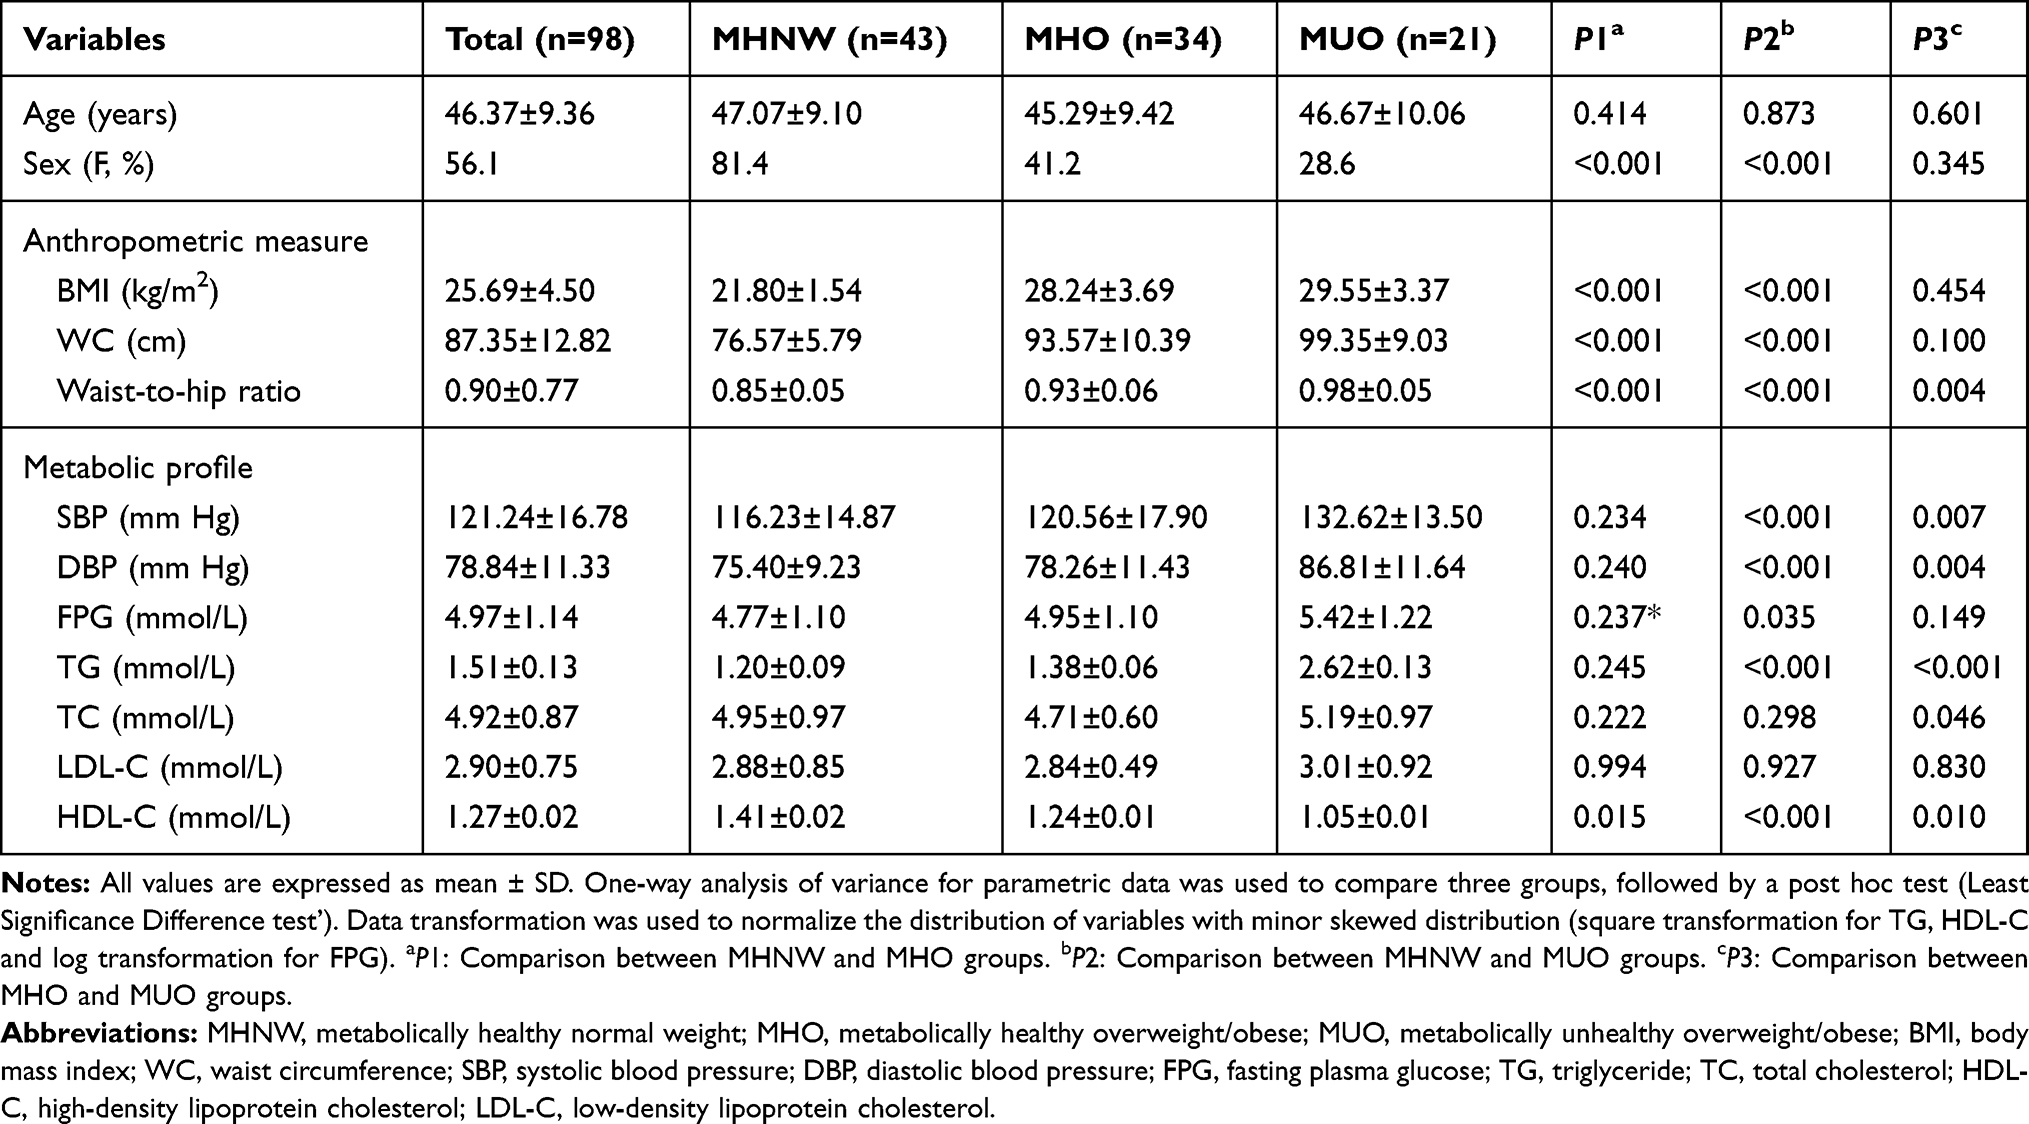 |
Table 1 Baseline Clinical and Biochemical Characteristics of the Study Subjects (n = 98) |
Expression of miR-503 Was Higher in the MHO Group Compared with That in MUO Group
We further detected the serum concentration of BMPR1A and miR-503 level in the three groups (MHNW, MHO, and MUO). Results showed that there were no differences in serum BMPR1A concentration between these groups (Figure 1A). However, the level of miR-503 was significantly lower in the MUO group compared with that in the MHO (P = 0.007) and MHNW groups (P = 0.007), but showed no difference between the MHO and MHNW groups (Figure 1B). Then, we performed a correlation analysis of BMPR1A and miR-503 and the results showed no correlation between serum BMPR1A concentration and miR-503 level (Table S1).
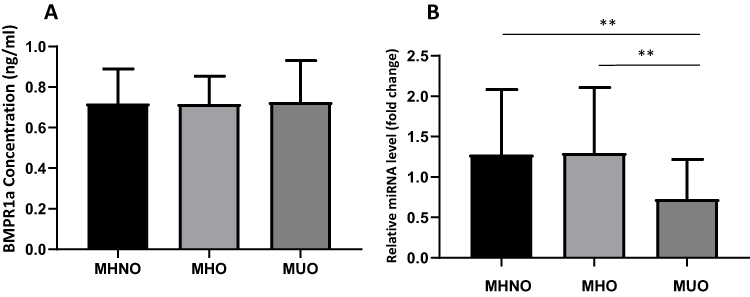 |
Figure 1 Comparison of the levels of BMPR1A (A) and miR-503 (B) between the MHNW, MHO, and MUO groups. Notes: There were no significant differences in BMPR1A concentration between the three groups. The serum level of miR-503 was significantly decreased in the MUO group compared with that in the MHNW and MHO groups. (**P < 0.01 vs MHNW group; **P < 0.01 vs MHO group, One-way analysis of variance). |
Next, we investigated whether serum BMPR1A concentration and miR-503 levels were related to the demographic, anthropometric, and metabolic components of the study participants. BMPR1A concentration and miR-503 level in serum samples stratified by age and gender were analyzed and no significant differences were observed (Table 2). Correlation analysis was then performed to evaluate the association of BMPR1A and miR-503 with anthropometric and metabolic components in overweight/obese individuals after adjustment for age and sex. Results showed that serum BMPR1A concentration was positively correlated with WC. However, there was no significant correlation between BMPR1A and other metabolic components. Furthermore, miR-503 level was found to be negatively correlated with systolic blood pressure (SBP) (Table 3).
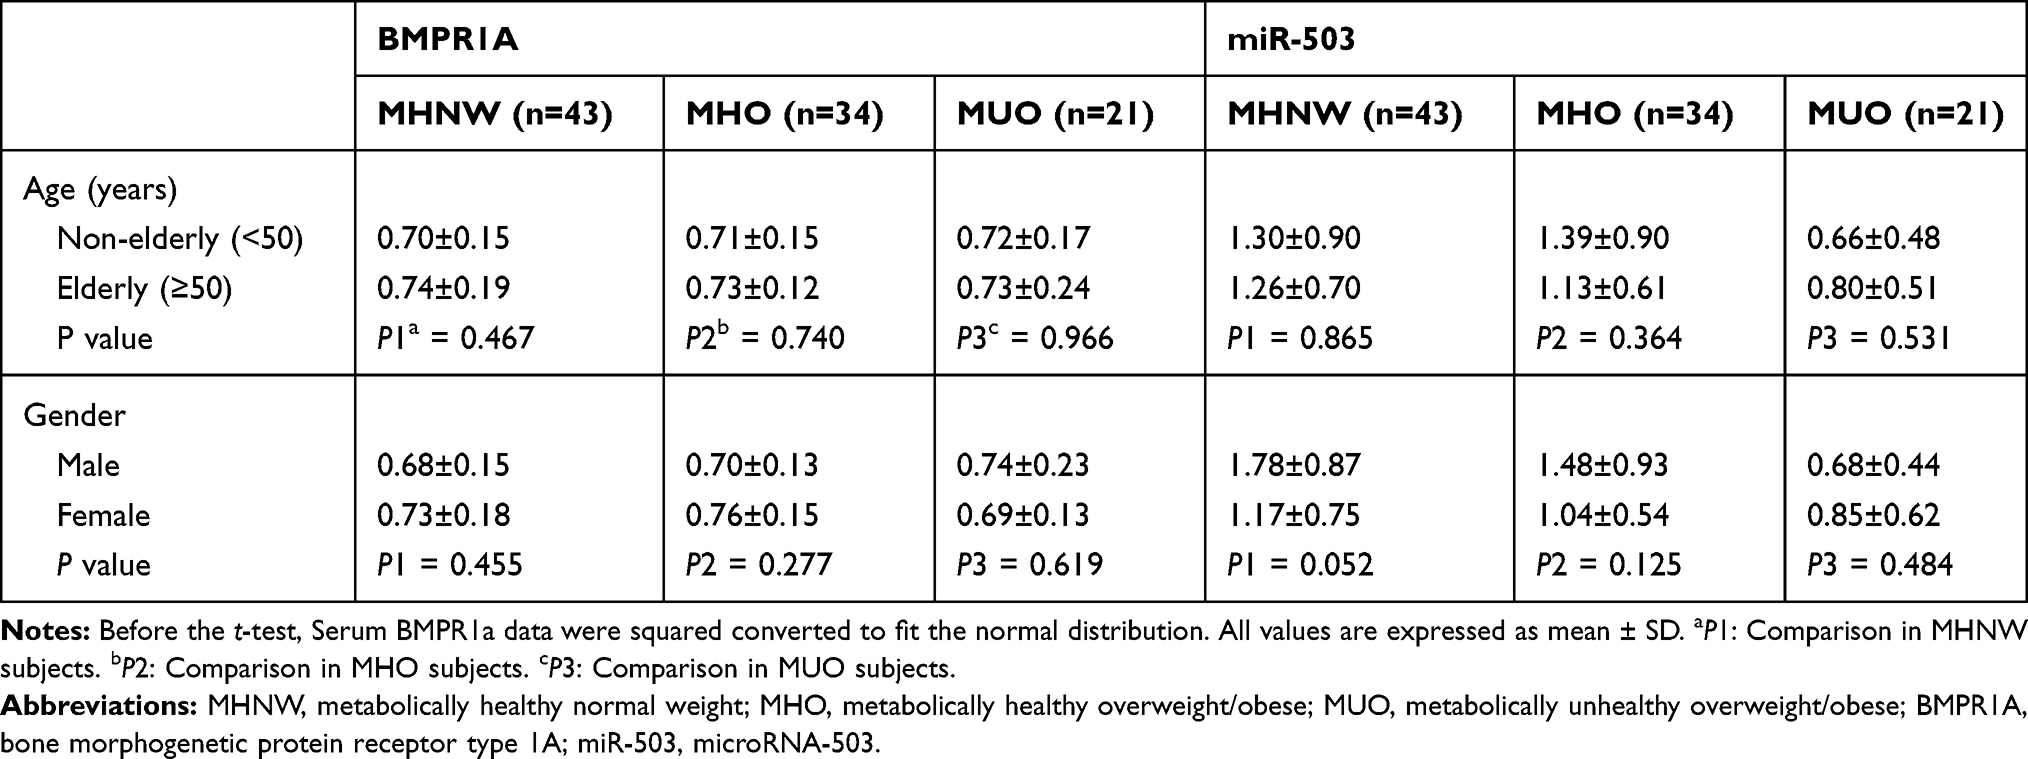 |
Table 2 Independent Sample t-test for Serum BMPR1A and miR-503 Levels According to Age and Gender |
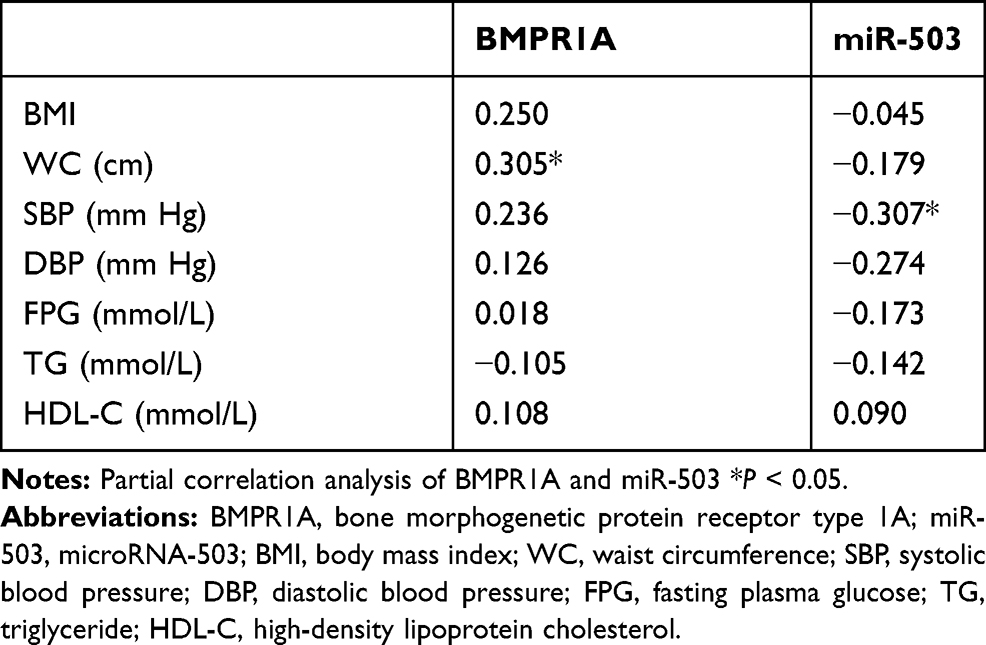 |
Table 3 Age- and Sex-Adjusted Correlation Analysis of BMPR1A and miR-503 with Anthropometric and Metabolic Components in Overweight/Obese Subjects |
miR-503 is a Candidate Biomarker to Distinguish Between MUO and MHO Subjects
To evaluate the diagnostic value of serum BMPR1A and miR-503 for differentiating between various obesity phenotypes and metabolic status, ROC curve analysis was performed. Comparing MHO with MUO subjects, the area under the ROC curve (AUC) for BMPR1A was 0.503 (95% CI: 0.332–0.675), which failed to differentiate the MUO from the MHO phenotype (Figure 2A). However, miR-503 generated a satisfactory ROC value of 0.708 (95% CI: 0.570–0.846; Figure 2B), and hence can be considered as a reliable marker to distinguish MHO subjects from MUO individuals. The optimized cut-off value of miR-503 was 1.072, with a sensitivity of 64.7% and a specificity of 76.2%.
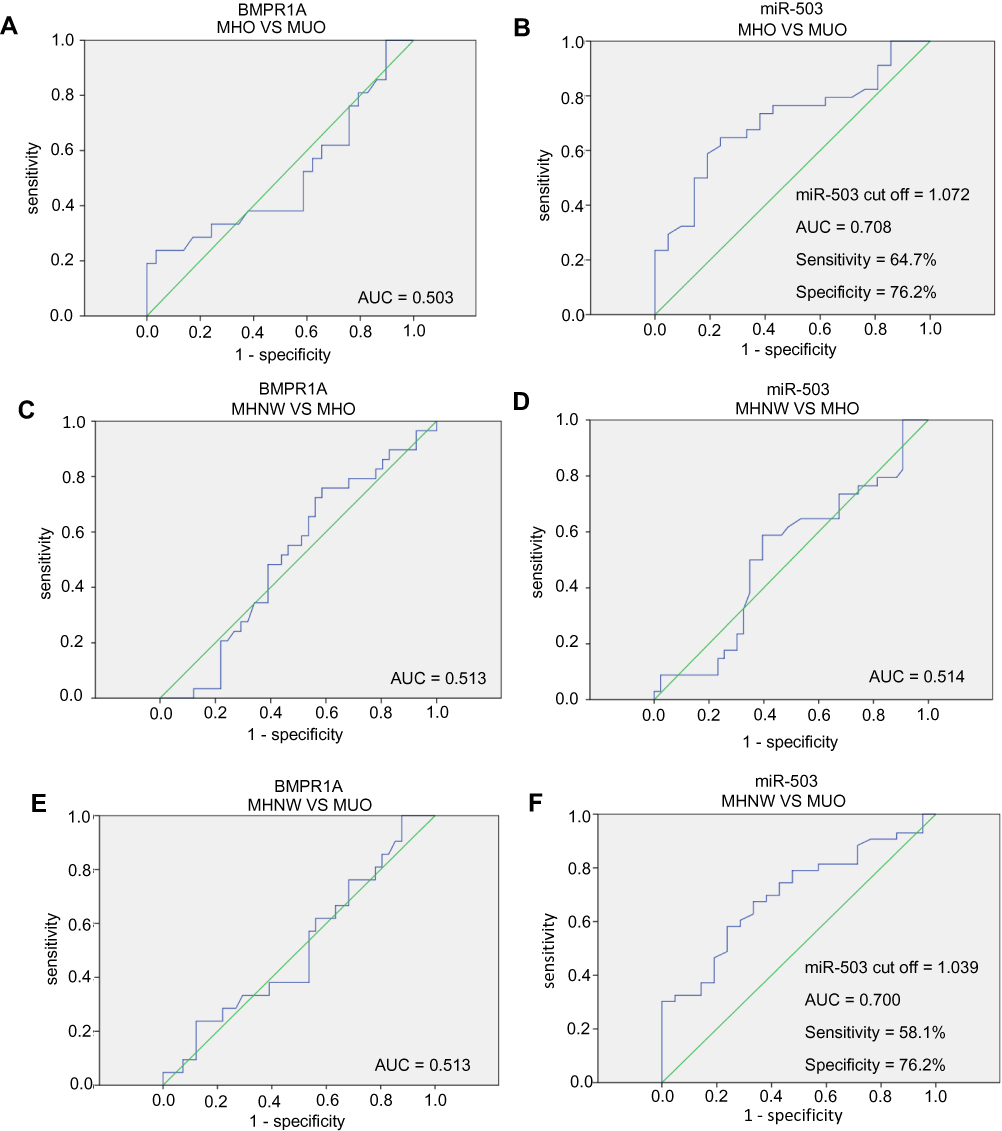 |
Figure 2 ROC curve analysis to compare the ability of BMPR1A and miR-503 to distinguish between the MHNW, MHO, and MUO phenotypes. Notes: (A) BMPR1A could not distinguish between the MUO and MHO. (B) miR-503 could distinguish between the MUO and MHO. (C) BMPR1A could not distinguish between the MHNW and MHO. (D) miR-503 could not distinguish between the MHNW and MHO. The AUC of miR-503 was 0.700. The cut-off value of miR-503 is 1.039, with 58.1% sensitivity and 76.2% specificity. (E) BMPR1A could not distinguish between the MHNW and MUO. (F) miR-503 could distinguish between the MHNW and MUO. The AUC of miR-503 was 0.708. The cut-off value of miR-503 is 1.072, with 64.7% sensitivity and 76.2% specificity. |
Meanwhile, the AUC values of BMPR1A and miR-503 were found to be 0.513 (95% CI: 0.576–0.649) and 0.514 (95% CI: 0.382–0.647), respectively, comparing the MHNW and MHO groups (Figure 2C and D). These results indicated that BMPR1A and miR-503 cannot distinguish MHO subjects from MHNW individuals. For the MHNW and MUO groups, the AUC of BMPR1A was 0.513 (95% CI: 0.361–0.666; Figure 2E), and BMPR1A did not display a diagnostic value. However, miR-503 was a suitable marker for distinguishing between MHNW and MUO groups, as its AUC value was 0.700 (95% CI: 0.570–0.831). With a cut-off value of 1.039, the specificity and sensitivity of miR-503 were 58.1% and 76.2%, respectively (Figure 2F).
miR-503 is a Related Factor with the Presence of an Unhealthy Metabolic Status in Overweight/Obese Subjects
We further performed multivariate logistic regression analysis to evaluate risk factors associated with different obesity phenotypes and metabolic status. The results showed that the odds ratios (ORs) were 1.234 (95% CI: 0.573–2.655) for age (P = 0.591), 1.291 (95% CI: 0.320–5.208) for sex (P = 0.719), 0.987 (95% CI: 0.411–2.370) for BMPR1A (P = 0.976), and 0.224 (95% CI: 0.075–0.670) for miR-503 (P = 0.009) in overweight/obesity subjects. miR-503 was validated as a related factor with the metabolic health phenotype in overweight/obesity subjects (Table 4).
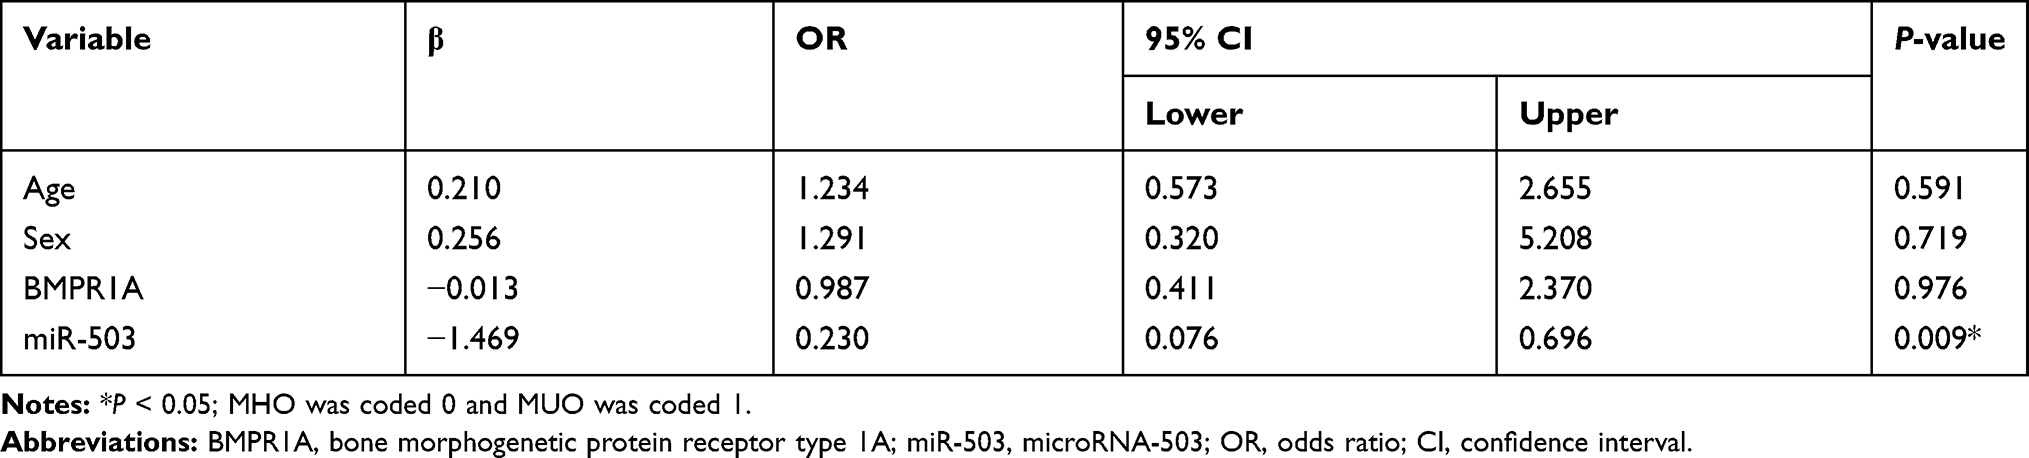 |
Table 4 Logistic Regression Analysis for Related Factors Associated with MUO Phenotype in Overweight/Obese Subjects (Odds Ratio and Confidence Limits) |
Results further showed that age, BMPR1A, and miR-503 were not associated with the MHO phenotype in MHNW and MHO subjects, with OR values of 0.884 (95% CI: 0.445–1.755) for age (P = 0.724), 1.376 (95% CI: 0.570–3.280) for BMPR1A (P = 0.484), and 0.739 (95% CI: 0.355–1.630) for miR-503 (P = 0.454). Meanwhile, male subjects were associated with a higher risk of MHO (compared with MHNW) in metabolically healthy subjects (OR = 10.746; 95% CI: 3.102–37.232; P < 0.001) (Table S2). As for the MHO and MUO groups, miR-503 was found to be negatively correlated with the metabolic unhealthy phenotype (OR = 0.230; 95% CI: 0.073–0.722; P = 0.012), and male sex was a risk factor (OR = 16.305; 95% CI: 3.850–69.055; P < 0.001) (Table S3). Age and BMPR1A variances between the two groups were not notable (Table S3).
Discussion
MHO and MUO subjects share the same weight status but different clinical manifestations and outcomes.6,7 However, the specific metabolic characteristics and molecular markers that distinguish MUO from MHO have not been fully discovered. BMI, a widely used index to classify obesity at present, fails to distinguish between fat and lean masses as well as benign and malignant obesity.29 The presence of the metabolic health phenotype in overweight/obese subjects diagnosed on the basis of BMI did not develop metabolic disturbances, which suggested that the need to find novel biomarkers to define obesity and to be able to predict whether obese individuals will develop metabolic disorders. Indices associated with fat distribution and function have been suggested as markers to determine the metabolic status of obesity. Nathaly et al suggested using WC as an anthropometric parameter to identify obesity women with metabolic unhealthy phenotype in the Mexican population.30 Biochemical measurements of adipokines, including leptin,31 adiponectin,32 the leptin/adiponectin ratio,27 resistin,33 retinol-binding protein 4,34 and fibroblast growth factor 21,35 were recommended to distinguish MUO from MHO. Our research provided evidence that miR-503 was inversely associated with the phenotype of MUO and can be used as a diagnostic marker for a metabolically unhealthy state in the overweight/obesity population.
In this study, MHO and MHNW subjects had significantly higher miR-503 levels than MUO subjects, which indicated that miR-503 level was related to metabolic health status. We also confirmed that miR-503 expression was negatively correlated with metabolic abnormalities in obese subjects. Pescador et al conducted a cross-sectional study including 13 patients in Spain, the study suggested that miR-503 serum level in diabetic or obese subjects was significantly lower than that in controls,36 which is consistent with our results. The expression of miR-503 was not affected by age and sex, and thus, miR-503 can be used as a biomarker in a wider range of the population without additional limitations. Pearson’s correlation analysis showed no significant association between miR-503 and metabolic health indicators. However, this result may be due to insufficient sample size, which needs to be addressed in future studies.
Our previous study demonstrated that BMPR1A expression was inhibited by miR-503 at the transcriptional level. However, our results here showed that there were no significant differences in BMPR1A concentration among the three groups. This may be due to two reasons. Firstly, BMPR1A is regulated by various ligands, including BMP2, BMP4, BMP6, and BMP7, and is involved in different signaling pathways, such as the runt-related transcription factor 2 (RUNX2)/insulin pathway.12 Secondly, it might be a result of BMPR1A degradation in the serum. These two reasons might contribute to the inconsistency of serum BMPR1A concentration and miR-503 level in different types of obesity.
We further explored whether BMPR1A and miR-503 might serve as biomarkers to distinguish different obese phenotypes and metabolic status. Using ROC curves, we estimated that the best cut-off value of miR-503 to identify metabolic disturbances in overweight/obese subjects was 1.072 (AUC 0.708, specificity = 0.76, sensitivity = 0.65). The AUC value indicated that miR-503 can distinguish between MHO and MUO subjects. Pescador et al recommended miR-503 as a circulating biomarker to distinguish between type 2 diabetes and diabetes from obesity.36 Yu et al suggested that miR-503 could serve as a prognostic marker for coronary artery disease.37 Here, logistic regression analysis showed that the OR value of miR-503 was 0.224, suggesting that it might play a role in inhibiting the progression of an unhealthy metabolic state in overweight/obese subjects. WC was once found as a suitable marker to distinguish between the MHO and MUO,30,38 however, no significant differences in age, sex, BMI, and WC between the MHO and MUO groups were observed in this study, indicating that these indices could not distinguish between the MHO and MUO, thus more samples are needed for future research. Compared with the MHNW group, subjects in the MUO group were predisposed to be male and showed higher WC and WHR, in agreement with the logistic regression analysis that found that male overweight/obese subjects were more likely to develop metabolic disturbances than females. Phillips et al previously confirmed that male subjects have a higher probability of presenting the MUO,39 which is also is consistent with our findings.
This research still has some limitations. Although some people not overweight or obese, but their plasma sugar and serum TG may be abnormal, namely MUNW subjects, due to fewer samples were collected in this group, MUNW group was excluded in the study but will be included in future studies, and the individuals from different groups will be followed up. Another limitation is the small sample size, due to the limited sample size, we had to combine overweight and obesity in the same group, obesity and overweight will be studied in separate groups in the future. Considering that sometimes different markers work in a complementary fashion, traditional markers needed to be combined with miR-503 into ROC analysis in the future. As markers derived from non-coding RNA are not tissue- and disease-specific, it is also necessary to further determine which diseases will affect serum miR-503 levels before clinical practice. Besides, the finding of miR-503 using as a diagnostic marker for a metabolically unhealthy state needed to be further validated in an independent cohort study.
Conclusion
In conclusion, we showed that miR-503 is a novel biomarker that can distinguish the MHO from the MUO and may help in the early identification of metabolic disturbances. Our findings may help in the development of miR-503-based prevention and treatment strategies to combat obesity.
Data Sharing Statement
We commit to responsible sharing of data from this clinical trial. This includes summary data and anonymized individual participant data as well as other information, such as study protocol. Requests from any qualified researchers who engage in rigorous, independent scientific research will be considered. Data will be provided following review and approval of a research proposal and statistical analysis plan and execution of a data sharing agreement. For more information, please email Hou-De Zhou, [email protected].
Ethics and Consent Statement
This study has been approved by the ethics committee of National Clinical Research Center for Metabolic Disease, the Second Xiangya Hospital of Central South University and has been performed in accordance with the ethical standards as laid down in the 1964 Declaration of Helsinki and its later amendments or comparable ethical standards. Informed consent was obtained from all individual participants included in the study.
Disclosure
The authors report no conflicts of interest in this work.
References
1. Ng M, Fleming T, Robinson M, et al. Global, regional, and national prevalence of overweight and obesity in children and adults during 1980–2013: a systematic analysis for the global burden of disease study 2013. Lancet. 2014;384:766–781. doi:10.1016/S0140-6736(14)60460-8
2. Abdelaal M, le Roux CW, Docherty NG. Morbidity and mortality associated with obesity. Ann Transl Med. 2017;5:161. doi:10.21037/atm.2017.03.107
3. Kearns K, Dee A, Fitzgerald AP, Doherty E, Perry IJ. Chronic disease burden associated with overweight and obesity in Ireland: the effects of a small BMI reduction at population level. BMC Public Health. 2014;14:143. doi:10.1186/1471-2458-14-143
4. Mokdad AH, Ford ES, Bowman BA, et al. Prevalence of obesity, diabetes, and obesity-related health risk factors, 2001. JAMA. 2003;289:76–79. doi:10.1001/jama.289.1.76
5. Primeau V, Coderre L, Karelis AD, et al. Characterizing the profile of obese patients who are metabolically healthy. Int J Obes (Lond). 2011;35:971–981. doi:10.1038/ijo.2010.216
6. Samocha-Bonet D, Dixit VD, Kahn CR, et al. Metabolically healthy and unhealthy obese–the 2013 stock conference report. Obes Rev. 2014;15:697–708. doi:10.1111/obr.12199
7. Mathew H, Farr OM, Mantzoros CS. Metabolic health and weight: understanding metabolically unhealthy normal weight or metabolically healthy obese patients. Metabolism. 2016;65:73–80. doi:10.1016/j.metabol.2015.10.019
8. Bays HE. Adiposopathy is “sick fat” a cardiovascular disease? J Am Coll Cardiol. 2011;57:2461–2473. doi:10.1016/j.jacc.2011.02.038
9. Luo L, Liu M. Adipose tissue in control of metabolism. J Endocrinol. 2016;231:R77–R99. doi:10.1530/JOE-16-0211
10. Bays H. Adiposopathy, “sick fat,” Ockham’s razor, and resolution of the obesity paradox. Curr Atheroscler Rep. 2014;16:409. doi:10.1007/s11883-014-0409-1
11. Heilbronn L, Smith SR, Ravussin E. Failure of fat cell proliferation, mitochondrial function and fat oxidation results in ectopic fat storage, insulin resistance and type II diabetes mellitus. Int J Obes Relat Metab Disord. 2004;28(Suppl 4):S12–21. doi:10.1038/sj.ijo.0802853
12. Kong Y, Zhang S, Wu R, et al. New insights into different adipokines in linking the pathophysiology of obesity and psoriasis. Lipids Health Dis. 2019;18:171. doi:10.1186/s12944-019-1115-3
13. Sun W, Dong H, Becker AS, et al. Cold-induced epigenetic programming of the sperm enhances brown adipose tissue activity in the offspring. Nat Med. 2018;24(9):1372–1383. doi:10.1038/s41591-018-0102-y
14. Guo Y, Tang CY, Man XF, et al. Insulin receptor substrate-1 time-dependently regulates bone formation by controlling collagen Ialpha2 expression via miR-342. FASEB J. 2016;30:4214–4226. doi:10.1096/fj.201600445RR
15. Man XF, Tan SW, Tang HN, et al. MiR-503 inhibits adipogenesis by targeting bone morphogenetic protein receptor 1a. Am J Transl Res. 2016;8:2727–2737.
16. Tang CY, Man XF, Guo Y, et al. IRS-2 partially compensates for the insulin signal defects in IRS-1(-/-) mice mediated by miR-33. Mol Cells. 2017;40:123–132. doi:10.14348/molcells.2017.2228
17. Ambros V. The functions of animal microRNAs. Nature. 2004;431:350–355. doi:10.1038/nature02871
18. Heneghan HM, Miller N, McAnena OJ, O’Brien T, Kerin MJ. Differential miRNA expression in omental adipose tissue and in the circulation of obese patients identifies novel metabolic biomarkers. J Clin Endocrinol Metab. 2011;96:E846–850. doi:10.1210/jc.2010-2701
19. Ortega FJ, Mercader JM, Catalan V, et al. Targeting the circulating microRNA signature of obesity. Clin Chem. 2013;59:781–792. doi:10.1373/clinchem.2012.195776
20. Snowhite IV, Allende G, Sosenko J, Pastori RL, Messinger Cayetano S, Pugliese A. Association of serum microRNAs with islet autoimmunity, disease progression and metabolic impairment in relatives at risk of type 1 diabetes. Diabetologia. 2017;60:1409–1422. doi:10.1007/s00125-017-4294-3
21. De Caestecker M. The transforming growth factor-β superfamily of receptors. Cytokine Growth Factor Rev. 2004;15:1–11. doi:10.1016/j.cytogfr.2003.10.004
22. Guiu-Jurado E, Unthan M, Bohler N, et al. Bone morphogenetic protein 2 (BMP2) may contribute to partition of energy storage into visceral and subcutaneous fat depots. Obesity (Silver Spring). 2016;24:2092–2100. doi:10.1002/oby.21571
23. Qian SW, Tang Y, Li X, et al. BMP4-mediated brown fat-like changes in white adipose tissue alter glucose and energy homeostasis. Proc Natl Acad Sci USA. 2013;110:E798–807. doi:10.1073/pnas.1215236110
24. Schulz TJ, Huang P, Huang TL, et al. Brown-fat paucity due to impaired BMP signalling induces compensatory browning of white fat. Nature. 2013;495:379–383. doi:10.1038/nature11943
25. Qingxian C, Fengjuan C, Tao W, et al. Obesity and COVID-19 severity in a designated hospital in Shenzhen, China. Diabetes Care. 2020;43:1392–1398. doi:10.2337/dc20-0576
26. Gautier A, Bonnet F, Dubois S, et al. Associations between visceral adipose tissue, inflammation and sex steroid concentrations in men. Clin Endocrinol (Oxf). 2013;78:373–378. doi:10.1111/j.1365-2265.2012.04401.x
27. Labruna G, Pasanisi F, Nardelli C, et al. High leptin/adiponectin ratio and serum triglycerides are associated with an “at-risk” phenotype in young severely obese patients. Obesity (Silver Spring). 2011;19:1492–1496. doi:10.1038/oby.2010.309
28. Hu L, Fengli H, Huang M, et al. NFATc3 deficiency reduces the classical activation of adipose tissue 2 macrophages. J Mol Endocrinol. 2018;61:79–89. doi:10.1530/JME-18-0070
29. Caterson ID, Gill TP. Obesity: epidemiology and possible prevention. Best Pract Res Clin Endocrinol Metab. 2002;16:595–610. doi:10.1053/beem.2002.0228
30. Nathaly TC, Wendy CP, Karina GB, et al. Waist circumference is an anthropometric parameter that identifies women with metabolically unhealthy phenotypes. Nutrients. 2018;10:447. doi:10.3390/nu10040447
31. Jamar G, Caranti DA, de Cassia Cesar H, Masquio DCL, Bandoni DH, Pisani LP. Leptin as a cardiovascular risk marker in metabolically healthy obese: hyperleptinemia in metabolically healthy obese. Appetite. 2017;108:477–482. doi:10.1016/j.appet.2016.11.013
32. Ahl S, Guenther M, Zhao S, et al. Adiponectin levels differentiate metabolically healthy vs unhealthy among obese and nonobese white individuals. J Clin Endocrinol Metab. 2015;100:4172–4180. doi:10.1210/jc.2015-2765
33. Gómez-Ambrosi J, Catalán, Rodríguez A, et al. Increased cardiometabolic risk factors and inflammation in adipose tissue in obese subjects classified as metabolically healthy. Diabetes Care. 2014;37(10):2813–2821. doi:10.2337/dc14-0937
34. Doumatey AP, Zhou J, Zhou M, Prieto D, Rotimi CN, Adeyemo A. Proinflammatory and lipid biomarkers mediate metabolically healthy obesity: a proteomics study. Obesity (Silver Spring). 2016;24:1257–1265. doi:10.1002/oby.21482
35. Berti L, Irmler M, Zdichavsky M, et al. Fibroblast growth factor 21 is elevated in metabolically unhealthy obesity and affects lipid deposition, adipogenesis, and adipokine secretion of human abdominal subcutaneous adipocytes. Mol Metab. 2015;4:519–527. doi:10.1016/j.molmet.2015.04.002
36. Pescador N, Perez-Barba M, Ibarra JM, Corbaton A, Martinez-Larrad MT, Serrano-Rios M. Serum circulating microRNA profiling for identification of potential type 2 diabetes and obesity biomarkers. PLoS One. 2013;8:e77251. doi:10.1371/journal.pone.0077251
37. Yu F, Hou J, Xuan W, Zhang C, Meng X. The relationship of plasma miR-503 and coronary collateral circulation in patients with coronary artery disease. Life Sci. 2018;207:145–151. doi:10.1016/j.lfs.2018.06.001
38. Stefan N, Kantartzis K, Machann J, et al. Identification and characterization of metabolically benign obesity in humans. Arch Intern Med. 2008;168:1609–1616. doi:10.1001/archinte.168.15.1609
39. Phillips CM, Dillon C, Harrington JM, et al. Defining metabolically healthy obesity: role of dietary and lifestyle factors. PLoS One. 2013;8:e76188. doi:10.1371/journal.pone.0076188
 © 2020 The Author(s). This work is published and licensed by Dove Medical Press Limited. The
full terms of this license are available at https://www.dovepress.com/terms
and incorporate the Creative Commons Attribution
- Non Commercial (unported, 3.0) License.
By accessing the work you hereby accept the Terms. Non-commercial uses of the work are permitted
without any further permission from Dove Medical Press Limited, provided the work is properly
attributed. For permission for commercial use of this work, please see paragraphs 4.2 and 5 of our Terms.
© 2020 The Author(s). This work is published and licensed by Dove Medical Press Limited. The
full terms of this license are available at https://www.dovepress.com/terms
and incorporate the Creative Commons Attribution
- Non Commercial (unported, 3.0) License.
By accessing the work you hereby accept the Terms. Non-commercial uses of the work are permitted
without any further permission from Dove Medical Press Limited, provided the work is properly
attributed. For permission for commercial use of this work, please see paragraphs 4.2 and 5 of our Terms.