Back to Journals » International Journal of General Medicine » Volume 14
Serum Metabolomics of Tick-Borne Encephalitis Based on Orbitrap-Mass Spectrometry
Authors Zhang M, Lu D, Sun H, Zheng H, Cang M, Du Y
Received 27 July 2021
Accepted for publication 27 October 2021
Published 10 November 2021 Volume 2021:14 Pages 7995—8005
DOI https://doi.org/10.2147/IJGM.S331374
Checked for plagiarism Yes
Review by Single anonymous peer review
Peer reviewer comments 2
Editor who approved publication: Dr Scott Fraser
Meng Zhang,1,* DeSheng Lu,2,* Hui Sun,2 HaiJun Zheng,2 Ming Cang,1 YanDan Du2
1State Key Laboratory of Reproductive Regulation and Breeding of Grassland Livestock, School of Life Sciences, Inner Mongolia University, Hohhot, 010070, People’s Republic of China; 2Department of Clinical Laboratory, Inner Mongolia Forestry General Hospital (The Second Clinical Medical School of Inner Mongolia, University for the Nationalities), Hulunbuir, Inner Mongolia, People’s Republic of China
*These authors contributed equally to this work
Correspondence: YanDan Du; Ming Cang Email [email protected]; [email protected]
Background: Tick-borne encephalitis virus (TBEV), the most prevalent arbovirus, causes potentially fatal encephalitis in humans. Prevalent in northeast China, tick-borne encephalitis (TBE) poses a major threat to public health, local economies and tourism. There are no biomarkers for TBE, which is classified serologically and clinically. Due to sample heterogeneity of samples and different detection platforms, obtaining stable markers is a great challenge for metabolomics. Accurate annotation is vital for data mining and interpretation.
Objective: To identify reliable biomarkers of TBEV infection.
Methods: An untargeted metabolomics analysis of serum from 30 TBE patients and 30 healthy controls was carried out. Liquid chromatography–mass spectrometry (LC-MS)-based metabolomics methods were used to characterize the subjects’ serum metabolic profiles and to screen and validate TBE biomarkers.
Results: A total of 3370 molecular features were extracted from each sample, and the peak intensity of each feature was obtained. Pattern analysis, principal component analysis, partial least squares discriminant analysis were used to screen for potential metabolites. Bilirubin, LysoPC (18:1[9Z]), palmitic acid, and CL (8:0/8:0/8:0/8:0) were significantly different. Pathway enrichment analysis showed that these metabolites were in the fatty acid biosynthesis and glycerophospholipid metabolism pathways. The phospholipid family had a significant difference in both the difference ratio and the abundance.
Conclusion: Phospholipids may be used to distinguish TBEV patients from healthy controls. TBEV infection affects the normal metabolic activity of host cells, providing insight into the pathogenesis of TBE.
Keywords: untargeted metabolomics, TBEV, diagnostic biomarkers
Introduction
Tick-borne encephalitis (TBE), also known as forest encephalitis, is the most prevalent arboviral disease affecting the human central nervous system (CNS) in northeastern China. The TBE virus (TBEV) vaccine has not been updated for more than 30 years. TBE was first reported in Australia and Russia in 1930.1 And the number of reported TBE cases increased rapidly in Europe and China, posing a major threat to public health.2,3 TBE has spread from forest to urban areas with the revitalization of tourism in northeast China.4 TBEV is a single-stranded, positive-sense RNA virus of the genus Flavivirus.5 TBEV exists as Far-Eastern, Siberian, and European serotypes, among which the Far-Eastern is the serious pathogenic.6 Most TBEV infections are asymptomatic at first and not easily detected. Symptoms range from sudden-onset fever with nausea, fatigue, headache, and joint-pain to severe neurological manifestations, such as meningitis and encephalitis.7,8
Metabolomics and lipidomics are the -omics techniques most closely related to phenotype capture the dynamic changes in metabolites at the system level in response to endogenous or exogenous disturbance.9–11 Metabolomics directly reflects metabolism,12 whereas lipidomics reflects changes in lipid content and composition.13 Lipids make up cellular membranes and function in energy storage and signal transduction to maintain cellular homeostasis. Virus infection disrupts cellular homeostasis, and the resulting inflammatory response can increase or decrease metabolite levels. Metabolomics provides insight into the mechanisms of disease processes. Therefore, endogenous metabolites may serve as indicators of pathogen metabolism during infection. High-performance liquid chromatography/quadrupole time-of-flight mass spectrometry (HPLC-Q-TOF/MS) has high sensitivity and specificity.14 Metabolomics enables identification of biomarkers of virus infection and associated pathologies.15–17 To date, few metabolomics analyses of TBE patients have been reported. To assess the metabolic profiles of TBE patients, we conducted untargeted metabolomics and lipidomics analyses of serum samples from TBE patients and healthy controls.18 In fact, to TBE patients, the virus is most concentrated in the cerebrospinal fluid. Dendritic cells in the skin are thought to be the initial cells involved in replication, by transporting the virus to nearby draining lymph nodes via the lymphatic system. After replication in the lymphatic organs, TBEV spreads through efferent lymphatics. Thus, CSF seems to be susceptible to neuropsychological dysfunction and offers a window into understanding the metabolic basis of neurological disorders.19 In TBE, cerebrospinal fluid samples are difficult to obtain due to patient compliance.
In the present study, we continued to do validation experiment with new platforms for serum sample queue. The biomarkers conducted by this research were combined the previous study to obtain an intersection of biomarker data to further verify the reliability of the results. In this study, we attempted to confirm several hallmark metabolites in the serum of TBEV patients and consequently evaluated the pathology and diagnostic biomarkers of TBE.
Materials and Methods
Ethics Statement
Ethical approval of the study was obtained from the Ethics Committee of Inner Mongolia Forestry General Hospital, and all eligible individuals provided written informed consent. The study was conducted in accordance with the Declaration of Helsinki. All information about the participants was anonymized.
Study Design
From April 2018 to August 2018, 30 TBE patients and 30 healthy controls (attendees at an annual hospital staff examination), who were matched for sex and age, were selected from Inner Mongolia Forestry General Hospital (Table 1). Young teenagers were excluded because the response to TBEV differs according to age. Patients were enrolled based on the occupational forest encephalitis diagnostic criteria (GBZ88-2002). Mild forest encephalitis has a sudden onset, with fever, headache, nausea, vomiting, and other symptoms. The body temperature usually normalizes within a week. Forest encephalitis can be diagnosed by an IgG/IgM ratio≥ 1:20. Compared with mild forest encephalitis, moderate forest encephalitis has more severe symptoms, including neck stiffness and signs of meningeal irritation, including positive Kernig’s and Brudzinski’s signs. Severe forest encephalitis has worse symptoms, including delayed paralysis of the neck, shoulder, or limb muscles, dysphagia, speech disorder, altered consciousness or convulsions, and respiratory failure. Venous blood samples were collected at admission. Some enrolled patients had received treatment at a clinic, such as injections or anti-inflammatory drugs, before being admitted to the hospital. The patients tested positive for dengue IgG and IgM in acute sera using a commercial enzyme-linked immunosorbent assay kit (Pan-Bio, Brisbane, Australia).
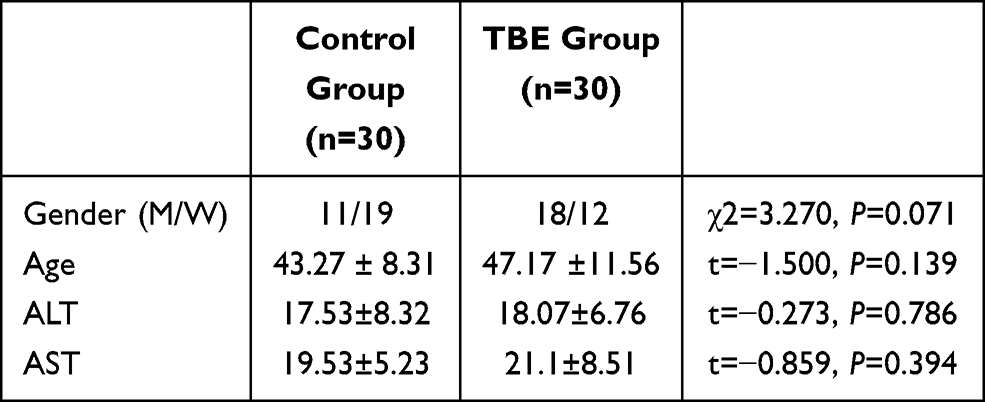 |
Table 1 Sample Grouping Schedule of Healthy Subjects and TBE Patients Enrolled in This Study |
Sample Preparation
Serum samples were collected according to the ethical standards of Inner Mongolia Forestry General Hospital. A vacuum container was used to collect about 5 mL blood from each participant. Serological detection of participants was performed immediately after centrifugation and samples were stored at –80°C prior to LC-MS. The samples were thawed at room temperature and 100 μL was transferred to EP tubes and mixed with 300 μL methanol. The mixture was centrifuged at 10, 000 rpm for 30 min at 4 °C. The supernatant was filtered through a 0.22 μm membrane to HPLC-TOF/MS. To avoid batch effects, the sample sequence was randomized. To monitor system stability in real-time, quality control (QC) samples of equal volumes to the participant samples were interspersed at the beginning, middle, and end of the sequence.20
HPLC-Q-TOF/MS Analysis
Metabolic profiling of serum samples was performed using an LC (Thermo Fisher Scientific, Germering, Germany) coupled online to a hybrid linear ion trap/ Orbitrap mass spectrometer (LTQ-Orbitrap-XL system, Thermo Fisher Scientific, Bremen, Germany). Samples were loaded onto a reverse-phase C18 column (1.9 um, 2.1 mm i.d. × 150 mm). The column temperature was set at 4 °C. The mobile phases of 0.1% formic acid in water (A) and 0.1% formic acid in acetonitrile (B) were used in positive ionization mode. In the positive model, the elution gradient started with 5% B for 3.5 min, was linearly increased to 95% B at 10 min, was maintained for 3 min, and then was returned to 5% for 2.5 min. The flow rate was set to 200 μL/min, and a 10 μL aliquot of each sample was injected into the column. TOF/MS was performed in positive mode. Electrospray ionization source conditions were as follows: ion source voltage, 4.8 kV; capillary voltage, 7 V; cone voltage, 50 V. Analyses were performed over a mass range of 50 to 1000 m/z (mass-to-charge ratio).
Data Pretreatment and Statistical Analysis
The raw metabolomics datasets were converted into mzData format via the open-source software MS-Dial 3.82 for peak picking. The export files of MS runs were aligned using various forms of chromatography mass spectrometry (XCMS version 1.26.0), an R-based platform for raw LC-MS data processing and visualization, following retention time correction, data filtering, and feature extraction. For MS peak alignment, the parameters of mass tolerance and retention time (RT) tolerance were set to 0.25 Da and 30 s, respectively. The goal was to correct the shift in RT and reduce signal redundancy. The algorithm and parameters used for peak detection were as follows: minimum peak width, 5 s; maximum peak width, 20 s; ppm deviation, 5 ppm; signal-to-noise threshold (snthresh), 4. Then, the three dimensional matrix table was imported into Metaboanalyst (version 4.0), an online software package for multivariate data analysis. Sum, log-transformation, and pareto-scaled algorithms were sequentially applied for normalization to reduce systematic bias and ensure data consistency. Principal component analysis was used as an unbiased statistical method to generate a map of the healthy controls and TBEV patients. PCA was applied to confirm the quality of the datasets via the clustering degree of QC samples and visualize differences between groups of samples in the unsupervised analysis. To distinguish between TBEV patients and the healthy controls, supervised multivariate analysis and orthogonal partial least squares data analysis (OPLS-DA) were conducted to identify potential metabolites. The significance of the biomarkers was assessed by calculating the variable importance in projection (VIP) score (>1), measures of the contribution to sample separation in the OPLS-DA analysis. A t-test was performed to identify metabolites that differed significantly between the groups (p<0.05). The fold change threshold was used to differentiate the groups.
Pathway Analysis and Interaction Networks
The metabolites were mapped to metabolic pathways using MetaboAnalyst 5.0 (www.metaboanalyst.ca)21 and LIPID MAPS Lipidomics Gateway (http://www.lipidmaps.org/). Enrichment analysis was performed via topology analysis accounting for the positions of significant metabolites in metabolic pathways. Two indexes were estimated in the topology analysis: the centrality and the pathway impact. The centrality measures the number of shortest paths going through the target metabolite, and is employed to assess the significance of each metabolite within a specific pathway. The pathway impact is the cumulative value of the significant metabolites.22
Results
Serum Metabolome and Reproducibility
The serum metabolic markers identified are displayed in Figure 1. The pretreated datasets obtained via the LC-MS platform were used to create PCA models (Figure 2). All QC injections were tightly clustered, indicating their reliability and the stability and reproducibility of the analysis. The retention time shifts, and the total ion chromatogram peak areas of the QC sample, demonstrated slight changes, suggesting good overall reproducibility.
 |
Figure 1 Chromatograms representing serum metabolic fingerprints of TBE patient samples and control samples obtained with LC-MS in positive ionization mode on reverse C18 column. (A) TBE patient sample; (B) control sample. |
 |
Figure 2 PCA models built on metabolomics data obtained with LC-ESI-MS analysis in positive mode (PC1=32.6%, PC2=14.4%). Red, green and blue solid circles correspond to control, QC and TBE samples respectively. |
Untargeted Metabolomics Analysis
To distinguish ion peaks that could be used to differentiate between TBE patients and healthy controls, we generated a supervised OPLS-DA model centered on the objective class discriminating variation. Separation was observed between the TBE patients and healthy controls. The goodness of fit (R2) and predictive power of the model (Q2) by the first components were 0.928 and 0.908 for differentiating TBE patients and healthy controls, respectively (Figure 3A). To verify whether the OPLS-DA model was overfitted, the model was verified to ensure the reliability of subsequent results. The permutation test was set to 200 times. The Q2 intercept was less than the R2 value, and the Q2 value was < 0.05, indicating the effectiveness of the OPLS-DA model (Figure 3B).
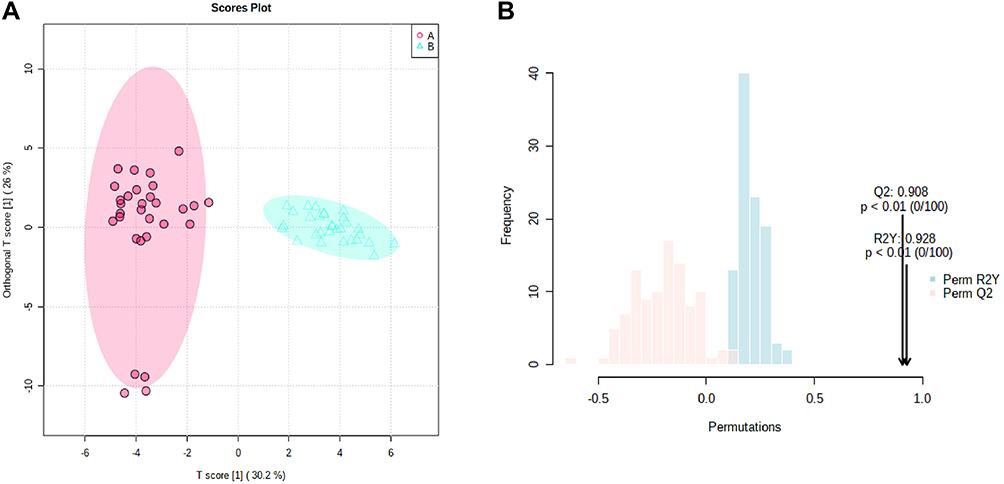 |
Figure 3 (A) OPLS models based on metabolomics data obtained with LC-ESI-MS analysis in positive mode on reverse C18 column. Red and jade-green solid circles correspond to TBE and control samples respectively. (B) 200-time permutation test was used to validate the corresponding model. |
Identification of Differential Serum Metabolites and Pathway Analysis
Next, we identified serum metabolites whose levels differed between the TBE patients and healthy controls (Table 2). The metabolites LysoPC (18:1(9Z)), CL.3-O-sulfogalactosylceramide and PE (P-16:0e/0:0) and LysoPC (15:0) were significantly (12.84-, 7.62-, 7.57-and 7.01-fold, respectively) different between the groups (Table 2). The heatmap shows the concentration changes of potential biomarkers in each group (Figure 4).
 |
Table 2 Identified Metabolites of TBE Serum from LC-MS Analysis Based on Reverse C18 Column in Positive Mode |
 |
Figure 4 Significant metabolites that distinguish TBE patients from control group. Two-way hierarchical cluster analysis (HCA) using C18 chromatography shows clusters of metabolites from human serum and illustrates the patterns distinguishing those with TBE from control group (A: shown in TBE patient sample; B: shown in control group). |
We performed a KEGG analysis of the pathways affected by TBE (Figure 5). The overexpressed metabolites were enriched mainly in the lipid metabolism pathway, which is associated with the virus infection and the host response. The metabolite network manifested that the most vital changes occurred in lipid metabolism, the major altered pathway phenomenon are summarized in Figure 6.
 |
Figure 5 Graphic representation of the pathway analysis of significantly altered metabolites. (A: Glycerophospholipid metabolism; B: sphingolipid metabolism; C: glycerolipid metabolism; D: phosphatidylinositol signaling system; E: biosynthesis of unsaturated fatty acids; F: fatty acid elongation). |
 |
Figure 6 (A) Diagram of illustrating of the cycle of flavivirus and potential lipid modifications that enrolled in inhibition viral entry, membrane fusion, and viral replications. (B) Abundances analysis of the potential biomarkers in TBE patients compared to control group. (C) Major altered lipid pathways in TBE patients. |
Screening for Cluster of Potential Biomarkers
An independent cohort of 25 identified markers was further used to match the result of the previous study to evaluate the diagnostic performance of the biomarker panel. Finally, a biomarker panel of PE (P-16:0e/0:0) and bilirubin, capable of discriminating TBE form those healthy participants, was selected as potential biomarkers.
Discussion
TBE is often a self-limiting illness, but may cause permanent disability or death. Little is known about the molecular mechanisms that govern the potential ability of humans to defend against the virus and the ability of the virus to infect humans. Diagnosis of TBE relies on serological testing (including the IgG:IgM ratio) as well as other clinical features, such as fever, headache, and nausea, and advanced molecular methods are awaited.23,24 False-negative or false-positive results and methodological shortcomings may impede prompt diagnosis and management of TBE.25 Tick encephalitis infection does not have a high viral load in the blood. Therefore, a sensitive, robust method is required. Knowledge of how humans defend against and recover from TBEV infection is crucial for improving our understanding of TBE. In this study, we sought to establish and characterize a biomarker cluster of TBEV infection in humans and to decipher the relation between virus and host. Virus infection alters the host metabolome by up- or down-regulating metabolic processes, such as amino acids metabolism, energy metabolism, tricarboxylic acid cycle, and lipid metabolism.26–28 Biological fluids (eg, serum, urine) contain metabolites whose variation reflects health status. Thus, substances found in biological fluids at a given time can mirror the metabolic characteristics of that state. In this study, metabolomics was used to comprehend the global metabolomic changes that occur in TBEV patients, through which we identified metabolic biomarkers that are specific to TBEV infection. Enrichment analysis was performed for potential biomarkers, enabling us to identify metabolic pathways that are altered during TBEV infection.
Using a Thermo Fisher commercial platform, 25 serum metabolites were changed significantly. Lipids accounted for more than half of the identified biomarkers. Lipid mediators have important roles in inflammation and its resolution, indicating a stress response by the host to excessive inflammation to prevent excess damage by TBEV infection. The altered metabolites may serve as “auxiliary diagnostic markers” of a disease and provide insights into its progression. Metabolomics screening is important in metabolomics experiments, and the identification of metabolites is the main bottleneck in the determination of their biological role.
In a previous study, we used multiple separation platforms compared to only one in this work (reverse C18 column). It is important to obtain reproducible metabolic markers in metabolomics due to the differences in separation platforms and sample heterogeneity. To examine metabolic differences, we examined the intersection of experiments. Although some useful information may be lost, the use of multiple separation platforms generates overlapping and redundant signals. Therefore, we used a single platform and OPLS-DA and found clear separation between TBEV patients and healthy controls. Hence, exploring the physiological effects of TBEV infection is crucial for understanding the responses to other flaviviruses.
These results provide proof of concept that perturbation of the serum metabolome is associated with TBEV infection and disease outcome. Unfortunately, the identified metabolites may not be unique to TBEV infection. However, in this retrospective proof of concept, no detailed serological information and immune index were collected to establish relations with the metabolic profile. This is the most convincing way to establish relationships between immune factors and metabolites. In subsequent experiments, we will obtain more relevant data and increases the sample size to improve the reliability.
The response to TBE infection is initially pro-inflammatory and subsequently anti-inflammatory.29 The acute inflammatory reaction mediates pathogen killing, whereas the concurrent anti- and pro-inflammatory processes prevent injury to the host.
In the present study, some metabolites were upregulated and others were downregulated in TBE patients. More specifically, phospholipids showed the greatest variation between the groups. We did not subdivide the participants according to the disease course. Lipids were involved in several functions during the disease course, and were not consistently down-regulated. Phospholipids are the smallest structural units of cell membranes and have C16, C18, C36, and C38 unsaturated acyl chains. Phospholipids are precursors of lipid mediators, such as platelet- activating factors (PAFs) and eicosanoids, which are involved in inflammatory responses.30,31 Being the structural basis of cell and viral membranes, lipids play a core role in the first step of viral infection.32 To initiate infection, a virus must transmit genetic information to the host cell, and so an enveloped virus must first fuse its membrane with that of the target cell. Lipids can serve as direct receptors or entry co-factors for viruses at the cell surface or in endosomes.33,34 Virus entry depends on membrane fusion via endocytosis, in which lipid rafts (sphingolipid-, cholesterol-, and protein-rich microdomains) of the cell membrane are crucial.35,36 The internalized virus is transported to the endosomal system. Virally infected cells have disrupted homeostasis because of the need to meet the anabolic demand of viral replication.37–40 Flaviviruses capture host intracellular membranes to create double-membrane vesicles (DMVs) for viral genome amplification. Viruses require a certain phospholipid composition to establish integrated replicative organelles. In addition, a supply of energy is vital for vital replication. Moreover, lipids modulate the cellular distribution of viral proteins, in addition to the assembly, transition and release of viral particles.41,42
In brief, lipid metabolism plays an important role in viral infection. Lipids are important components of cell membranes, which not only act as virus receptors but also regulate cell fluidity and homeostasis. Lipids supply energy, and regulate the distribution of virus proteins, hence the altered lipid profile during virus infection.
Bilirubin, a product of heme metabolism is crucial for regulating oxidative stress and the immune response. Recently, bilirubin was recognized as an immunomodulatory metabolite that alters CD4+ T lymphocyte (TL) function by promoting the induction of de novo regulatory T cells (Tregs) in murine models; and this correlates with an increase in the proportion of Tregs in cirrhotic patients. Bilirubin is also a powerful antioxidant, possessing physiological properties akin to the antioxidants Vitamin C and Vitamin E. Most importantly, bilirubin can counter the oxidative damage caused by free radicals generated from the peroxisome, which can effectively inhibit the oxidation of LDL at nearly physiological serum levels.43 The powerful antioxidant effect of bilirubin was verified by showing that asymptomatic males with low total bilirubin levels have more severe coronary artery disease on angiography. Furthermore, a low total serum bilirubin is a significant, independent risk factor that is almost as powerful as smoking or high blood pressure.44 Research has examined bilirubin in therapy. HO-1, the target of bilirubin, is under investigation as a therapeutic target in coronary artery disease, via the regulation of biliverdin reductase.45 Our results indicated that bilirubin levels tended to decrease during the pyrogenic phase of TBEV infection, hinting at its conflicting roles in immune ability and oxidation resistance.
Conclusions
In summary, a biomarker panel consisting of lipids and biliverdin was defined and validated as an effective tool for detecting TBE in a multi-center cross-sectional study. The biomarker could discriminate patients from a control group. Its diagnostic performance in tandem with antibody detection was more accurate. This panel might reveal more about the development of TBE and might be useful in the surveillance of patients with TBE.
Funding
This study was funded by grants from Natural Science Foundation of Inner Mongolia (No. 2019MS08174).
Disclosure
The authors have declared that no competing interests exist.
References
1. Zlobin VI, Pogodina VV, Kahl O. A brief history of the discovery of tick-borne encephalitis virus in the late 1930s (based on reminiscences of members of the expeditions, their colleagues, and relatives). Ticks Tick Borne Dis. 2017;8:813–820. doi:10.1016/j.ttbdis.2017.05.001
2. Ruzek D, Dobler G, Donoso Mantke O. Tick-borne encephalitis: pathogenesis and clinical implications. Travel Med Infect Dis. 2010;8:223–232. doi:10.1016/j.tmaid.2010.06.004
3. Bogovic P, Lusa L, Korva M, et al. Inflammatory immune responses in patients with tick-borne encephalitis: dynamics and association with the outcome of the disease. Microorganisms. 2019;7:514.
4. Yoshii K, Song JY, Park SB. Tick-borne encephalitis in Japan, Republic of Korea and China. Emerg Microbes Infect. 2017;6:e82.
5. Gerd W, Gisela W, Gross J. Studies on virus-specific nucleic acids synthesized in vertebrate and mosquito cells infected with flaviviruses. Virology. 1978;89:423–437. doi:10.1016/0042-6822(78)90185-X
6. Gritsun TS, Lashkevich VA, Gould EA. Tick-borne encephalitis. Antiviral Res. 2003;57:129–146. doi:10.1016/S0166-3542(02)00206-1
7. Chen J, Zhao X, Fritsche J, et al. Practical approach for the identification and isomer elucidation of biomarkers detected in a metabonomic study for the discovery of individuals at risk for diabetes by integrating the chromatographic and mass spectrometric information. Anal Chem. 2008;80:1280–1289. doi:10.1021/ac702089h
8. Reinhard K. The clinical and epidemiological profile of tick-borne encephalitis in southern Germany 1994-98: a prospective study of 656 patients. Brain. 1999;122:2067–2078. doi:10.1093/brain/122.11.2067
9. Johnson CH, Ivanisevic J, Siuzdak G. Metabolomics: beyond biomarkers and towards mechanisms. Nat Rev Mol Cell Biol. 2016;17(7):451–459. doi:10.1038/nrm.2016.25
10. Patti GJ, Yanes O, Siuzdak G. Innovation: metabolomics: the apogee of the omics trilogy. Nat Rev Mol Cell Biol. 2012;13:263–269. doi:10.1038/nrm3314
11. Oliver F. Metabolomics the link between genotypes and phenotypes. Plant Mol Biol. 2002;48:155–171. doi:10.1023/A:1013713905833
12. Lains I, Gantner M, Murinello S, et al. Metabolomics in the study of retinal health and disease. Prog Retin Eye Res. 2019;69:57–79. doi:10.1016/j.preteyeres.2018.11.002
13. Zullig T, Trotzmuller M, Kofeler HC. Lipidomics from sample preparation to data analysis: a primer. Anal Bioanal Chem. 2020;412:2191–2209. doi:10.1007/s00216-019-02241-y
14. Zhu Y, Li L, Zhang G, et al. Metabolic characterization of pyrotinib in humans by ultra-performance liquid chromatography/quadrupole time-of-flight mass spectrometry. J Chromatogr B Analyt Technol Biomed Life Sci. 2016;1033-1034:117–127. doi:10.1016/j.jchromb.2016.08.009
15. Adebayo AS, Mundhe SD, Awobode HO, et al. Metabolite profiling for biomarkers in Schistosoma haematobium infection and associated bladder pathologies. PLoS Negl Trop Dis. 2018;12:e0006452. doi:10.1371/journal.pntd.0006452
16. Wang Z, Li MY, Peng B, et al. GC-MS-based metabolome and metabolite regulation in serum-resistant Streptococcus agalactiae. J Proteome Res. 2016;15:2246–2253. doi:10.1021/acs.jproteome.6b00215
17. Du CC, Yang MJ, Li MY, et al. Metabolic mechanism for l-leucine-induced metabolome to eliminate Streptococcus iniae. J Proteome Res. 2017;16:1880–1889. doi:10.1021/acs.jproteome.6b00944
18. Du Y, Mi Z, Xie Y, et al. Insights into the molecular basis of tick-borne encephalitis from multiplatform metabolomics. PLoS Negl Trop Dis. 2021;15:e0009172. doi:10.1371/journal.pntd.0009172
19. Al-Mekhlafi A, Suhs KW, Schuchardt S, et al. Elevated free phosphatidylcholine levels in cerebrospinal fluid distinguish bacterial from viral CNS infections. Cells. 2021;10(5):1115. doi:10.3390/cells10051115
20. Ma N, Karam I, Liu XW, et al. UPLC-Q-TOF/MS-based urine and plasma metabonomics study on the ameliorative effects of aspirin eugenol ester in hyperlipidemia rats. Toxicol Appl Pharmacol. 2017;332:40–51. doi:10.1016/j.taap.2017.07.013
21. Chong J, Wishart DS, Xia J. Using MetaboAnalyst 4.0 for comprehensive and integrative metabolomics data analysis. Curr Protoc Bioinformatics. 2019;68:e86. doi:10.1002/cpbi.86
22. Beale DJ, Oh DY, Karpe AV, et al. Untargeted metabolomics analysis of the upper respiratory tract of ferrets following influenza A virus infection and oseltamivir treatment. Metabolomics. 2019;15:33. doi:10.1007/s11306-019-1499-0
23. Jaaskelainen AJ, Korhonen EM, Huhtamo E, et al. Validation of serological and molecular methods for diagnosis of zika virus infections. J Virol Methods. 2019;263:68–74. doi:10.1016/j.jviromet.2018.10.011
24. Pasquier C, Joguet G, Mengelle C, et al. Kinetics of anti-ZIKV antibodies after Zika infection using two commercial enzyme-linked immunoassays. Diagn Microbiol Infect Dis. 2018;90:26–30. doi:10.1016/j.diagmicrobio.2017.09.001
25. Liu LL, Lin LR, Tong ML, et al. Incidence and risk factors for the prozone phenomenon in serologic testing for syphilis in a large cohort. Clin Infect Dis. 2014;59:384–389. doi:10.1093/cid/ciu325
26. Shen B, Yi X, Sun Y, et al. Proteomic and metabolomic characterization of COVID-19 patient sera. Cell. 2020;182:59–72 e15. doi:10.1016/j.cell.2020.05.032
27. Cui L, Hou J, Fang J, et al. Serum metabolomics investigation of humanized mouse model of dengue virus infection. J Virol. 2017;91:e00386.
28. Keshavarz M, Solaymani-Mohammadi F, Namdari H, et al. Metabolic host response and therapeutic approaches to influenza infection. Cell Mol Biol Lett. 2020;25:15. doi:10.1186/s11658-020-00211-2
29. Mathew A, Rothman AL. Understanding the contribution of cellular immunity to dengue disease pathogenesis. Immunol Rev. 2008;223:300–313. doi:10.1111/j.1600-065X.2008.00678.x
30. Liu Y, Hong Z, Tan G, et al. NMR and LC/MS-based global metabolomics to identify serum biomarkers differentiating hepatocellular carcinoma from liver cirrhosis. Int J Cancer. 2014;135:658–668. doi:10.1002/ijc.28706
31. Jia L, Wang C, Zhao S. Metabolomic identification of potential phospholipid biomarkers for chronic glomerulonephritis by using high performance liquid chromatography-mass spectrometry. J Chromatogr B Analyt Technol Biomed Life Sci. 2007;860:134–140. doi:10.1016/j.jchromb.2007.10.033
32. Lorizate M, Krausslich HG. Role of lipids in virus replication. Cold Spring Harb Perspect Biol. 2011;3:a004820. doi:10.1101/cshperspect.a004820
33. Bagam P, Singh DP, Inda ME. Unraveling the role of membrane microdomains during microbial infections. Cell Biol Toxicol. 2017;33:429–455.
34. Taube S, Jiang M, Wobus CE. Glycosphingolipids as receptors for non-enveloped viruses. Viruses. 2010;2(4):1011–1049. doi:10.3390/v2041011
35. Marsh M, Helenius A. Virus entry: open sesame. Cell. 2006;124(4):729–740. doi:10.1016/j.cell.2006.02.007
36. Mercer J, Helenius A. Virus entry by macropinocytosis. Nat Cell Biol. 2009;11:510–520. doi:10.1038/ncb0509-510
37. Gualdoni GA, Mayer KA, Kapsch AM, et al. Rhinovirus induces an anabolic reprogramming in host cell metabolism essential for viral replication. Proc Natl Acad Sci USA. 2018;115:E7158–E7165. doi:10.1073/pnas.1800525115
38. Nagy PD, Strating JR, Kuppeveld F Building viral replication organelles: close encounters of the membrane types. PLoS Pathog. 2016;12:e1005912. doi:10.1371/journal.ppat.1005912
39. Hsu NY, Ilnytska O, Belov G, et al. Viral reorganization of the secretory pathway generates distinct organelles for RNA replication. Cell. 2010;141:799–811. doi:10.1016/j.cell.2010.03.050
40. Diamond DL, Syder AJ, Jacobs JM, et al. Temporal proteome and lipidome profiles reveal hepatitis C virus-associated reprogramming of hepatocellular metabolism and bioenergetics. PLoS Pathog. 2010;6:e1000719. doi:10.1371/journal.ppat.1000719
41. Ono A, Ablan SD, Lockett SJ. Phosphatidylinositol (4,5) bisphosphate regulates HIV-1 Gag targeting to the plasma membrane. Proc Natl Acad Sci. 2004;101:14889–14894. doi:10.1073/pnas.0405596101
42. Zhang J, Pekosz A, Lamb RA. Influenza virus assembly and lipid raft microdomains: a role for the cytoplasmic tails of the spike glycoproteins. J Virol Methods. 2000;74:4634–4644. doi:10.1128/JVI.74.10.4634-4644.2000
43. Jangi S, Otterbein L, Robson S. The molecular basis for the immunomodulatory activities of unconjugated bilirubin. Int J Biochem Cell Biol. 2013;45:2843–2851. doi:10.1016/j.biocel.2013.09.014
44. Schwertner A, Jackson WG, Tolan G. Association of low serum concentration of bilirubin with increased risk of coronary artery disease. Clin Chem. 1994;40(1):18–23. doi:10.1093/clinchem/40.1.18
45. Wu Ben J, Chen K, Barter Philip J. Niacin inhibits vascular inflammation via the induction of heme oxygenase-1. Circulation. 2012;125:150–158. doi:10.1161/CIRCULATIONAHA.111.053108
 © 2021 The Author(s). This work is published and licensed by Dove Medical Press Limited. The
full terms of this license are available at https://www.dovepress.com/terms
and incorporate the Creative Commons Attribution
- Non Commercial (unported, 3.0) License.
By accessing the work you hereby accept the Terms. Non-commercial uses of the work are permitted
without any further permission from Dove Medical Press Limited, provided the work is properly
attributed. For permission for commercial use of this work, please see paragraphs 4.2 and 5 of our Terms.
© 2021 The Author(s). This work is published and licensed by Dove Medical Press Limited. The
full terms of this license are available at https://www.dovepress.com/terms
and incorporate the Creative Commons Attribution
- Non Commercial (unported, 3.0) License.
By accessing the work you hereby accept the Terms. Non-commercial uses of the work are permitted
without any further permission from Dove Medical Press Limited, provided the work is properly
attributed. For permission for commercial use of this work, please see paragraphs 4.2 and 5 of our Terms.