Back to Journals » International Journal of Chronic Obstructive Pulmonary Disease » Volume 16
Serum Creatinine/Cystatin C Ratio Associated with Cross-Sectional Area of Erector Spinae Muscles and Pulmonary Function in Patients with Chronic Obstructive Pulmonary Disease
Authors Nishiki K, Nojiri M, Kato R, Shinomiya S, Oikawa T, Ishizaki T, Toga H, Mizuno S
Received 14 September 2021
Accepted for publication 6 December 2021
Published 24 December 2021 Volume 2021:16 Pages 3513—3524
DOI https://doi.org/10.2147/COPD.S339243
Checked for plagiarism Yes
Review by Single anonymous peer review
Peer reviewer comments 2
Editor who approved publication: Prof. Dr. Richard Russell
Kazuaki Nishiki, Masafumi Nojiri, Ryo Kato, Shohei Shinomiya, Taku Oikawa, Takeshi Ishizaki, Hirohisa Toga, Shiro Mizuno
Department of Respiratory Medicine, Kanazawa Medical University, Ishikawa, Japan
Correspondence: Shiro Mizuno
Department of Respiratory Medicine, Kanazawa Medical University, 1-1 Daigaku, Uchinada, Kahoku-gun, Ishikawa, 920-0293, Japan
Tel +81-76-218-8157
Fax +81-76-286-0980
Email [email protected]
Purpose: Muscle atrophy is a major clinical feature of chronic obstructive pulmonary disease (COPD) and is considered a predictor of mortality in COPD patients. Recently, the cross-sectional area (CSA) of the erector spinae muscles measured by chest computed tomography (CT) scans (ESMCSA) has been reported as a clinical parameter reflecting disease severity and future prognosis in patients with COPD. In addition, the serum creatinine (Cr)/cystatin C (CysC) ratio has been considered a quantitative marker of residual muscle mass, because serum Cr levels are affected by muscle mass, and correction by CysC counteracts the effect of renal function on serum Cr levels. The purpose of this study was to assess whether the serum Cr level corrected by serum CysC can be used as a predictive marker of pulmonary function and disease severity in patients with COPD.
Patients and Methods: A total of 99 patients without COPD and 201 patients with COPD, with a smoking history of more than 10 pack-years were enrolled in this study, and serum Cr and CysC levels were measured. On chest high-resolution CT images, %low attenuation area (LAA%) (≤ 960 Hounsfield units (HU)) and ESMCSA at the Th12 level were identified.
Results: There was a significant correlation between the ESMCSA and the Cr/CysC ratio. The Cr/CysC ratio was significantly associated with forced vital capacity (FVC) and forced expiratory volume in 1 second (FEV1) values, especially in former smokers.
Conclusion: The serum Cr/CysC ratio could be a convenient substitute for the measurement of muscle atrophy and pulmonary function testing in patients with COPD.
Keywords: muscle atrophy, low attenuation area, sarcopenia, smoking status
Introduction
Muscle atrophy is a major clinical feature of chronic obstructive pulmonary disease (COPD), and it is considered a strong predictor of mortality in COPD patients.1–3 Bioelectrical impedance analysis, dual-energy X-ray absorptiometry, magnetic resonance imaging, B-mode ultrasound, and measurement of the cross-sectional area (CSA) of skeletal muscles such as the psoas muscles, intercostal muscles, abdominal muscles, or leg muscles on computed tomography (CT) scans are widely used to quantify both total and local skeletal muscle mass,4–11 and these muscles are known to reflect patient s’ physical activity levels.12 There is a strong correlation between the area of the psoas muscles and that of the dorsal muscles, which can be assessed by chest CT scans,13 and CSA of the erector spinae muscle group (ESMCSA) measured by chest CT scans has been reported as a clinical parameter of disease severity and future prognosis in patients with COPD.14 However, although measurement of the area of these muscle groups could provide accurate estimates of muscle atrophy in COPD patients, it may cause problems due to cost and possible radiation exposure, and it has limited accessibility for follow-up and epidemiological surveillance.
The prevalence of chronic renal failure in patients with COPD is underestimated when diagnosed by serum creatinine (Cr) levels because of reduced skeletal muscle mass.15 It becomes apparent that chronic renal dysfunction is a common comorbidity of COPD when renal function is measured by the glomerular filtration rate (GFR) or serum cystatin C (CysC), a surrogate marker for the GFR.15,16 Serum Cr is the most commonly used parameter of renal function in clinical practice, but the serum and urinary Cr levels are affected by muscle mass.17 Conversely, the serum Cr levels could be a useful blood biomarker that reflects muscle mass in patients with normal renal function.18 Currently, CysC has been receiving considerable attention as a surrogate marker for GFR,19 since it is not affected by muscle mass. The CysC-based estimated GFR (eGFR) is thought to be more appropriate for elderly persons who are susceptible to sarcopenia and COPD.15,20,21 Recently, the Cr/CysC ratio has been considered to be a quantitative marker of residual muscle mass and adverse effects of chemotherapy in patients with lung cancer, because serum Cr levels corrected by CysC are independent of renal function and are, theoretically, correlated with the muscle mass.22
The purpose of this study was to assess whether the serum Cr level corrected by serum CysC can be used as a predictive marker of pulmonary function and disease severity in patients with COPD. We hypothesized that the serum Cr/CysC ratio is a convenient and substitute biomarker for the measurement of ESMCSA in patients with COPD, which is considered a valuable clinical parameter that correlates with symptoms and disease prognosis.
Patients and Methods
Patients
From December 2015 to November 2017, 372 patients were recruited from the outpatient department of the Department of Respiratory Medicine, Kanazawa Medical University Hospital. The inclusion criteria for enrollment were: age >40 years; at least a 10 pack-year history of smoking; and meeting the Global Initiative for Obstructive Lung Disease (GOLD) stage criteria for COPD based on post-bronchodilator spirometry. Two patients on hemodialysis for chronic renal failure were excluded. Seventy patients were also excluded because of having had any cancer across the entire lifespan. Ultimately, 300 patients participated in the present study. The study was approved by the Research Ethics Committee of Kanazawa Medical University (Protocol: No. I100), and all subjects gave their written, informed consent. This study was conducted in accordance with the Declaration of Helsinki.
The estimated glomerular filtration rate (eGFR) was calculated based on serum Cr and serum CysC levels using the following equations according to the guideline of the Japanese Society of Nephrology:
eGFR based on serum Cr (eGFRCr) level = 194× Cr−1.094× Age−0.287 (mL/min/1.73 m2) for men and 194× Cr−1.094× Age−0.287×0.739 (mL/min/1.73 m2) for women,
eGFR based on serum CysC (eGFRCys) level = (104× CysC−1.019×0.996Age) −8 (mL/min/1.73 m2) for men and (104× CysC−1.019×0.996Age ×0.929) −8 (mL/min/1.73 m2) for women.
Pulmonary Function Tests
Pulmonary function tests were performed to determine forced vital capacity (FVC) and forced expiratory volume in 1 second (FEV1). The predicted pulmonary function values were calculated according to the Japanese Respiratory Society guidelines.23 The diagnosis of COPD was made based on the clinical history, physical examination, and spirometric data, following the GOLD classification.24 This study included 201 patients with COPD and 99 smokers without COPD. The COPD patients were classified into 3 categories (mild, stage I; moderate, stage II; severe, stages III and IV) based on spirometric data (Table 1).
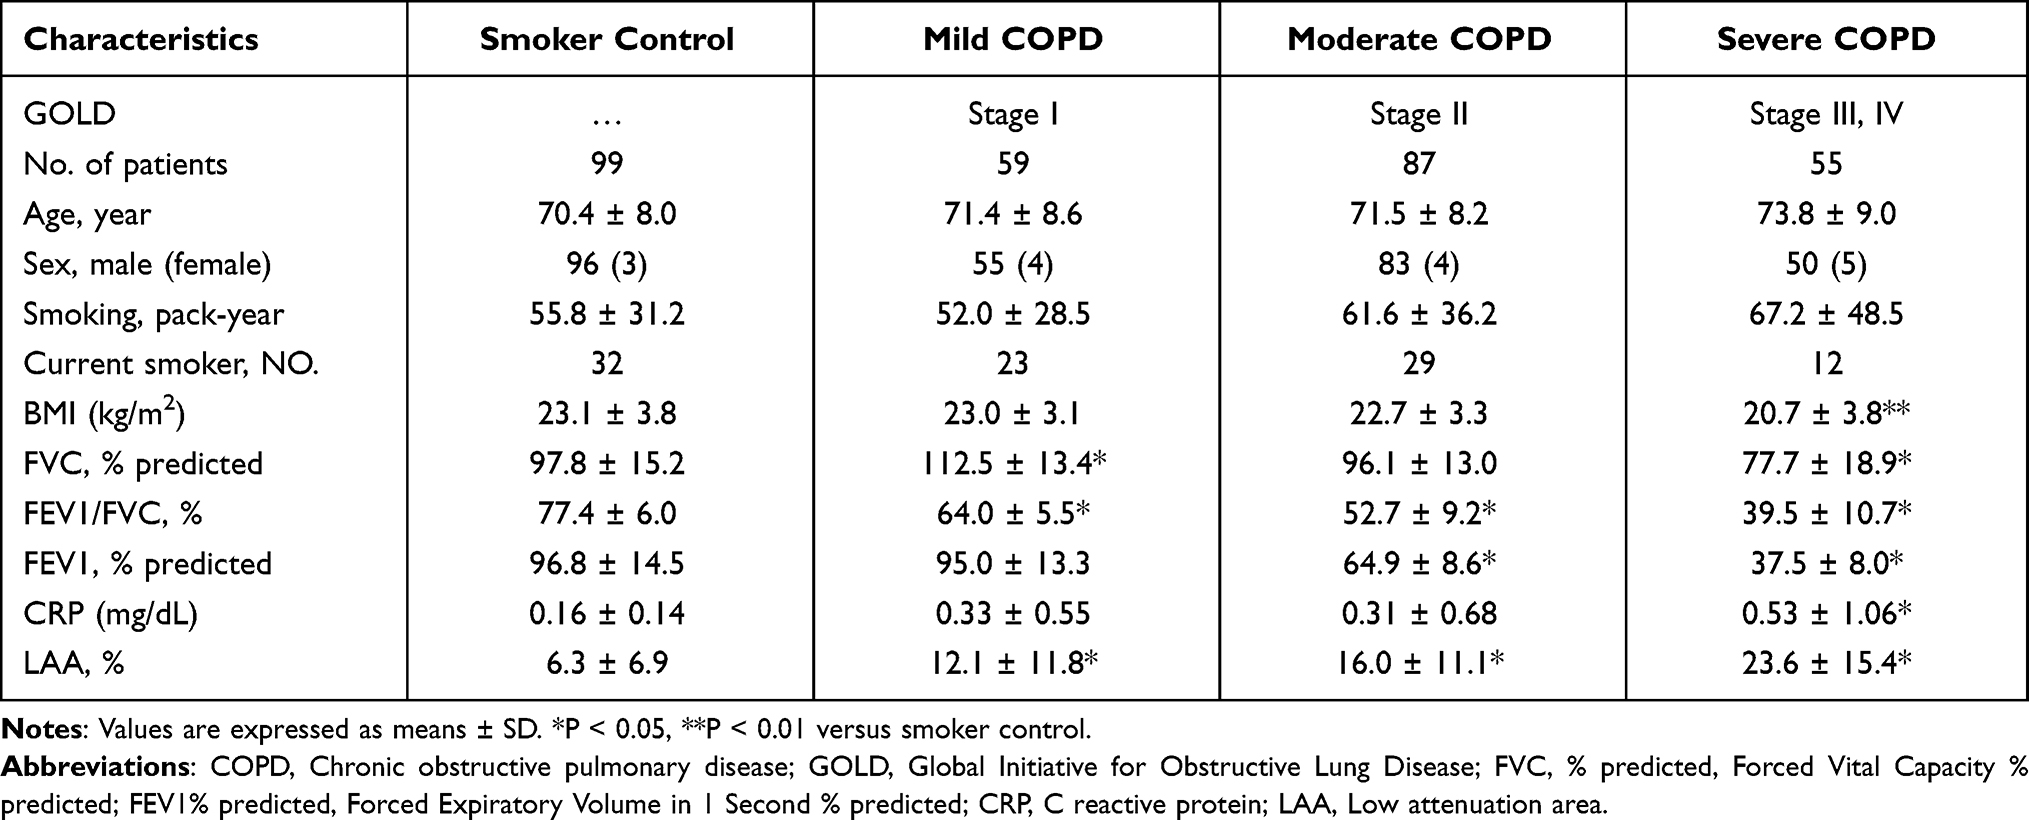 |
Table 1 Characteristics of Patients |
Measurement of LAA%
LAA% was measured as previously reported.25–27 Briefly, high-resolution CT scans were acquired using a 128-multidetector CT scanner (Somatom Definition FLASH; Siemens Medical Solutions, Erlangen, Germany) with a slice thickness of 2 mm. LAA% was calculated using a threshold of −960 Hounsfield units (HU) to assess the emphysematous changes and the total lung volume using the computer software LungVisionTM version 2.1 (Cybernet Systems Co., Ltd., Tokyo, Japan).
Quantitative Analysis of the Cross-Sectional Area (CSA) of the Erector Spinae Muscles (ESMs)
The CSA of ESMs (ESMCSA) was measured based on a previous study by Tanimura et al.14 Briefly, ESMCSA was measured on a single-slice, axial chest CT image at the level of the lower margin of the 12th thoracic vertebra using a computer software (Image J, National Institutes of Health, Bethesda, MD, USA). The left and right ESMs were selected manually, the areas of both ESMs were selected, and the CSAs of both ESMs were calculated (Figure 1). The intra- and interobserver reliabilities were determined in 45 subjects (Control n=10, stage I n=11, stage II n=19, stage III n=5, stage IV n=0) with K.N. and M.N. (pulmonary physicians) as the observers. The intraclass correlation coefficient (ICC) of intra-observer agreement was 0.998, and the ICC of inter-observer reliability was 0.973.
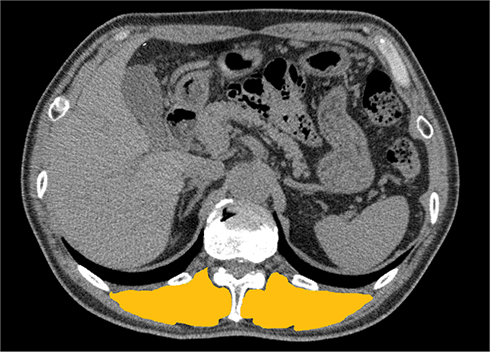 |
Figure 1 Representative chest computed tomography (CT) image used to measure the cross-sectional area of erector spinae muscles (ESMCSA). The manually selected area (yellow) is used to measure ESMCSA using the computer software, Image J. |
Statistical Analysis
Comparisons of age, smoking index (expressed as pack-years), pulmonary function parameters, ESMCSA, and LAA% were performed using analysis of variance (ANOVA) with Bonferroni corrections for multiple comparisons. Correlations were analyzed by Pearson’s correlation coefficient. Comparisons of clinical data between current smokers and former smokers and between GOLD stage III and IV COPD patients were performed using Student’s t-test. The significance of differences in the distributions of sex and disease severity between the groups was determined by the chi-squared test and the chi-squared test for trend. Comparisons were considered significant at p <0.05. Binary logistic regression analysis of the Cr/CysC ratio was performed using the statistical software SPSS 26.0 (SPSS Inc., Chicago, IL, USA) to exclude the effects of sex, age, BMI, CRP, %FVC, FEV1%, %FEV1, LAA%, and ESMCSA. The patients were divided into 2 groups using cut-off values of 18.5kg/m2 for BMI, 0.2 mg/dL for CRP, 80% for %FVC, 50% for FEV1%, 50% for %FEV1%, and 5% for LAA%.28 Similarly, the patients were divided into 2 groups using cut-off values of 24.7 for ESMCSA and 0.885 for Cr/CysC, which were obtained from the receiver operating characteristic (ROC) curves. Furthermore, ROC curve analysis was performed to calculate the area under the ROC curve (AUC) of ESMCSA and the Cr/CysC ratio for severe COPD.
Results
Patients’ Characteristics
Age, sex, smoking history, pulmonary function data, serum C-reactive protein (CRP), and LAA% of COPD patients classified by pulmonary function are summarized in Table 1. No significant differences were observed in age, sex, or smoking history between the groups, except for the serum CRP, pulmonary functions, and LAA%. The serum CRP level was significantly higher in patients without COPD than in severe COPD patients. Although there were no significant differences in serum CysC and eGFRCys levels between smoker control and COPD patients, there was a significant decrease in serum Cr levels and an increase in eGFRCr levels in severe COPD patients compared with those in smoker control patients (Table 2).
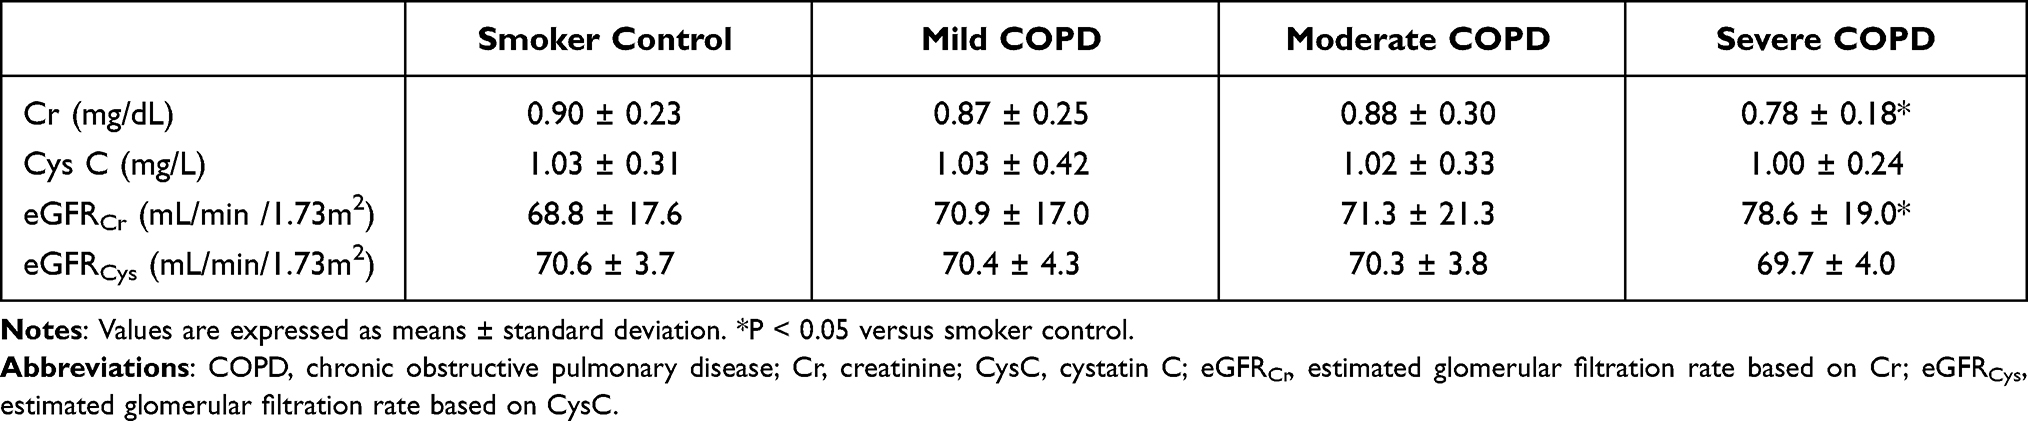 |
Table 2 Serum Creatinine, Cystatin C, and Estimated Glomerular Filtration Rates |
Association of ESMCSA and the Serum Cr/CysC Ratio
The ESMCSA was significantly decreased in severe COPD patients compared with smoking control, mild, and moderate COPD patients (Figure 2A). The serum Cr/CysC ratio was also significantly decreased in severe COPD patients compared with smoking control, mild, and moderate COPD patients (Figure 2B).
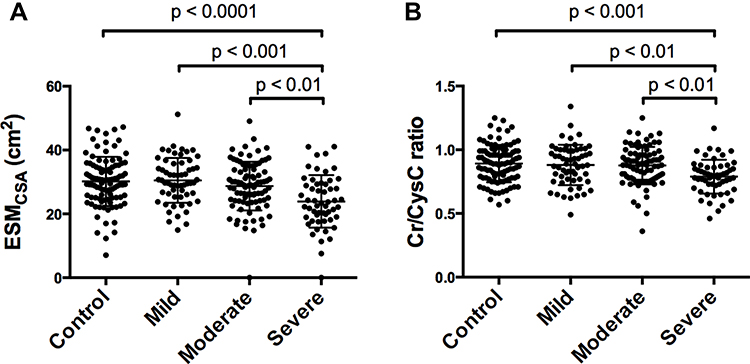 |
Figure 2 The cross-sectional area of the ESMCSA measured from chest CT (A) and the serum creatinine/cystatin C (Cr/CysC) ratio (B) of smoker control patients (control) and patients with mild, moderate, and severe chronic obstructive pulmonary disease (COPD). Both ESMCSA and the Cr/CysC ratio are significantly lower in severe COPD patients than in other groups. Data are expressed as means ± standard deviation. |
The serum Cr levels in all patients were not correlated with ESMCSA (Figure 3A), but the serum Cr level in patients with normal serum CysC levels (CysC < 0.95 mg/L) was significantly correlated with the ESMCSA (Figure 3B). Furthermore, the serum Cr/CysC ratio was significantly correlated with the ESMCSA in all patients in the present study (Figure 3C).
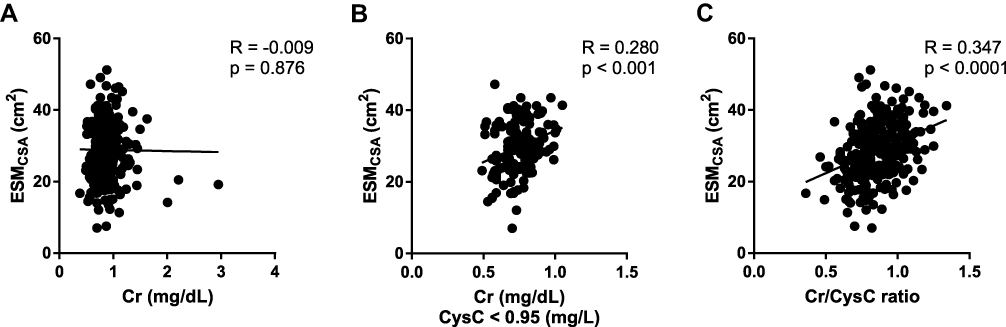 |
Figure 3 The figures show the correlation analyses between serum Cr levels and ESMCSA measured from chest CT in the total patient sample (A) and in patients with normal serum CysC levels (B), and the correlation analysis between the serum Cr/CysC ratio and ESMCSA (C). The Cr levels in patients with normal CysC levels and the Cr/CysC ratio are significantly correlated with ESMCSA. |
According to the ROC analysis, the cut-off points of ESMCSA and Cr/CysC for severe COPD were 24.7 (AUC 0.705 [95% CI 0.625–0.785] (Figure 4A), sensitivity = 59.3%, specificity = 76.5%) and 0.885 (AUC 0.688 [95% CI 0.616–0.760], sensitivity = 81.8%, specificity = 51.4%), respectively (Figure 4B).
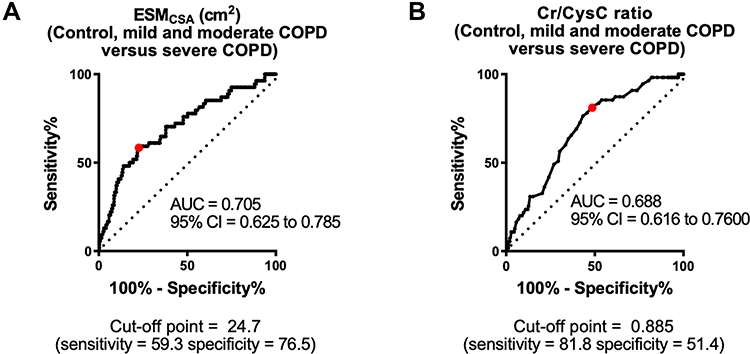 |
Figure 4 Receiver operating characteristic (ROC) curves and areas under the ROC curves (AUCs) of Cr/CysC and ESMCSA. The ROC curve and AUC of ESMCSA for severe COPD. The cut-off point of ESMCSA for severe COPD is 24.65 (AUC 0.705 (95% confidence interval [CI] 0.625–0.785), sensitivity = 59.3%, specificity = 76.3%) (A). The ROC curve and AUC of Cr/CysC for severe COPD. The cut-off point of Cr/CysC for severe COPD is 0.865 (AUC 0.688 (95% CI 0.616–0.760), sensitivity = 76.4%, specificity = 56.7%) (B). |
Correlation Analyses of the Serum CysC Level, Cr/CysC Ratio, and Clinical Parameters
The Cr/CysC ratio in patients with COPD was significantly inversely related to age. This ratio was also weakly positively correlated with BMI and weakly inversely correlated with LAA% (Figure 5A–C). FEV1 and FVC values were also significantly correlated with the Cr/CysC ratio, and FEV1%, %FEV1, and %FVC were weakly correlated with this ratio (Figure 5D–H). Better correlations were observed between the Cr/CysC ratio and pulmonary function, such as FEV1, FVC, %FEV1, and %FVC in patients under 65 years of age than in patients 65 years of age and older (Figure 6). Binary logistic analysis was performed with age, BMI, CRP, %FVC, FEV1%, % FEV1, LAA%, ESMCSA, and Cr/CysC, respectively. Sex and %FEV1 affected the Cr/CysC ratio (Table 3). When the patients were divided into 2 groups using an age cut-off value of 75 years instead of 65 years, age affected the Cr/CysC ratio either.
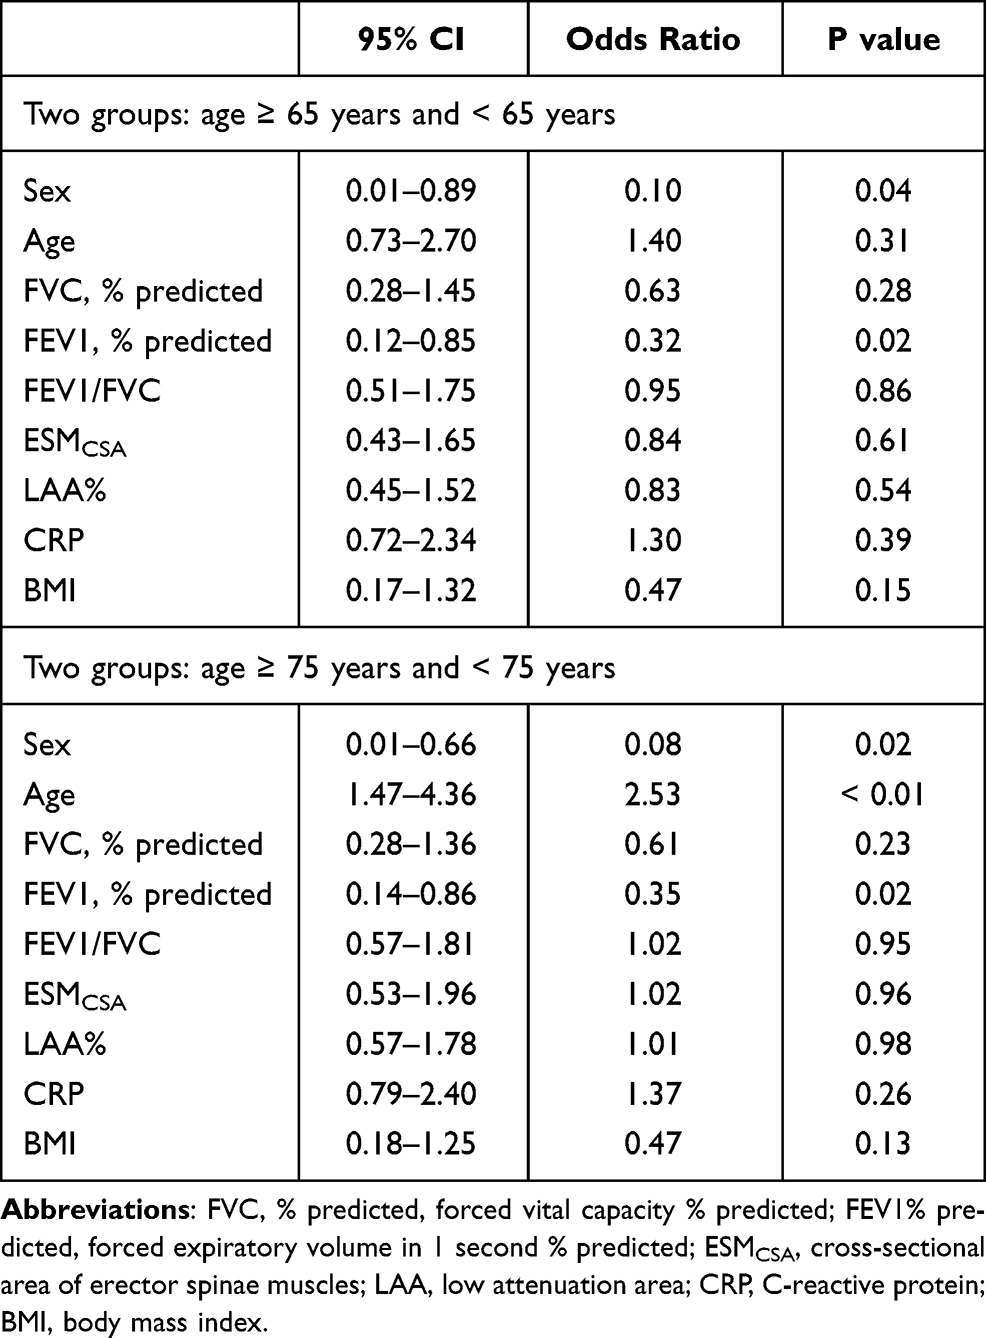 |
Table 3 Binary Logistic Regression Analysis of Cr/CysC Ratio |
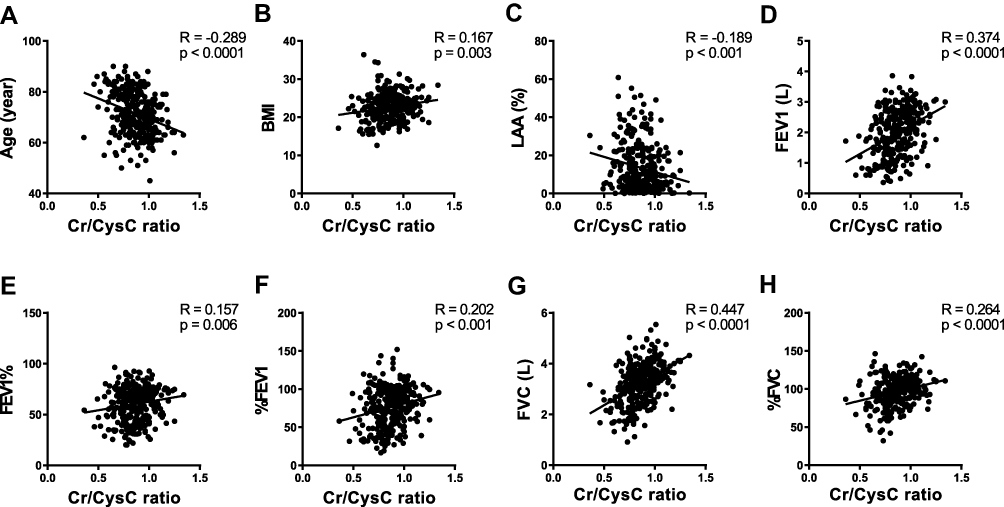 |
Figure 5 The figures show the correlation analyses between the serum Cr/CysC ratio and age (A), BMI (B), low attenuation area (LAA%) (C), forced expiratory volume in 1 second (FEV1) (D), FEV1/forced vital capacity (FVC) (FEV1%) (E), FEV1% predicted (%FEV1) (F), FVC (G), and FVC % predicted (%FVC) (H). Age, FEV1, FVC, and %FVC are significantly correlated with the serum Cr/CysC ratio. |
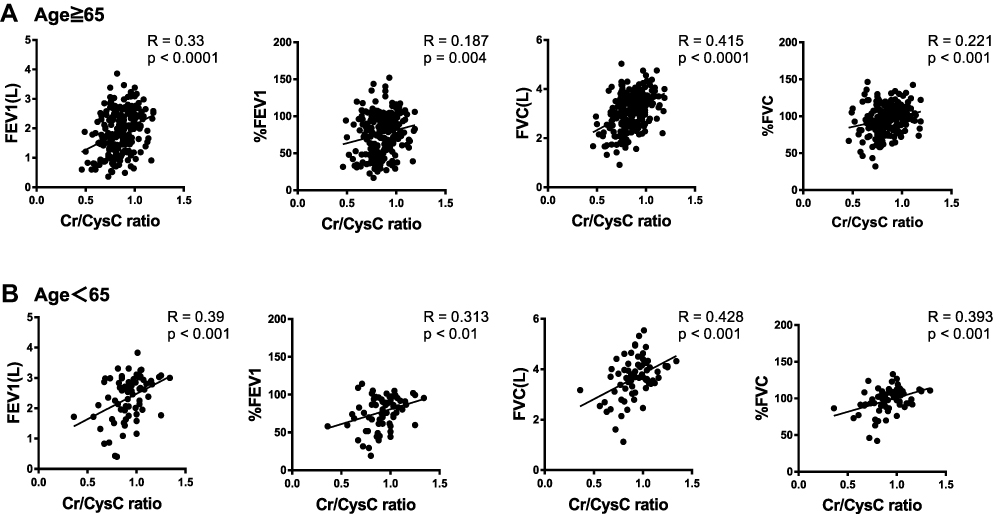 |
Figure 6 The figures show the correlation analyses between the serum Cr/CysC ratio and age (A), BMI (B), low attenuation area (LAA%) (C), forced expiratory volume in 1 second (FEV1) (D), FEV1/forced vital capacity (FVC) (FEV1%) (E), FEV1% predicted (%FEV1) (F), FVC (G), and FVC % predicted (%FVC) (H). |
In the present study, stage III and IV COPD patients were combined to from the severe COPD group because of the relatively small number of stage IV COPD patients (Tables 1 and 4). To clarify the usefulness and characteristics of Cr/CysC in patients with stage III and IV COPD, characteristics of stage III and IV COPD patients were compared. However, there were no significant differences in age, sex, smoking history, BMI, CRP, LAA%, Cr, and CysC levels between the stage III and IV COPD patients, despite significant deterioration in pulmonary functions (Table 4). Furthermore, correlation analyses were performed between the Cr/CysC ratio and age, BMI, LAA%, FEV1, FEV1%, %FEV1, FVC% and FVC only in patients with severe COPD, and there was a negative correlation between the Cr/CysC ratio and age, as well as positive correlations between the Cr/CysC ratio and FEV1 and FVC. Compared with the correlation analyses between the Cr/CysC and these clinical parameters in total patients (Figure 5), the p values of the correlation analyses between the Cr/CysC ratio and %FEV1 and FEV1% were increased (Figure 7).
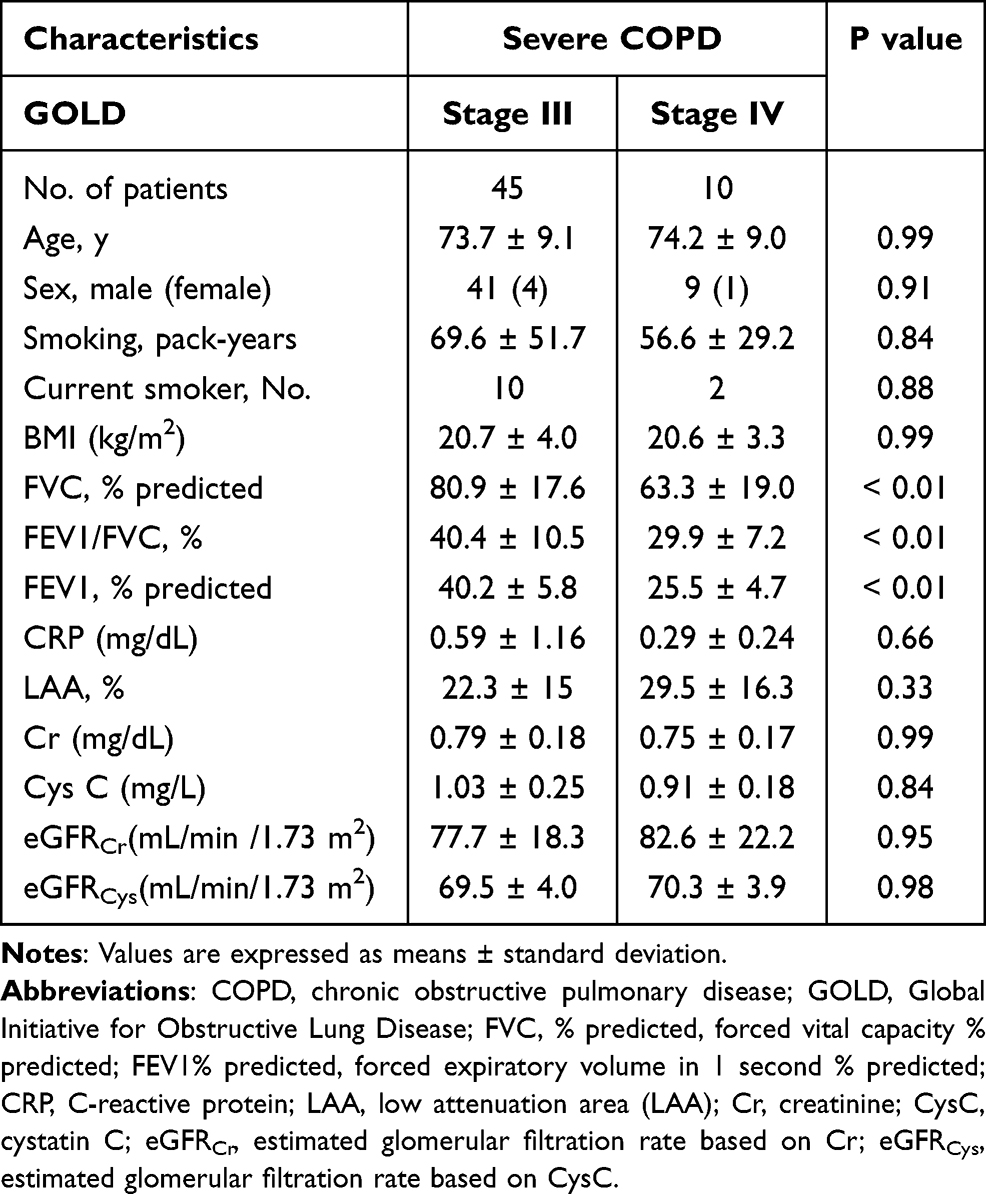 |
Table 4 Characteristics of Patients with Severe COPD |
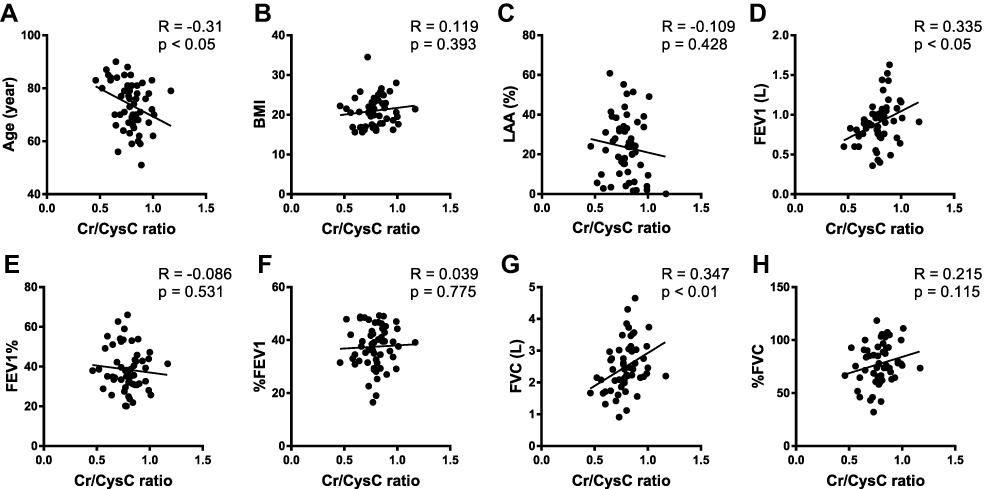 |
Figure 7 The figures show the correlation analyses between the serum Cr/CysC ratio and FEV1, %FEV1, FVC, and %FVC. Comparing the group 65 years and older (A) with the group younger than 65 years (B), the pulmonary functions are better correlated with the Cr/CysC ratio in the group younger than 65 years. Age, FEV1, and FVC are weakly correlated with the serum Cr/CysC ratio. |
The serum CysC level was weakly correlated with the serum CRP level (Figure 8A), and there was no significant correlation between the serum CysC level and LAA% (Figure 8B).
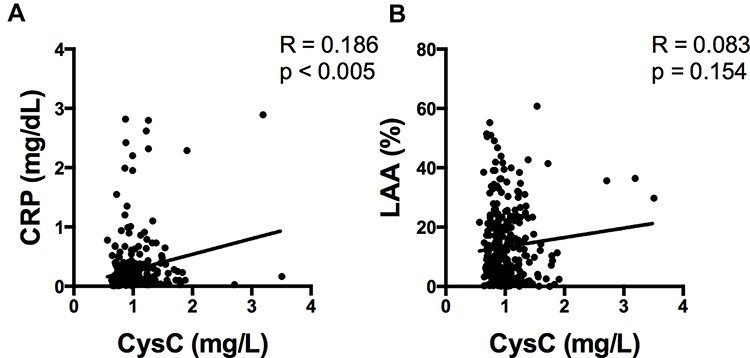 |
Figure 8 The figures show the correlation analyses between serum CysC levels and both serum CRP levels (A) and LAA% (B). The CRP level is weakly correlated with the CysC level, and there is no significant correlation between LAA% and the serum CysC level. |
Because the smoking status may affect serum CysC levels,29 the association of the Cr/CysC ratio with the ESMCSA and FEV1 value in these patients was evaluated between former smokers and current smokers. Although there were no significant differences in serum CysC levels, Cr levels, the Cr/CysC ratio, and %FEV1 between current smokers and former smokers, there were significant decreases in age, LAA%, and ESMCSA (Table 5). In addition, there were stronger correlations between the Cr/CysC ratio and both ESMCSA and the FEV1 value in former smokers than in current smokers (Figure 9).
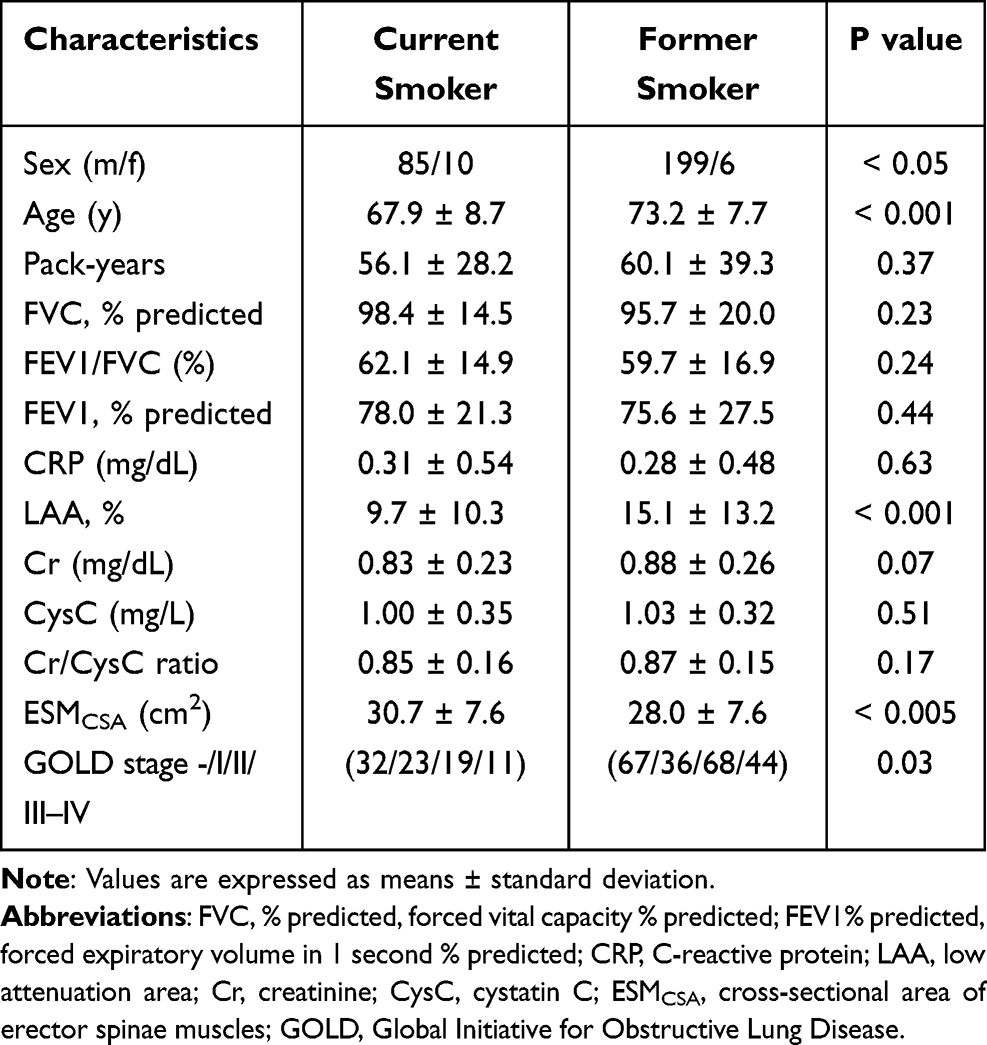 |
Table 5 Characteristics of Current and Former Smokers |
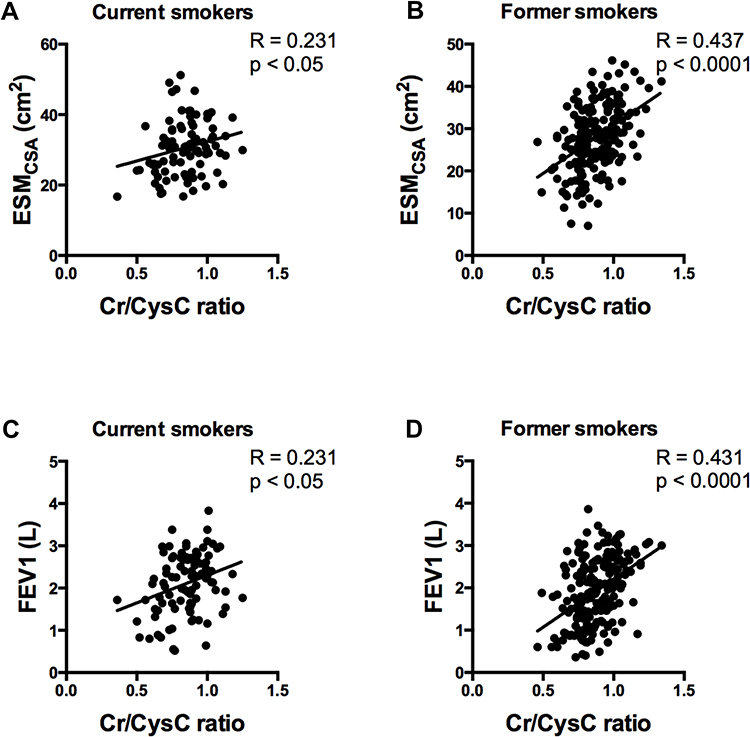 |
Figure 9 The upper figures show correlation analyses between the serum Cr/CysC ratio and ESMCSA in current smokers (A) and former smokers (B). The lower figures show the correlation analyses between the serum Cr/CysC ratio and the FEV1 value in current smokers (C) and former smokers (D). There are stronger correlations between the Cr/CysC ratio and both ESMCSA and the FEV1 value in former smokers than in current smokers. |
Discussion
In the present study, it was confirmed that the Cr/CysC ratio was significantly associated with ESMCSA and the severity of COPD. The serum Cr level could be a biomarker of muscle mass of COPD patients with normal renal function (Figure 3B), because the serum Cr level was affected by muscle mass,17,22 and the present findings showed that the Cr/CysC ratio might be a more reliable marker than the serum Cr level to assess the muscle mass of COPD patients (Figures 2 and 3C). CysC, which is not affected by muscle mass, has been largely studied in renal disease and cardiovascular disease, and it has been shown to be a valuable marker of renal function, particularly in elderly persons.30 The use of serum Cr levels adjusted for serum CysC will eliminate the effect of renal function and reflect systemic muscle mass, which is strongly associated with the severity and prognosis of COPD patients.14,31 According to the ROC curve and AUC analyses, the ESMCSA could be a relatively better biomarker than the Cr/CysC ratio for the assessment of COPD severity. However, the differences in the AUC are slight, not marked. We believe that both ratios can be equivalent biomarkers of the severity of COPD (Figure 4).
The serum Cr/CysC ratio has been reported as a predictive marker for adverse effects of chemotherapy in lung cancer.22 Kim et al also reported that an equation based on serum Cr and CysC levels was useful to estimate total-body muscle mass.32 Similar to these previous reports, it was confirmed in the present study that the Cr/CysC ratio would have clinical significance for assessing the disease severity of COPD as well as ESMCSA (Figure 2). Moreover, this ratio may be useful to estimate FEV1 and FVC values of COPD patients (Figure 5D). However, this ratio was significantly affected by age and sex (Figure 5A and Table 3), and it would have limited power in the evaluation of airflow limitations (Figure 5E and F and Table 3), probably because muscle weakness would decrease either FVC or FEV1.33 There was a better correlation between the Cr/CysC ratio and pulmonary functions in patients under 65 years of age than in patients 65 years of age and older (Figure 6). The Cr/CysC ratio could be a better biomarker of pulmonary function in middle-aged COPD patients than in elderly COPD patients. It has been reported that muscle mass decreases 1–2% annually in patients with COPD over 50 years of age,34 but 5–13% of patients over 65 years of age without chronic diseases such as COPD develop sarcopenia.35 Therefore, it was assumed that, in the present study, the worse correlations between the Cr/CysC ratio and pulmonary function in patients over 65 years of age were affected by the age-related muscle loss associated with sarcopenia. In the present study, the number of the patients under 65 years of age (n=69) was relatively small compared with that of those 65 years of age and older (n=231). It might be necessary to increase patient numbers in the future. In addition, the binary logistic analysis showed that FEV1 and the Cr/CysC ratio were lower in females than in males. Patients over the age of 75 years had significantly lower Cr/CysC levels than patients under the age of 75 years. These results are in line with previous studies that showed that serum Cr levels are lower in women and the elderly persons.36–38 We assume that, although the Cr/CysC ratio can be a predictive marker of pulmonary function, it should be kept in mind that the Cr/CysC ratio can be underestimated in women and patients over the age of 75 years.
A limitation of this study is the relatively small number of stage IV COPD patients, which makes it difficult to assess the usefulness of this biomarker in severe COPD patients. In the present study, there was no correlation between the Cr/CysC ratio and airflow limitation (FEV1% and %FEV1) in patients with stage III and IV COPD (Figure 7), despite the fact that they were significantly correlated in all patients (Figure 5). These differences suggest that the Cr/CysC ratio is not a suitable biomarker for classifying severe COPD patients into stages III and IV, even though the Cr/CysC ratio is a predictive biomarker for differentiating severe COPD patients from all patients (Figure 4B). However, it is possible that a study of the Cr/CysC ratio with a larger number of patients with stage IV COPD would confirm the usefulness of this biomarker for classifying severe COPD patients into stages III and IV in the future.
However, several previous reports showed that serum CysC levels were associated with increased serum CRP levels and smoking status.28,39 Conversely, CRP was reported as one of the biomarkers of disease severity in COPD patients.40 In the present study, the CRP level was higher in severe COPD patients than in smoker control patients (Table 1), and a weak correlation between serum CysC and CRP levels was observed (Figure 8A).
Furthermore, there were stronger correlations between the Cr/CysC ratio and both ESMCSA and FEV1 values in former smokers than in current smokers (Figure 9). This result could be affected by the fact that the current smokers entered in the present study included more emphysema patients, because it has been previously reported that emphysema correlates with muscle loss.41 From these observations, it was concluded that, in current smokers and patients with high serum CRP levels, the Cr/CysC ratio would not be a sensitive biomarker to assess the muscle mass and disease severity of COPD patients.
Conclusion
In conclusion, the serum Cr/CysC ratio is associated with ESMCSA and pulmonary functions, especially FVC and FEV1 values. Despite the fact that age and smoking status may affect this ratio, measuring this ratio is easy, repeatable, and inexpensive, without radiation hazard, compared with measuring ESMCSA. Furthermore, this ratio will be useful to estimate muscle mass in various settings, including retrospective cohorts, if the serum of the patients is properly stored.
Additional studies will be necessary to confirm the clinical value of this ratio in the monitoring of COPD patients.
Data Sharing Statement
The authors confirm that the data supporting the findings of this study are available within the article.
Acknowledgments
These investigations have been supported by a Grant-in-Aid for Scientific Research of Japan (No. 16K09593). The authors would like to thank Makoto Kobayashi, MS, for expert technical assistance.
Disclosure
The authors report no conflicts of interest in this work.
References
1. Landbo C, Prescott E, Lange P, et al. Prognostic value of nutritional status in chronic obstructive pulmonary disease. Am J Respir Crit Care Med. 1999;160(6):1856–1861. doi:10.1164/ajrccm.160.6.9902115
2. Schols AMWJ, Broekhuizen R, Weling-Scheepers CA, et al. Body composition and mortality in chronic obstructive pulmonary disease. Am J Clin Nutr. 2005;82(1):53–59.
3. Ischaki E, Papatheodorou G, Gaki E, et al. Body mass and fat-free mass indices in COPD: relation with variables expressing disease severity. Chest. 2007;132(1):164–169. doi:10.1378/chest.06-2789
4. Cruz-Jentoft AJ, Baeyens JP, Bauer JM, et al. Sarcopenia: European consensus on definition and diagnosis: report of the European Working Group on Sarcopenia in Older People. Age Ageing. 2010;39(4):412–423. doi:10.1093/ageing/afq034
5. Chen L-K, Liu L-K, Woo J, et al. Sarcopenia in Asia: consensus report of the Asian Working Group for Sarcopenia. J Am Med Dir Assoc. 2014;15(2):95–101. doi:10.1016/j.jamda.2013.11.025
6. Heymsfield SB, Arteaga C, McManus C, et al. Measurement of muscle mass in humans: validity of the 24-hour urinary creatinine method. Am J Clin Nutr. 1983;37(3):478–494. doi:10.1093/ajcn/37.3.478
7. Proctor DN, O’Brien PC, Atkinson EJ, et al. Comparison of techniques to estimate total body skeletal muscle mass in people of different age groups. Am J Physiol. 1999;277(3 Pt 1):E489–95. doi:10.1152/ajpendo.1999.277.3.E489
8. Engstrom CM, Loeb GE, Reid JG, et al. Morphometry of the human thigh muscles. A comparison between anatomical sections and computer tomographic and magnetic resonance images. J Anat. 1991;176:139–156.
9. Mitsiopoulos N, Baumgartner RN, Heymsfield SB, et al. Cadaver validation of skeletal muscle measurement by magnetic resonance imaging and computerized tomography. J Appl Physiol. 1998;85(1):115–122. doi:10.1152/jappl.1998.85.1.115
10. Heymsfield SB, Smith R, Aulet M, et al. Appendicular skeletal muscle mass: measurement by dual-photon absorptiometry. Am J Clin Nutr. 1990;52(2):214–218. doi:10.1093/ajcn/52.2.214
11. Janssen I, Heymsfield SB, Baumgartner RN, et al. Estimation of skeletal muscle mass by bioelectrical impedance analysis. J Appl Physiol. 2000;89(2):465–471. doi:10.1152/jappl.2000.89.2.465
12. Ikezoe T, Mori N, Nakamura M, et al. Effects of age and inactivity due to prolonged bed rest on atrophy of trunk muscles. Eur J Appl Physiol. 2012;112(1):43–48. doi:10.1007/s00421-011-1952-x
13. Lee CS, Cron DC, Terjimanian MN, et al. Dorsal muscle group area and surgical outcomes in liver transplantation. Clin Transplant. 2014;28(10):1092–1098. doi:10.1111/ctr.12422
14. Tanimura K, Sato S, Fuseya Y, et al. Quantitative assessment of erector spinae muscles in patients with chronic obstructive pulmonary disease. novel chest computed tomography-derived index for prognosis. Ann Am Thorac Soc. 2016;13(3):334–341. doi:10.1513/AnnalsATS.201507-446OC
15. Yoshizawa T, Okada K, Furuichi S, et al. Prevalence of chronic kidney diseases in patients with chronic obstructive pulmonary disease: assessment based on glomerular filtration rate estimated from creatinine and cystatin C levels. Int J Chron Obstruct Pulmon Dis. 2015;10(1):1283–1289. doi:10.2147/COPD.S80673
16. Filler G, Bökenkamp A, Hofmann W, et al. Cystatin C as a marker of GFR–history, indications, and future research. Clin Biochem. 2005;38(1):1–8. doi:10.1016/j.clinbiochem.2004.09.025
17. Baxmann AC, Ahmed MS, Marques NC, et al. Influence of muscle mass and physical activity on serum and urinary creatinine and serum cystatin C. Clin J Am Soc Nephrol. 2008;3(2):348–354. doi:10.2215/CJN.02870707
18. Hashizume A, Katsuno M, Banno H, et al. Longitudinal changes of outcome measures in spinal and bulbar muscular atrophy. Brain. 2012;135(Pt 9):2838–2848. doi:10.1093/brain/aws170
19. Coll E, Botey A, Alvarez L, et al. Serum cystatin C as a new marker for noninvasive estimation of glomerular filtration rate and as a marker for early renal impairment. Am J Kidney Dis. 2000;36(1):29–34. doi:10.1053/ajkd.2000.8237
20. Schaeffner ES, Ebert N, Delanaye P, et al. Two novel equations to estimate kidney function in persons aged 70 years or older. Ann Intern Med. 2012;157(7):471–481. doi:10.7326/0003-4819-157-7-201210020-00003
21. Dharnidharka VR, Kwon C, Stevens G. Serum cystatin C is superior to serum creatinine as a marker of kidney function: a meta-analysis. Am J Kidney Dis. 2002;40(2):221–226. doi:10.1053/ajkd.2002.34487
22. Suzuki K, Furuse H, Tsuda T, et al. Utility of creatinine/cystatin C ratio as a predictive marker for adverse effects of chemotherapy in lung cancer: a retrospective study. J Int Med Res. 2015;43(4):573–582. doi:10.1177/0300060515579116
23. Sasaki E, Nakamura M, Kida K. Reference values for spirogram and blood gas analysis in Japanese non-smoking healthy adults in Japanese. Nihon Kokyuki Gakkai Zasshi. 2001;39:383–399.
24. Rabe KF, Hurd S, Anzueto A, et al. Global strategy for the diagnosis, management, and prevention of chronic obstructive pulmonary disease: GOLD executive summary. Am J Respir Crit Care Med. 2007;176(6):532–555. doi:10.1164/rccm.200703-456SO
25. Kato R, Mizuno S, Kadowaki M, et al. Sirt1 expression is associated with CD31 expression in blood cells from patients with chronic obstructive pulmonary disease. Respir Res. 2016;17(1):139. doi:10.1186/s12931-016-0452-2
26. Mizuno S, Ishizaki T, Kadowaki M, et al. p53 signaling pathway polymorphisms associated with emphysematous changes in COPD patients. Chest. 2017;152:58–69.
27. Nojiri M, Mizuno S, Nishiki K, et al. ADRB2 gene polymorphism and emphysema heterogeneity can modulate bronchodilator response in patients with emphysema. Pulm Pharmacol Ther. 2017;48:80–87. doi:10.1016/j.pupt.2017.09.004
28. Patel BD, Coxson HO, Pillai SG, et al. Airway wall thickening and emphysema show independent familial aggregation in chronic obstructive pulmonary disease. Am J Respir Crit Care Med. 2008;178(5):500–505. doi:10.1164/rccm.200801-059OC
29. Knight EL, Verhave JC, Spiegelman D, et al. Factors influencing serum cystatin C levels other than renal function and the impact on renal function measurement. Kidney Int. 2004;65(4):1416–1421. doi:10.1111/j.1523-1755.2004.00517.x
30. Meng L, Yang Y, Qi L-T, et al. Elevated serum cystatin C is an independent predictor of cardiovascular events in people with relatively normal renal function. J Nephrol. 2012;25(3):426–430. doi:10.5301/jn.5000020
31. McDonald M-LN, Diaz AA, Ross JC, et al. Quantitative computed tomography measures of pectoralis muscle area and disease severity in chronic obstructive pulmonary disease. A cross-sectional study. Ann Am Thorac Soc. 2014;11(3):326–334. doi:10.1513/AnnalsATS.201307-229OC
32. Kim S-W, Jung H-W, Kim C-H, et al. A new equation to estimate muscle mass from creatinine and Cystatin C. Stover CM, ed. PLoS One. 2016;11(2):e0148495. doi:10.1371/journal.pone.0148495
33. Chandrasoma B, Balfe D, Naik T, et al. Pulmonary function in patients with amyotrophic lateral sclerosis at disease onset. Monaldi Arch Chest Dis. 2012;77(3–4):129–133. doi:10.4081/monaldi.2012.146
34. Santilli V, Bernetti A, Mangone M, et al. Clinical definition of sarcopenia. Clin Cases Miner Bone Metab. 2014;11(3):177–180.
35. Schols AM, Broekhuizen R, Weling-Scheepers CA, et al. Body composition and mortality in chronic obstructive pulmonary disease. Am J Clin Nutr. 2005;82(1):53–59.
36. Purde MT, Nock S, Risch L, et al. The cystatin C/creatinine ratio, a marker of glomerular filtration quality: associated factors, reference intervals, and prediction of morbidity and mortality in healthy seniors. Transl Res. 2016;169:
37. Perrone RD, Madias NE, Levey AS. Serum creatinine as an index of renal function: new insights into old concepts. Clin Chem. 1992;38:1933–1953. doi:10.1093/clinchem/38.10.1933
38. Stevens LA, Schmid CH, Greene T, et al. Factors other than glomerular filtration rate affect serum cystatin C levels. Kidney Int. 2009;75:652–660. doi:10.1038/ki.2008.638
39. Wasén E, Isoaho R, Vahlberg T, et al. Association between markers of renal function and C-reactive protein level in the elderly: confounding by functional status. Scand J Clin Lab Invest. 2008;68(6):484–491. doi:10.1080/00365510701854983
40. Zemans RL, Jacobson S, Keene J, et al. Multiple biomarkers predict disease severity, progression and mortality in COPD. Respir Res. 2017;18(1):117. doi:10.1186/s12931-017-0597-7
41. Rutten EPA, Grydeland TB, Pillai SG, et al. Quantitative CT: associations between emphysema, airway wall thickness and body composition in COPD. Pulm Med. 2011;2011:419328. doi:10.1155/2011/419328
 © 2021 The Author(s). This work is published and licensed by Dove Medical Press Limited. The
full terms of this license are available at https://www.dovepress.com/terms
and incorporate the Creative Commons Attribution
- Non Commercial (unported, 3.0) License.
By accessing the work you hereby accept the Terms. Non-commercial uses of the work are permitted
without any further permission from Dove Medical Press Limited, provided the work is properly
attributed. For permission for commercial use of this work, please see paragraphs 4.2 and 5 of our Terms.
© 2021 The Author(s). This work is published and licensed by Dove Medical Press Limited. The
full terms of this license are available at https://www.dovepress.com/terms
and incorporate the Creative Commons Attribution
- Non Commercial (unported, 3.0) License.
By accessing the work you hereby accept the Terms. Non-commercial uses of the work are permitted
without any further permission from Dove Medical Press Limited, provided the work is properly
attributed. For permission for commercial use of this work, please see paragraphs 4.2 and 5 of our Terms.