")
Back to Journals » Clinical Interventions in Aging » Volume 17
Serum Cortisol, Nesfatin-1, and IL-1β: Potential Diagnostic Biomarkers in Elderly Patients with Treatment-Resistant Depression
Authors Wu X, Dai B, Yan F, Chen Y, Xu Y, Xia Q, Zhang X
Received 7 February 2022
Accepted for publication 18 April 2022
Published 21 April 2022 Volume 2022:17 Pages 567—576
DOI https://doi.org/10.2147/CIA.S361459
Checked for plagiarism Yes
Review by Single anonymous peer review
Peer reviewer comments 2
Editor who approved publication: Dr Zhi-Ying Wu
Xiaoping Wu,1,2,* Biao Dai,2,3,* Fanfan Yan,1,2 Yang Chen,2,4 Yayun Xu,5 Qingrong Xia,2,6 Xulai Zhang1,2
1Department of Geriatric Psychology, Hefei Fourth People’s Hospital, Affiliated Psychological Hospital of Anhui Medical University, Hefei, People’s Republic of China; 2Department of Medical Education and Research, Anhui Mental Health Center, Hefei, People’s Republic of China; 3Department of Pharmacy, Hefei Fourth People’s Hospital, Affiliated Psychological Hospital of Anhui Medical University, Hefei, People’s Republic of China; 4Modified Electroconvulsive Therapy Room, Hefei Fourth People’s Hospital, Affiliated Psychological Hospital of Anhui Medical University, Hefei, 230032, People’s Republic of China; 5Department of Epidemiology and Biostatistics, School of Public Health, Anhui Medical University, Hefei, People’s Republic of China; 6Department of Science and Education, Hefei Fourth People’s Hospital, Affiliated Psychological Hospital of Anhui Medical University, Hefei, People’s Republic of China
*These authors contributed equally to this work
Correspondence: Xulai Zhang, Department of Geriatric Psychology, Hefei Fourth People’s Hospital, Affiliated Psychological Hospital of Anhui Medical University, No. 316 Huangshan Road, Hefei, 230032, People’s Republic of China, Tel +86 551 63616022, Fax +86 551 63616022, Email [email protected]
Aim: Treatment-resistant depression (TRD) affects approximately 30% of patients with major depressive disorder (MDD), especially elderly patients. As individuals with TRD are at an increased risk of committing suicide and pose a higher risk of relapse, early diagnostic biomarkers of TRD and a better understanding of the resistance mechanism are highly needed. This study aimed to determine whether serum cortisol, nesfatin-1, and pro-inflammatory cytokines can be used as biomarkers for the diagnosis of elderly patients with TRD.
Methods: Thirty elderly patients with TRD were selected as the TRD group. Thirty elderly patients with MDD who were effectively treated with conventional antidepressants were selected as the non-TRD group. The baseline levels of serum cortisol, nesfatin-1, and pro-inflammatory cytokines were measured and compared, and their diagnostic values were evaluated using the receiver operating characteristic (ROC) curve method for discriminating patients with TRD from those without TRD.
Results: Serum cortisol, C-reactive protein (CRP), tumor necrosis factor-α (TNF-α), and interleukin-6 (IL-6) levels were significantly higher in the non-TRD and TRD groups than in the control group. Moreover, serum cortisol, CRP, TNF-α, and IL-6 levels in the TRD group were significantly lower than those in the non-TRD group. Furthermore, serum nesfatin-1 levels in the non-TRD group were significantly lower than those in the control and TRD groups, while the serum IL-1β levels in the non-TRD group were significantly higher than those in the control and TRD groups. Additionally, an ROC analysis revealed an area under the curve (AUC) of 0.929 for the combination of nesfatin-1 and IL-1β and an AUC of 0.956 for the combination of cortisol, nesfatin-1, and IL-1β in discriminating elderly patients with TRD from those without non-TRD.
Conclusion: Serum cortisol, nesfatin-1, and IL-1β may be potential diagnostic biomarkers for discriminating elderly patients with TRD from those without TRD.
Keywords: treatment-resistant depression, nesfatin-1, cortisol, pro-inflammatory cytokine, diagnosis, elderly
Introduction
Depression is one of the most common mental disorders and the leading cause of functional disabilities.1 The latest nationwide epidemiological survey in China showed that the lifetime prevalence of depression is 6.9%.2 Antidepressants are the first-line treatment for depression; however, up to 20–30% of patients do not achieve remission after standardized antidepressant treatment, leading to the development of treatment-resistant depression (TRD).3,4 TRD is defined as the failure to achieve an adequate response after treatment with at least two antidepressants administered at an adequate dose and duration.4,5 It has been reported that TRD contributes substantially to the risk of recurrence of depression and high suicide rates, as well as increasing the healthcare costs.6,7 Taken together, the fact that depression in the elderly may be more difficult to treat than in other populations,8,9 finding sensitive and specific early diagnostic biomarkers, and understanding the mechanisms involved in the development and progression of TRD in elderly patients are a major issue in need of urgent resolution. Alterations in biological indicators, such as monocyte chemoattractant protein-1,10 lysophosphatidic acid,11 interferon-gamma,12 insulin-like growth factor-1,13 amino acids,14 and non-enzymatic antioxidants,14 are thought to be effective tools for understanding the pathophysiology and management of major depressive disorder (MDD), suggesting that biological indicators may be used as biomarkers for the diagnosis of patients with TRD.
Several lines of evidence demonstrate that depression is associated with the disruption of the hypothalamic-pituitary-adrenal (HPA) axis, as indicated by an increase in cortisol secretion.15,16 Preclinical studies have confirmed that hyperactivity of the HPA axis is observed in animal models of depression, such as maternal separation,17 chronic restraint stress,18 and chronic unpredictable mild stress.19 Clinical studies have suggested that persistently elevated cortisol levels are associated with poorer treatment outcomes in patients with depression.20,21 Therefore, it is rational to assume that cortisol may act as a potential diagnostic biomarker for discriminating elderly patients with TRD from those without TRD.
As a metabolic disorder, depression has been associated with anorexigenic or orexigenic peptides.22,23 Nesfatin-1 is a recently discovered anorexigenic peptide that is found to be increased in the peripheral blood of patients with MDD.24 Moreover, a positive relationship has been observed between blood nesfatin-1 levels and the severity of depression.25,26 However, a recent study showed that the serum nesfatin-1 levels were significantly lower in MDD patients with suicidal ideation than in healthy volunteers, and there was a negative correlation between the scores of suicidal ideation and nesfatin-1 levels.27 These contradictory results suggest that there may be differences in the blood nesfatin-1 levels between patients with different stages and subtypes of depression. Thus, in the present study, the potential diagnostic value of serum nesfatin-1 in elderly patients with TRD was investigated.
There is emerging evidence of a link between inflammation and depression in elderly patients. Older individuals with higher interleukin-6 (IL-6) levels exhibit a higher risk of depression.28 Moreover, older adults with chronic elevation in C-reactive protein (CRP) over a two-decade period spanning middle to late life were observed to experience greater symptoms of depression than general older adults.29 Depressed patients with different levels of inflammatory cytokines may respond differently to treatment. Numerous studies have demonstrated that patients with depression and elevated levels of inflammation are less likely to respond to conventional antidepressant therapies.30–32 More recently, dysregulated inflammatory activity has been suggested to be a distinguishing feature between patients with and without TRD.33 Given that the inflammatory factors most closely related to depression are CRP, tumor necrosis factor-alpha (TNF-α), IL-6, and IL-1β,34–36 whether these inflammatory factors could serve as objective and reliable biological indicators for the diagnosis of elderly patients with TRD was evaluated in the present study.
Considering the dysfunction of the HPA axis, together with the crucial role of nesfatin-1 and pro-inflammatory cytokines in the pathophysiology and treatment resistance of depression, the aim of the present study was to investigate whether serum cortisol, nesfatin-1, and pro-inflammatory cytokines could be used as diagnostic biomarkers to discriminate elderly patients with TRD from those without TRD. The baseline levels of serum cortisol, nesfatin-1, and pro-inflammatory cytokines in healthy controls, patients with TRD, and patients without TRD were measured and compared. The diagnostic values of serum cortisol, nesfatin-1, and pro-inflammatory cytokines in discriminating elderly patients with TRD from those without TRD were evaluated using the receiver operating characteristic (ROC) curve method.
Materials and Methods
Study Design and Participants
This study was conducted at the Department of Geriatric Psychology, Hefei Fourth People’s Hospital, Anhui Mental Health Center between December 2019 and October 2021. Elderly patients with depression were screened via psychiatric interviews by an experienced researcher in accordance with the guidelines of the structured clinical interview according to the Diagnostic and Statistical Manual for Psychiatric Disorders-Fourth Version (DSM-IV). The common criteria for inclusion were as follows: (1) age ≥ 60 years; (2) meeting the diagnostic criteria of depression listed in the DSM-IV; and (3) Hamilton Depression Rating Scale-24 (HAMD-24) scores > 21. The patients included in the TRD group needed to meet the criteria for TRD: treatments over 3 months with two or more antidepressants with different chemical structures in sufficient quantity are ineffective. Patients included in the non-TRD group met the following criteria: after antidepressant treatment, a satisfactory therapeutic response (defined as a reduction in the HAMD-24 score by at least 50%, with a total score of 12 or less) was achieved. The exclusion criteria were as follows: (1) other major psychiatric disorders or neurodegenerative illness history; (2) substance abuse (drug, caffeine, nicotine, alcohol, or others); (3) serious heart, brain, liver, kidney, immune disorders, obesity, poor nutrition (Body Mass Index (BMI) < 20 kg/m2), acute and chronic infection; and (4) received electroconvulsive treatment. A total of 60 elderly patients with depression, including 30 patients with TRD and 30 patients without TRD, were included. Thirty healthy volunteers were included as the control group. This procedure was approved by the ethics committee of the Anhui Mental Health Center and was conducted according to the principles of the Declaration of Helsinki. Informed consent was obtained from all the participants.
Measurements
Blood samples from the three groups were collected from the participants’ vein between 7:00 A.M. and 8:00 A.M., and immediately centrifuged at 1200 × g for 10 min at 4°C. The supernatant was extracted as a serum sample. The extracted serum was stored at −80°C until detection. The blood samples were collected from the patients in the TRD and non-TRD groups at the time of admission to the hospital before the initiation of any medical treatment. Commercially available enzyme-linked immunosorbent assay (ELISA) kits were used to measure the serum concentrations of cortisol, nesfatin-1, CRP, TNF-α, IL-6, and IL-1β (Jianglai Bio, Shanghai, China) according to the manufacturer’s instructions.
Statistical Analysis
The data were analyzed using SPSS (version 17.0; IBM Corp., Armonk, NY, USA). The data are expressed as mean ± standard error of the mean (SEM), and the statistical significance was set at P< 0.05. A one-sample Kolmogorov–Smirnov test showed a normal distribution of continuous variables. The differences in age and BMI among the three groups were assessed using a one-way analysis of variance (ANOVA), followed by the least significant difference (LSD) post hoc test. Sex differences among the three groups were evaluated using the chi-square test. A Student’s t-test for independent samples was used to compare the HAMD-24 scores between the TRD and non-TRD groups. An analysis of covariance (ANCOVA) followed by the LSD test was performed to compare differences in the cortisol, nesfatin-1, CRP, TNF-α, IL-6, and IL-1β levels among the three groups, controlling for age by using this variable as a covariate. A receiver operating characteristic (ROC) curve analysis was used to evaluate the area under the curve (AUC) of cortisol, nesfatin-1, CRP, TNF-α, IL-6, and IL-1βto discriminate elderly patients with TRD from those without TRD.
Results
Demographic and Clinical Characteristics of the Participants
The baseline demographic and clinical characteristics of participants in each of the study groups (control, non-TRD, and TRD groups) are shown in Table 1.
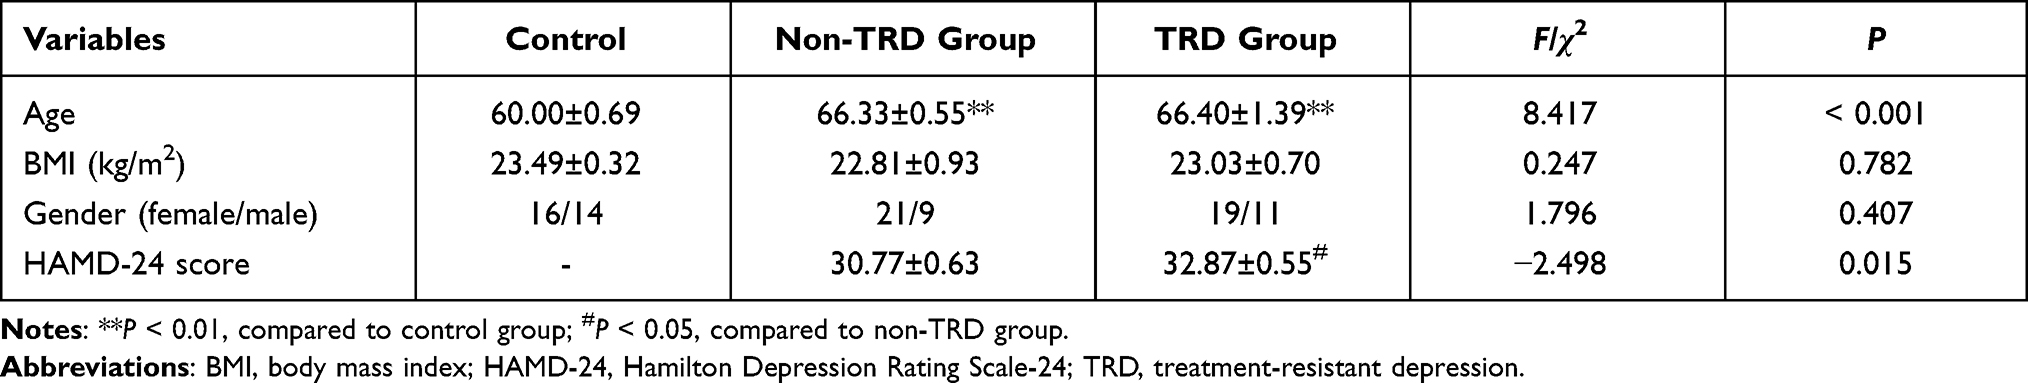 |
Table 1 Comparison of Age, BMI, Gender, and HAMD-24 Scores Among the Three Groups |
There were no significant differences in the BMI (F = 0.247, P = 0.782) or sex (χ2 = 1.796, P = 0.407) among the three groups. Age was significantly higher in the non-TRD and TRD groups than in the control group (F = 0.8.417, P <0.001; Table 1).
In terms of the HAMD-24 score, the mean HAMD-24 score in the non-TRD group was slightly lower than that in the TRD group (t = −2.498, P = 0.015; Table 1).
Serum Levels of Cortisol, Nesfatin-1, and Pro-Inflammatory Cytokines of the Participants
To eliminate the effect of age, an analysis of covariance (ANCOVA) was performed to compare the differences in the serum levels of cortisol, nesfatin-1, and pro-inflammatory cytokines among the three groups, controlling for age by using this variable as a covariate.
As shown in Figure 1A, the serum cortisol levels in the non-TRD and TRD groups were significantly higher than those in the control group. Moreover, the serum cortisol levels in the TRD group were significantly lower than those in the non-TRD group.
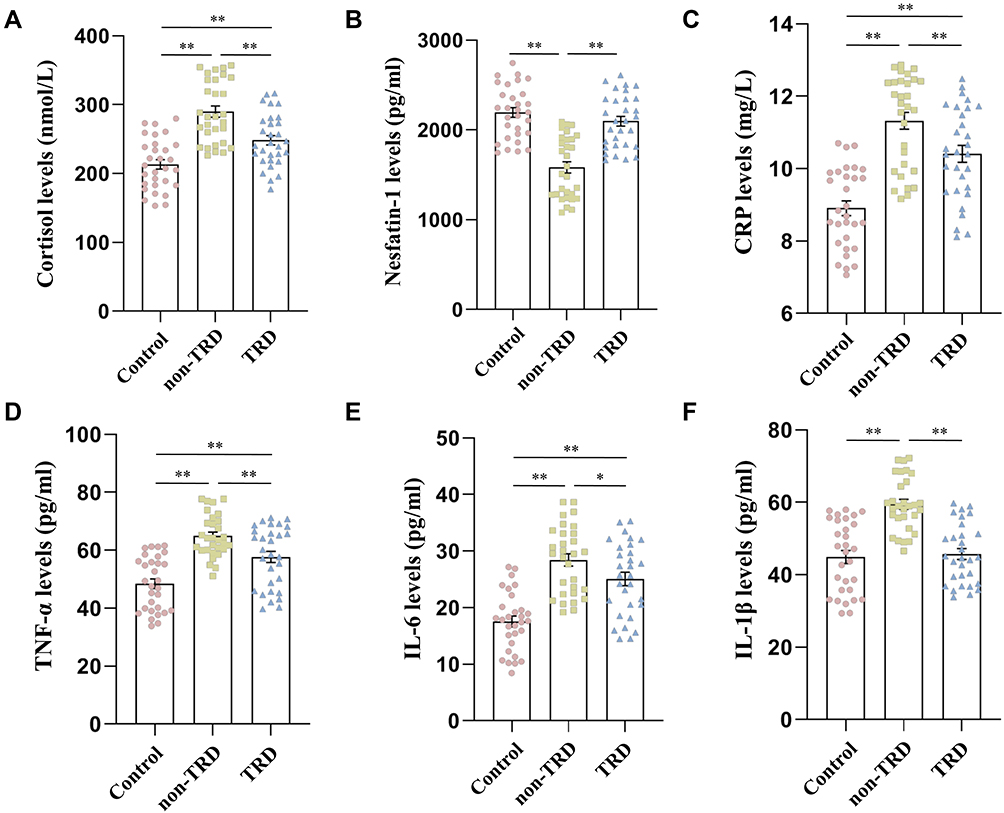 |
Figure 1 Comparison of serum levels of cortisol, nesfatin-1, CRP, TNF-α, IL-6, and IL-1β among the three groups. (A) Comparison of cortisol levels among the three groups; (B) comparison of nesfatin-1 levels among the three groups; (C) comparison of CRP levels among the three groups; (D) Comparison of TNF-α levels among the three groups; (E) comparison of IL-6 levels among the three groups; (F) comparison of IL-1β levels among the three groups. The data are presented as the mean ± SEM. *P < 0.05, **P < 0.01. |
Figure 1B shows that the serum nesfatin-1 levels in the non-TRD group were lower than those in the control group. The serum nesfatin-1 levels were significantly higher in the TRD group than in the non-TRD group.
In terms of pro-inflammatory cytokines, the serum CRP (Figure 1C), TNF-α (Figure 1D), and IL-6 (Figure 1E) levels were significantly increased in the non-TRD and TRD groups compared to the control group. Moreover, the serum CRP, TNF-α, and IL-6 levels in the TRD group were significantly lower than those in the non-TRD group. The serum IL-1β levels in the non-TRD group were significantly higher than those in the control and TRD groups (Figure 1F).
Diagnostic Values of Serum Cortisol, Nesfatin-1, and Pro-Inflammatory Cytokines in Discriminating Elderly Patients with TRD from Those without TRD
As shown in Figure 2A and Table 2, an ROC analysis indicated the potential diagnostic value of serum cortisol concentrations in discriminating elderly patients with TRD from those without TRD, with an AUC of 0.754 (P = 0.001; 95% CI: 0.635–0.874).
 |
Table 2 ROC Analysis of Various Indicators in Identification of TRD Patients from Non-TRD Patients |
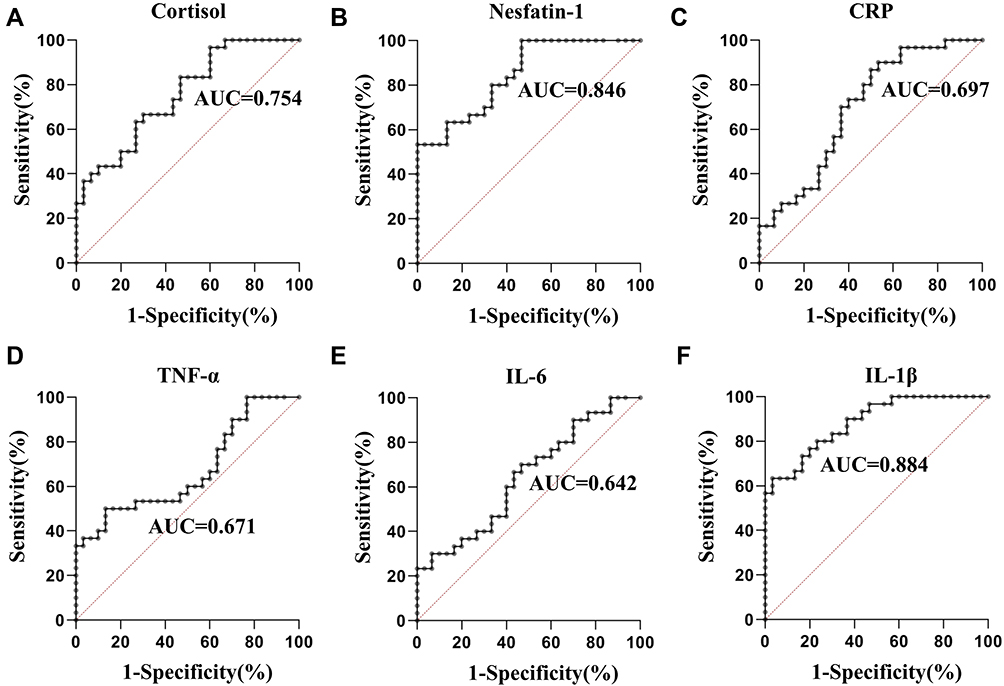 |
Figure 2 ROC curve of serum cortisol, nesfatin-1, CRP, TNF-α, IL-6, and IL-1β in the identification of patients with TRD from those without TRD. (A) ROC curve of cortisol; (B) ROC curve of nesfatin-1; (C) ROC curve of CRP; (D) ROC curve of TNF-α; (E) ROC curve of IL-6; (F) ROC curve of IL-1β. |
As shown in Figure 2B and Table 2, the ROC analysis indicated the potential diagnostic value of serum nesfatin-1 concentration in discriminating elderly patients with TRD from those without TRD, with an AUC for nesfatin-1 was 0.846 (P < 0.001; 95% CI: 0.751–0.940).
In terms of pro-inflammatory cytokines, the AUCs of CRP, TNF-α, IL-6, and IL-1β levels were 0.697 (P = 0.009; 95% CI: 0.563–0.830; Figure 2C and Table 2), 0.671 (P= 0.023; 95% CI: 0.533–0.809; Figure 2D and Table 2), 0.642 (P= 0.058; 95% CI: 0.503–0.782; Figure 2E and Table 2), and 0.884 (P< 0.001; 95% CI: 0.804–0.964; Figure 2F and Table 2), respectively.
Regarding the ROC analysis, an AUC greater than 0.7 was considered to have enough discriminatory power.37 Thus, the above results suggest that serum cortisol, nesfatin-1, and IL-1β may be potential novel biomarkers for discriminating elderly patients with TRD from those without TRD.
Diagnostic Values of the Combination of Serum Cortisol, Nesfatin-1, and IL-1β in Discriminating Elderly Patients with TRD from Those without TRD
Combining the detection of different biomarkers has been reported to be a useful strategy in several studies because it can increase the sensitivity and specificity of each biomarker. When the test results for cortisol, nesfatin-1, and IL-1β were considered jointly, the ROC analysis revealed an AUC of 0.898 (P < 0.001; 95% CI: 0.823–0.973) for the combination of cortisol and nesfatin-1 (Figure 3A), an AUC of 0.917 (P < 0.001; 95% CI: 0.848–0.985) for the combination of cortisol and IL-1β (Figure 3B), an AUC of 0.929 (P < 0.001; 95% CI: 0.870–0.988) for the combination of nesfatin-1 and IL-1β (Figure 3C), and an AUC of 0.956 (P < 0.001; 95% CI: 0.912–0.999) for the combination of cortisol, nesfatin-1, and IL-1β (Figure 3D).
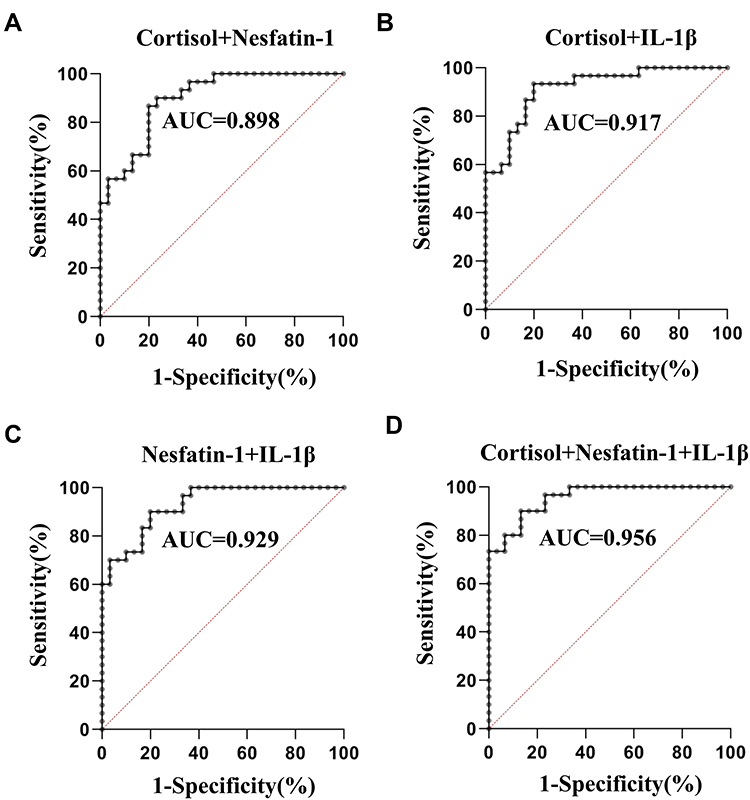 |
Figure 3 ROC curve for the combination of cortisol, nesfatin-1, and IL-1βin the identification of patients with TRD from those without TRD. (A) ROC curve for the combination of cortisol and nesfatin-1; (B) ROC curve for the combination of cortisol and IL-1β; (C) ROC curve for the combination of nesfatin-1 and IL-1β; (D) ROC curve for the combination of cortisol, nesfatin-1, and IL-1β. |
Discussion
In the present study, we demonstrated that the serum cortisol, CRP, TNF-α, and IL-6 levels in the non-TRD and TRD groups were significantly higher than those in the control group. Moreover, the serum cortisol, TNF-α, and IL-6 levels in the TRD group were significantly lower than those in the non-TRD group. Furthermore, the serum nesfatin-1 levels in the non-TRD group were significantly lower than those in the control and TRD groups, while the serum IL-1β levels in the non-TRD group were significantly higher than those in the control and TRD groups. Additionally, an ROC analysis revealed an AUC of 0.956 for the combination of cortisol, nesfatin-1, and IL-1β in discriminating elderly patients with TRD from elderly patients without TRD. These results suggest that cortisol, nesfatin-1, and IL-1β may be potential novel diagnostic biomarkers for discriminating elderly patients with TRD from those without TRD, and a combination of these indicators could improve the accuracy of diagnosis.
Accumulating evidence suggests that biological indicators in peripheral blood samples, including brain-derived neurotrophic factor,38 glial cell line-derived neurotrophic factor,39 IL-7,40 IL-6 and CRP levels,41 malondialdehyde,42 cortisol,42 macro-minerals, and trace elements43 have been analyzed to identify the biomarkers of depression. The present study further evaluated the possibility of using biological indicators in peripheral blood samples as diagnostic biomarkers to discriminate elderly patients with TRD from those without TRD.
It has been well demonstrated that patients with depressive disorders exhibit HPA axis perturbations with elevated cortisol levels.44 Consistently, in the present study, the serum cortisol levels of patients with depression in the non-TRD and TRD groups were higher than those of the control group, providing additional data linking cortisol to depression. Several studies have reported conflicting results regarding the relationship between cortisol level and antidepressant efficacy. Increased cortisol levels have been reported to be associated with a poor response to treatment of depressive episodes,45,46 while other studies have observed higher cortisol concentrations as a predictor of improved therapy response in depression.47,48 The results of the present study showed that the serum cortisol levels of patients with TRD were significantly lower than those of patients without TRD. Moreover, the results of the ROC curve analysis showed that the AUC for serum cortisol was 0.754 to differentiate patients with TRD from those without TRD. Taken together, these results suggest that patients with TRD with an intermediate cortisol level (higher than healthy subjects, but lower than those without TRD) may be associated with treatment resistance. Notably, higher serum cortisol levels in patients without TRD reflected a good antidepressant effect in the present study. The reasons for these conflicting relationships between cortisol and antidepressant efficacy remain unclear but might be due to several reasons: (1) age differences. The participants of the present study were elderly patients. Recent studies have indicated that age may moderate the relationship between cortisol levels and antidepressant treatment response.49 (2) Different measured samples. Since salivary cortisol provides a unique window into the recent history of an individual’s HPA function, some studies have evaluated the relationship between the HPA axis and antidepressant treatment outcomes by examining the cortisol level in saliva.50 The present study examined the serum cortisol levels. (3) Different disease severities and subtypes of the disease. Increased cortisol levels have been reported in first-episode patients, but not in patients with recurrent MDD.51 The phenomenon by which higher serum cortisol levels in patients without TRD reflect favorable antidepressant effects might be explained by our unique patient sample, with predominantly elderly patients with TRD in the present study. However, the specific mechanisms underlying these findings remain unclear and require further investigation.
Nesfatin-1, a newly identified potent anorexigenic 82-amino acid peptide, plays an important role in the central nervous system and peripheral tissues.52 Accumulating evidence has suggested a close relationship between nesfatin-1 and depression.53 It has been indicated that the plasma nesfatin-1 levels in adult patients with depression were higher than those in the control group.54 In contrast, the nesfatin-1 levels were significantly lower in adolescents with first-episode drug-naïve unipolar depression than healthy controls.55 To the best of our knowledge, this study is the first to evaluate the nesfatin-1 levels in elderly patients with and without TRD. The results showed that the serum nesfatin-1 levels in the non-TRD group were significantly lower than those in the control group, which is consistent with a study on adolescents.55 Moreover, we found that the serum cortisol levels of the TRD group were significantly lower than those of the non-TRD group, indicating a potential diagnostic value of serum nesfatin-1 concentrations in discriminating patients with TRD from those without TRD. The reasons for these conflicting results regarding the differences in nesfatin-1 levels in depression remain unclear but might be due to age differences.
Antidepressant treatment resistance is associated with increased pro-inflammatory cytokine levels in patients with depression.56 Specifically, it has been reported that relationships exist between high levels of CRP,57 TNF-α,58 and IL-659 and resistance to standard antidepressant therapy. Similarly, the present study found that the serum CRP, TNF-α, and IL-6 levels were significantly elevated in the TRD group than in the control group. However, the serum CRP, TNF-α, IL-6, and IL-1β levels were significantly higher in elderly patients without TRD than in those with TRD, suggesting that the subdivision of depressive patients according to the high levels of pro-inflammatory cytokines may predict outcomes with antidepressants. In other words, elderly depressed patients with mildly elevated levels of pro-inflammatory cytokines relative to healthy controls may confer an increased risk of poor outcomes during antidepressant treatment, while elderly depressed patients with markedly elevated levels of pro-inflammatory cytokines relative to healthy controls may have a good therapeutic effect. Currently, we are unable to explain these contradictory and notable findings; therefore, a further study with a larger sample size is needed to confirm these findings, and further in vitro and in vivo studies are needed to elucidate the possible mechanisms underlying these findings.
Our study has two strengths. This is the first study to investigate whether serum cortisol, nesfatin-1, and pro-inflammatory cytokines can be used as diagnostic biomarkers in discriminating elderly patients with TRD from those without TRD. In addition, we have confirmed that a combination of these indicators could improve the accuracy of diagnosis.
This study has certain limitations. First, the sample size was relatively small and all subjects were recruited from a single hospital. Second, owing to the cross-sectional study design, the causal association between these indicators and TRD could not be determined. Third, another limitation of our study is the long period over which the samples were collected. Fourth, the cortisol levels were assessed only at one time point. It has been shown that cortisol levels peak near the time of awakening, after which they decrease until bedtime, with the exception of a small spike at lunchtime.60 Thus, the differences in the cortisol levels among the groups should be evaluated at several time points.
In conclusion, this study is the first to reveal that serum cortisol, nesfatin-1, and IL-1β might be potential novel diagnostic biomarkers for discriminating elderly patients with TRD from those without TRD, and a combination of these indicators could improve the accuracy of diagnosis. Multicentric studies with larger sample sizes are required to validate these findings in the future.
Funding
This project was funded by the Research Fund Project of Hefei Fourth People’s Hospital (Project No: 2019009) and the Research Fund Project of Anhui Medical University (Project No: 2019xkj203).
Disclosure
The authors report no conflicts of interest in this work.
References
1. Kessler R, Aguilar-Gaxiola S, Alonso J, et al. The global burden of mental disorders: an update from the WHO World Mental Health (WMH) surveys. Epidemiol Psichiatr Soc. 2009;18(1):23–33. doi:10.1017/s1121189x00001421
2. Huang Y, Wang Y, Wang H, et al. Prevalence of mental disorders in China: a cross-sectional epidemiological study. Lancet Psychiatry. 2019;6(3):211–224. doi:10.1016/S2215-0366(18)30511-X
3. Al-Harbi K. Treatment-resistant depression: therapeutic trends, challenges, and future directions. Patient Prefer Adherence. 2012;6:369–388. doi:10.2147/PPA.S29716
4. McIntyre R, Filteau M, Martin L, et al. Treatment-resistant depression: definitions, review of the evidence, and algorithmic approach. J Affect Disord. 2014;156:1–7. doi:10.1016/j.jad.2013.10.043
5. Ng C, Kato T, Han C, et al. Definition of treatment-resistant depression - Asia Pacific perspectives. J Affect Disord. 2019;245:626–636. doi:10.1016/j.jad.2018.11.038
6. Rush A, Trivedi M, Wisniewski S, et al. Acute and longer-term outcomes in depressed outpatients requiring one or several treatment steps: a STAR*D report. Am J Psychiatry. 2006;163(11):1905–1917. doi:10.1176/ajp.2006.163.11.1905
7. Gibson T, Jing Y, Smith Carls G, et al. Cost burden of treatment resistance in patients with depression. Am J Manag Care. 2010;16(5):370–377.
8. Mosimann U, Marré S, Werlen S, et al. Antidepressant effects of repetitive transcranial magnetic stimulation in the elderly: correlation between effect size and coil-cortex distance. Arch Gen Psychiatry. 2002;59(6):560–561. doi:10.1001/archpsyc.59.6.560
9. Solé-Padullés C, Bartrés-Faz D, Junqué C, et al. Repetitive transcranial magnetic stimulation effects on brain function and cognition among elders with memory dysfunction. A randomized sham-controlled study. Cereb Cortex. 2006;16(10):1487–1493. doi:10.1093/cercor/bhj083
10. Proma M, Daria S, Nahar Z, Ashraful Islam S, Bhuiyan M, Islam M. Monocyte chemoattractant protein-1 levels are associated with major depressive disorder. J Basic Clin Physiol Pharmacol. 2022. doi:10.1515/jbcpp-2021-0132
11. Riya S, Sultana S, Daria S, et al. Evaluation of serum lysophosphatidic acid and lysophosphatidylcholine levels in major depressive disorder patients. Cureus. 2020;12(12):e12388. doi:10.7759/cureus.12388
12. Daria S, Proma M, Shahriar M, Islam S, Bhuiyan M, Islam M. Serum interferon-gamma level is associated with drug-naïve major depressive disorder. SAGE Open Med. 2020;8:2050312120974169. doi:10.1177/2050312120974169
13. Ali S, Nahar Z, Rahman M, Islam S, Bhuiyan M, Islam M. Serum insulin-like growth factor-1 and relaxin-3 are linked with major depressive disorder. Asian J Psychiatr. 2020;53:102164. doi:10.1016/j.ajp.2020.102164
14. Islam M, Ali S, Karmoker J, et al. Evaluation of serum amino acids and non-enzymatic antioxidants in drug-naïve first-episode major depressive disorder. BMC Psychiatry. 2020;20(1):333. doi:10.1186/s12888-020-02738-2
15. Swaab D, Bao A, Lucassen P. The stress system in the human brain in depression and neurodegeneration. Ageing Res Rev. 2005;4(2):141–194. doi:10.1016/j.arr.2005.03.003
16. Strawbridge R, Young A, Cleare A. Biomarkers for depression: recent insights, current challenges and future prospects. Neuropsychiatr Dis Treat. 2017;13:1245–1262. doi:10.2147/NDT.S114542
17. Biggio F, Pisu M, Garau A, et al. Maternal separation attenuates the effect of adolescent social isolation on HPA axis responsiveness in adult rats. Eur Neuropsychopharmacol. 2014;24(7):1152–1161. doi:10.1016/j.euroneuro.2014.03.009
18. Maghsoudi N, Ghasemi R, Ghaempanah Z, Ardekani A, Nooshinfar E, Tahzibi A. Effect of chronic restraint stress on HPA axis activity and expression of BDNF and Trkb in the hippocampus of pregnant rats: possible contribution in depression during pregnancy and postpartum period. Basic Clin Neurosci. 2014;5(2):131–137.
19. Xu Y, Ge J, Qin G, et al. Acute, but not chronic, stress increased the plasma concentration and hypothalamic mRNA expression of NUCB2/nesfatin-1 in rats. Neuropeptides. 2015;54:47–53. doi:10.1016/j.npep.2015.08.003
20. Strawbridge R, Carter B, Marwood L, et al. Augmentation therapies for treatment-resistant depression: systematic review and meta-analysis. Br J Psychiatry. 2019;214(1):42–51. doi:10.1192/bjp.2018.233
21. Ising M, Künzel H, Binder E, Nickel T, Modell S, Holsboer F. The combined dexamethasone/CRH test as a potential surrogate marker in depression. Prog Neuropsychopharmacol Biol Psychiatry. 2005;29(6):1085–1093. doi:10.1016/j.pnpbp.2005.03.014
22. Lang U, Borgwardt S. Molecular mechanisms of depression: perspectives on new treatment strategies. Cell Physiol Biochem. 2013;31(6):761–777. doi:10.1159/000350094
23. Bali A, Singh N, Jaggi A. Neuropeptides as therapeutic targets to combat stress-associated behavioral and neuroendocrinological effects. CNS Neurol Disord Drug Targets. 2014;13(2):347–368. doi:10.2174/1871527313666140314163920
24. Xu Y, Ge J, Liang J, et al. Nesfatin-1 and cortisol: potential novel diagnostic biomarkers in moderate and severe depressive disorder. Psychol Res Behav Manag. 2018;11:495–502. doi:10.2147/PRBM.S183126
25. Ari M, Ozturk O, Bez Y, Oktar S, Erduran D. High plasma nesfatin-1 level in patients with major depressive disorder. Prog Neuropsychopharmacol Biol Psychiatry. 2011;35(2):497–500. doi:10.1016/j.pnpbp.2010.12.004
26. Xiao M, Li J, Jiang L, Shao H, Wang B. Plasma nesfatin-1 level is associated with severity of depression in Chinese depressive patients. BMC Psychiatry. 2018;18(1):88. doi:10.1186/s12888-018-1672-4
27. Korucu C, Atay İ, Zayıf S, Gültekin F. May nesfatin-1 be a state marker in major depressive disorder with suicidal ideation? Psychiatry Res. 2018;267:272–276. doi:10.1016/j.psychres.2018.05.086
28. Brenner R, Madhusoodanan S, Logiudice J, Castell G, MacKenzie T, O’Shaughnessy P. A comparison study of the turnaround time for telepsychiatry versus face-to-face consultations in general hospital nonpsychiatric emergency rooms. Ann Clin Psychiatry. 2020;32(1):12–16.
29. Sonsin-Diaz N, Gottesman R, Fracica E, et al. Chronic systemic inflammation is associated with symptoms of late-life depression: the ARIC Study. Am J Geriatr Psychiatry. 2020;28(1):87–98. doi:10.1016/j.jagp.2019.05.011
30. Eller T, Vasar V, Shlik J, Maron E. Pro-inflammatory cytokines and treatment response to escitalopram in major depressive disorder. Prog Neuropsychopharmacol Biol Psychiatry. 2008;32(2):445–450. doi:10.1016/j.pnpbp.2007.09.015
31. Chang H, Lee I, Gean P, et al. Treatment response and cognitive impairment in major depression: association with C-reactive protein. Brain Behav Immun. 2012;26(1):90–95. doi:10.1016/j.bbi.2011.07.239
32. Amitai M, Taler M, Carmel M, et al. The relationship between plasma cytokine levels and response to selective serotonin reuptake inhibitor treatment in children and adolescents with depression and/or anxiety disorders. J Child Adolesc Psychopharmacol. 2016;26(8):727–732. doi:10.1089/cap.2015.0147
33. Strawbridge R, Hodsoll J, Powell T, et al. Inflammatory profiles of severe treatment-resistant depression. J Affect Disord. 2019;246:42–51. doi:10.1016/j.jad.2018.12.037
34. Dowlati Y, Herrmann N, Swardfager W, et al. A meta-analysis of cytokines in major depression. Biol Psychiatry. 2010;67(5):446–457. doi:10.1016/j.biopsych.2009.09.033
35. Ng A, Tam W, Zhang M, et al. IL-1β, IL-6, TNF- α and CRP in elderly patients with depression or Alzheimer’s disease: systematic review and meta-analysis. Sci Rep. 2018;8(1):12050.
36. Das R, Emon M, Shahriar M, et al. Higher levels of serum IL-1β and TNF-α are associated with an increased probability of major depressive disorder. Psychiatry Res. 2021;295:113568.
37. Zweig M, Campbell G. Receiver-operating characteristic (ROC) plots: a fundamental evaluation tool in clinical medicine. Clin Chem. 1993;39(4):561–577. doi:10.1093/clinchem/39.4.561
38. Emon M, Das R, Nishuty N, Shalahuddin Qusar M, Bhuiyan M, Islam M. Reduced serum BDNF levels are associated with the increased risk for developing MDD: a case-control study with or without antidepressant therapy. BMC Res Notes. 2020;13(1):83. doi:10.1186/s13104-020-04952-3
39. Das R, Emon M, Chowdhury S, Huque S, Zahan T, Islam M. Evaluation of serum glial cell line-derived neurotrophic factor in Bangladeshi major depressive disorder patients. Cureus. 2019;11(11):e6081. doi:10.7759/cureus.6081
40. Anjum S, Qusar M, Shahriar M, Islam S, Bhuiyan M, Islam M. Altered serum interleukin-7 and interleukin-10 are associated with drug-free major depressive disorder. Ther Adv Psychopharmacol. 2020;10:2045125320916655. doi:10.1177/2045125320916655
41. Nishuty N, Khandoker M, Karmoker J, et al. Evaluation of serum interleukin-6 and c-reactive protein levels in drug-naïve major depressive disorder patients. Cureus. 2019;11(1):e3868. doi:10.7759/cureus.3868
42. Islam M, Islam M, Ahmed I, et al. Elevated serum levels of malondialdehyde and cortisol are associated with major depressive disorder: a case-control study. SAGE Open Med. 2018;6:2050312118773953. doi:10.1177/2050312118773953
43. Islam M, Islam M, Shalahuddin Qusar M, et al. Alterations of serum macro-minerals and trace elements are associated with major depressive disorder: a case-control study. BMC Psychiatry. 2018;18(1):94. doi:10.1186/s12888-018-1685-z
44. Keller J, Gomez R, Williams G, et al. HPA axis in major depression: cortisol, clinical symptomatology and genetic variation predict cognition. Mol Psychiatry. 2017;22(4):527–536. doi:10.1038/mp.2016.120
45. Martiny K, Lunde M, Undén M, Dam H, Bech P. High cortisol awakening response is associated with an impairment of the effect of bright light therapy. Acta Psychiatr Scand. 2009;120(3):196–202. doi:10.1111/j.1600-0447.2009.01359.x
46. Juruena M, Pariante C, Papadopoulos A, Poon L, Lightman S, Cleare A. The role of mineralocorticoid receptor function in treatment-resistant depression. J Psychopharmacol. 2013;27(12):1169–1179. doi:10.1177/0269881113499205
47. Fischer S, King S, Papadopoulos A, Hotopf M, Young A, Cleare A. Hair cortisol and childhood trauma predict psychological therapy response in depression and anxiety disorders. Acta Psychiatr Scand. 2018;138(6):526–535. doi:10.1111/acps.12970
48. Jani B, McLean G, Nicholl B, et al. Risk assessment and predicting outcomes in patients with depressive symptoms: a review of potential role of peripheral blood based biomarkers. Front Hum Neurosci. 2015;9:18. doi:10.3389/fnhum.2015.00018
49. Jain F, Connolly C, Reus V, et al. Cortisol, moderated by age, is associated with antidepressant treatment outcome and memory improvement in Major Depressive Disorder: a retrospective analysis. Psychoneuroendocrinology. 2019;109:104386. doi:10.1016/j.psyneuen.2019.104386
50. Hinkelmann K, Moritz S, Botzenhardt J, et al. Changes in cortisol secretion during antidepressive treatment and cognitive improvement in patients with major depression: a longitudinal study. Psychoneuroendocrinology. 2012;37(5):685–692. doi:10.1016/j.psyneuen.2011.08.012
51. Wei J, Sun G, Zhao L, et al. Analysis of hair cortisol level in first-episodic and recurrent female patients with depression compared to healthy controls. J Affect Disord. 2015;175:299–302. doi:10.1016/j.jad.2015.01.023
52. Schalla M, Unniappan S, Lambrecht N, Mori M, Taché Y, Stengel A. NUCB2/nesfatin-1 - Inhibitory effects on food intake, body weight and metabolism. Peptides. 2020;128:170308. doi:10.1016/j.peptides.2020.170308
53. Liu M, Shen X, Du X, Jiang H. Plasma levels of nesfatin-1 as a new biomarker in depression in Asians: evidence from meta-analysis. Biomarkers. 2020;25(3):228–234. doi:10.1080/1354750X.2020.1736157
54. Algul S, Ozcelik O. Evaluating the levels of nesfatin-1 and ghrelin hormones in patients with moderate and severe major depressive disorders. Psychiatry Investig. 2018;15(2):214–218. doi:10.30773/pi.2017.05.24
55. Karadeniz S, Yaman H, Bilginer Ç, Hızarcı Bulut S, Yaman S. Serum nesfatin-1, ghrelin, and lipid levels in adolescents with first episode drug naïve unipolar depression. Nord J Psychiatry. 2020;74(8):613–619. doi:10.1080/08039488.2020.1772363
56. Haroon E, Daguanno A, Woolwine B, et al. Antidepressant treatment resistance is associated with increased inflammatory markers in patients with major depressive disorder. Psychoneuroendocrinology. 2018;95:43–49. doi:10.1016/j.psyneuen.2018.05.026
57. Chamberlain S, Cavanagh J, de Boer P, et al. Treatment-resistant depression and peripheral C-reactive protein. Br J Psychiatry. 2019;214(1):11–19. doi:10.1192/bjp.2018.66
58. Strawbridge R, Arnone D, Danese A, Papadopoulos A, Herane Vives A, Cleare A. Inflammation and clinical response to treatment in depression: a meta-analysis. Eur Neuropsychopharmacol. 2015;25(10):1532–1543. doi:10.1016/j.euroneuro.2015.06.007
59. Sukoff Rizzo S, Neal S, Hughes Z, et al. Evidence for sustained elevation of IL-6 in the CNS as a key contributor of depressive-like phenotypes. Transl Psychiatry. 2012;2:e199. doi:10.1038/tp.2012.120
60. Born J, Hansen K, Marshall L, Mölle M, Fehm H. Timing the end of nocturnal sleep. Nature. 1999;397(6714):29–30.
 © 2022 The Author(s). This work is published and licensed by Dove Medical Press Limited. The full terms of this license are available at https://www.dovepress.com/terms.php and incorporate the Creative Commons Attribution - Non Commercial (unported, v3.0) License.
By accessing the work you hereby accept the Terms. Non-commercial uses of the work are permitted without any further permission from Dove Medical Press Limited, provided the work is properly attributed. For permission for commercial use of this work, please see paragraphs 4.2 and 5 of our Terms.
© 2022 The Author(s). This work is published and licensed by Dove Medical Press Limited. The full terms of this license are available at https://www.dovepress.com/terms.php and incorporate the Creative Commons Attribution - Non Commercial (unported, v3.0) License.
By accessing the work you hereby accept the Terms. Non-commercial uses of the work are permitted without any further permission from Dove Medical Press Limited, provided the work is properly attributed. For permission for commercial use of this work, please see paragraphs 4.2 and 5 of our Terms.