Back to Journals » Neuropsychiatric Disease and Treatment » Volume 15
Serum BICC1 levels are significantly different in various mood disorders
Authors Chen S ![]() , Jiang H, Xu Z, Zhao J, Wang M, Lu Y, Li J, Sun F, Yuan Y
, Jiang H, Xu Z, Zhao J, Wang M, Lu Y, Li J, Sun F, Yuan Y ![]()
Received 7 October 2018
Accepted for publication 14 December 2018
Published 15 January 2019 Volume 2019:15 Pages 259—265
DOI https://doi.org/10.2147/NDT.S190048
Checked for plagiarism Yes
Review by Single anonymous peer review
Peer reviewer comments 3
Editor who approved publication: Dr Yu-Ping Ning
Suzhen Chen,1,2 Haitang Jiang,1,2 Zhi Xu,1,2 Jingjing Zhao,3 Ming Wang,4 Yan Lu,5 Jianhua Li,6 Fei Sun,7 Yonggui Yuan1,2
1Department of Psychosomatics and Psychiatry, ZhongDa Hospital, School of Medicine, Southeast University, Nanjing 210009, PR China; 2Institute of Psychosomatics, School of Medicine, Southeast University, Nanjing 210009, PR China; 3Department of Psychiatry, Brain Hospital, Nanjing Medical University, Nanjing 210029, PR China; 4Department of Psychiatry, The Third People’s Hospital of Changshu, Suzhou 215500, PR China; 5Department of Psychiatry, The Fourth People’s Hospital of Zhangjiagang, Suzhou 215600, PR China; 6Department of Psychiatry, The Third People’s Hospital of Huzhou, Huzhou 313000, PR China; 7Department of Psychiatry, The Second People’s Hospital of Jingjiang, Taizhou 214500, PR China
Purpose: Mood disorders are recurrent chronic disorders with fluctuating mood states and energy, and misdiagnosis is common when based solely on clinical interviews because of overlapping symptoms. Because misdiagnosis may lead to inappropriate treatment and poor prognosis, finding an easily implemented objective tool for the discrimination of different mood disorders is very necessary and urgent. However, there has been no accepted objective tool until now. Recently, BICC1 has been identified as a candidate gene relating to major depressive disorder (MDD). Therefore, the aim of this study is to evaluate the ability of serum BICC1 to discriminate between various mood disorders, including MDD and the manic and depressive phases of bipolar disorder, namely bipolar mania (BM) and bipolar depression (BD).
Patients and methods: Serum BICC1 levels in drug-free patients with MDD (n=30), BM (n=30), and BD (n=13), and well-matched healthy controls (HC, n=30) were measured with ELISA kits. Pearson correlation analyses were used to analyze the correlations between serum BICC1 levels and clinical information. Receiver operating characteristic (ROC) curve analysis was used to analyze the differential discriminative potential of BICC1 for different mood disorders.
Results: One-way ANOVA indicated that serum BICC1 levels were significantly increased in all patient groups compared with the HC group and significantly different between each pair of patient groups. Correlation analyses found no relationship between serum BICC1 levels and any clinical variables in any study group. ROC curve analysis showed that serum BICC1 could discriminate among all three mood disorders from each other accurately with fair-to-excellent discriminatory capacity (area under the ROC curve from 0.787 to 1.0).
Conclusion: The findings of this preliminary study indicated significant differences in serum BICC1 levels in patients with different mood disorders. This study provides preliminary evidence that serum BICC1 may be regarded as a promising, objective, easy-to-use tool for diagnosing different mood disorders.
Keywords: biomarker, mood disorder, diagnosis, differential diagnosis, objective tool, BICC1
Introduction
Mood disorders including major depressive disorder (MDD) and bipolar disorder, with a 12-month prevalence of >9%,1 are recurrent chronic disorders that mainly show a pattern of fluctuations in mood state and energy. People with mood disorders may suffer from poor physical health, absence from work, impaired quality of life, and other impaired functions as well as personal and socioeconomic consequences. According to the Global Burden of Disease Study conducted in 2010, MDD and bipolar disorder accounted for 40.5% and 7%, respectively, of the disease burden attributable to mental and substance use disorders in terms of the disability-adjusted life years.2 Patients with different mood disorders frequently present with similar or identical symptoms or deny symptomatology, frequently resulting in misdiagnosis. Currently, there are no objective diagnostic tools for easy use, and the diagnosis of mental disorders is still based on the evaluation of symptoms and relies on clinical interviews, leading to difficulty in obtaining a timely diagnosis and suitable treatment. While the use of antidepressant drugs is appropriate in MDD, it is controversial in bipolar depression (BD), the depressive phase of bipolar disorder, and prohibitive in the manic phase of bipolar disorder, namely bipolar mania (BM). Therefore, a higher diagnostic yield needs to be achieved to make a correct differential diagnosis of various mood disorders.
Genetic, environmental, and psychological factors are related to the incidence of mood disorders, and many scholars have attempted to find specific biomarkers for an objective diagnosis based on some aspect of the genetics, proteomics, imaging data, and electrophysiological findings.3 Researchers have reported some positive results that may be associated with susceptibility to mood disorders. For example, genetic studies have indicated that BDNF, BICC1, and other genes may be involved in mood disorders.4,5 Moreover, researchers have also found that peripheral proteins may be promising, easy-to-use diagnostic tools for mental disorders.6–8
The BICC1 gene codes for an RNA-binding protein that is expressed widely throughout all brain regions and in peripheral tissues.9 It has been well studied in the process of development, polycystic kidney disease, and in modulating bone density.10–13 In addition, it has been identified as a candidate gene relating to MDD by genome-wide association studies.5 Additionally, researchers found that the BICC1 protein level was elevated in the prefrontal cortex and hippocampus of postmortem MDD subjects and in rats exposed to chronic unpredictable stress (CUS), while knockdown of BICC1 rescued depressive behavior following CUS.14 However, whether the BICC1 protein level also increases in the peripheral blood in MDD patients, how it changes in patients with bipolar disorder, and the relations between peripheral BICC1 levels in different mood disorders are unknown.
In the current study, we investigated serum BICC1 protein levels in MDD patients, BM patients, BD patients, and healthy controls (HC). We sought to evaluate whether serum BICC1 levels among these above groups were significantly different from each other and the feasibility of using serum BICC1 protein levels as a biomarker for identifying different mood disorders. The results of the present study demonstrated that serum BICC1 protein levels in different types of mood disorders are significantly different, and BICC1 has the potential to be an objective diagnostic tool for differentiating mood disorders.
Patients and methods
Human subjects
According to the principles expressed in the Declaration of Helsinki, written informed consent was obtained from all subjects or their legal guardians when they well understood the study, and the protocol of the study was approved by the Ethical Committee of the Affiliated ZhongDa Hospital of Southeast University.
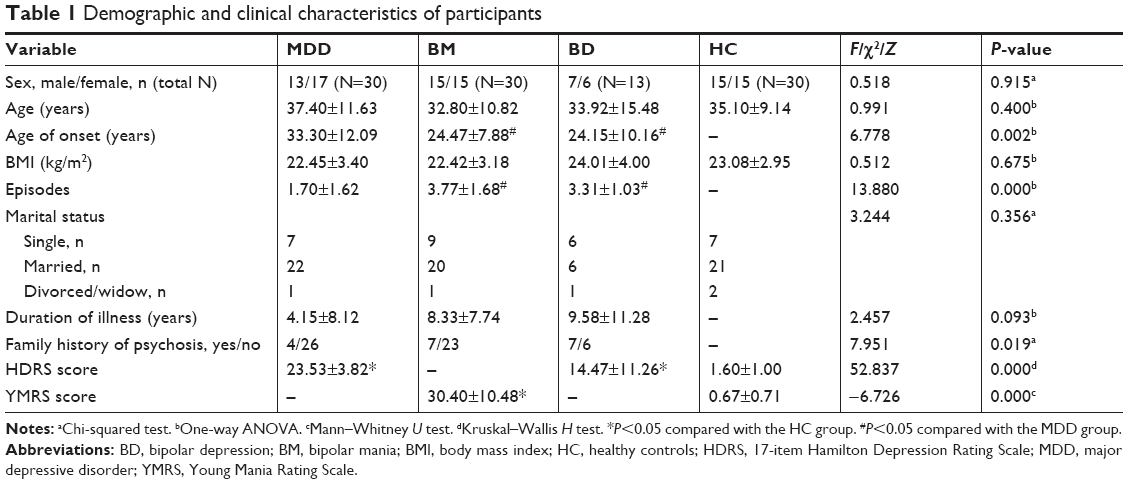
A total of 73 drug-free patients, who were 16–60 years old, from Affiliated ZhongDa Hospital of Southeast University, Affiliated Brain Hospital of Nanjing Medical University, the Fourth People’s Hospital of Zhangjiagang, the Third People’s Hospital of Changshu, the Third People’s Hospital of Huzhou, and the Second People’s Hospital of Jingjiang were recruited between April 2016 and December 2016. According to the Diagnostic and Statistical Manual of Mental Disorders IV (DSM-IV)15 criteria, patients were diagnosed with MDD (13 males/17 females), bipolar disorder type I, manic episode (BM, 15 males/15 females), or bipolar disorder type I, depressive episode (BD, 7 males/6 females) (Table 1). Furthermore, the BM patients suffered at least one depressive episode before, and the current manic episode lasted for at least 1 week. Similarly, BD patients had at least one classic manic episode previously and had been depressed for >2 weeks during the current episode. Thirty well-matched HC (15 males/15 females) without any history of mental or severe somatic disorders, or a positive family history of mental disorders, were also recruited from Affiliated ZhongDa Hospital of Southeast University Medical Examination Center during the same time frame for the study.
 | Table 1 Demographic and clinical characteristics of participants |
All participants attended a clinical interview, underwent laboratory tests, and received a physical examination to rule out physical illnesses. Participants with any severe physical diseases including organic brain diseases, hypertension, diabetes mellitus, tumor, thyroid disease, etc, were excluded from this study. Participants who took drugs within the 2 weeks before entering the trial were excluded. Additionally, pregnant or lactating females were also not included.
Clinical assessment
We collected detailed information from all subjects when they were enrolled, including age, sex, marital status, years of education, body mass index (BMI), family history, and the scores of observer-rated scales especially designed for depression and mania. Two trained and experienced senior psychiatrists evaluated the observer-rated scales for patients with MDD, BM, and BD as well as HC. We used the 17-item Hamilton Depression Rating Scale (HDRS)16 to assess the severity of depressive symptoms in MDD and BD patients and the Young Mania Rating Scale (YMRS)17 to estimate the manic severity of BM patients. Additionally, HDRS and YMRS were also used to evaluate whether HC had any mental symptoms; scores of both scales were normal for HC.
Blood sample collection
Fasting venous blood samples (5 mL) were collected in coagulant tubes from all participants between 06:30 and 08:00. We used a centrifuge at 3,500 rpm for 10 minutes to separate the blood samples after they had solidified at room temperature and stored them as aliquots (0.5 mL) in a −80°C freezer until assayed.
Protein assays
ELISA was used to detect serum BICC1 levels (ELISA kits for human BICC1; HG6023; Hermes Criterion Biotechnology [HCB], Vancouver, BC, Canada). We measured serum BICC1 levels of all subjects according to the manufacturer’s instructions on the same day. The detection limits of the ELISA kits ranged between 25 and 1,500 pg/L. Absorbances were measured by microtiter plate reader (absorbency at 450 nm).
Statistical analysis
We used SPSS (version 22; IBM Corporation, Armonk, NY, USA) to analyze the data, and the statistical computations were expressed as the mean ± SD. The chi-squared test was used to compare categorical data, such as sex. For between-group comparisons, Student’s t-test was used to compare the normally distributed data, while the Mann–Whitney U test was used to compare data that were not normally distributed. One-way ANOVA (for normal distributions) and Kruskal–Wallis H test (for nonnormal distributions) were performed for multiple-group parametric comparisons as applicable. Differences were considered statistically significant at P<0.05. Post hoc analyses were carried out using Tukey’s test or a Dunn–Bonferroni test as applicable. Furthermore, Pearson’s correlation analyses were used to assess the relationship between serum BICC1 protein levels and clinical variables.
We calculated the area under the receiver operating characteristic (ROC) curve (AUC) (AUC: 0.9–1= excellent; 0.8–0.9= good; 0.7–0.8= fair; 0.6–0.7= poor; 0.5–0.6= fail)7 using logistic regression, and sensitivity and specificity were determined to evaluate the capacity of BICC1 to discriminate between every two groups for differentiating MDD, BM, and BD patients and HC. Maximizing Youden’s index (J; where J = sensitivity + specificity −1) was used to determine optimal trade-offs between sensitivity and specificity.7
Results
The demographic and neuropsychological characteristics of all participants are listed in Table 1. These four study groups did not differ in age, sex, BMI, or marital status from each other, and the duration of illness between the three patient groups was not significantly different (Table 1, all P>0.05). However, age of onset (F=6.778, P=0.002), number of episodes (F=13.880, P<0.001), and family history (χ2=7.951, P=0.019) between the three patient groups were significantly different. At baseline, the scores of various scales between the different study groups were also significantly different (all P<0.001).
Serum BICC1 levels were detected in all patients and the matched HC. As shown in Figure 1, the expression levels of BICC1 in serum were significantly higher in the patient groups than in the HC group. In addition, as seen in Figure 1, serum BICC1 levels were significantly different between each pair of patient groups as revealed by one-way ANOVA followed by Tukey’s test (all PTukey <0.001).
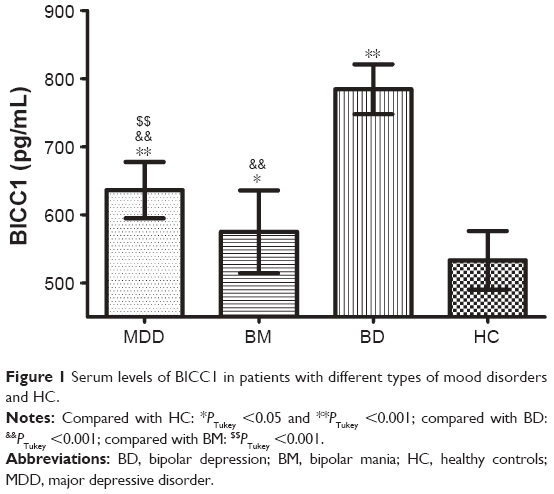 | Figure 1 Serum levels of BICC1 in patients with different types of mood disorders and HC. |
Pearson’s correlation analyses showed no correlations among serum BICC1 expression levels and age, age of onset, years of education, number of episodes, BMI, duration of illness, and the severity of various symptoms in any patient group (all P>0.05).
Further, we used the ROC curve analysis to analyze the diagnostic and discriminative power of serum BICC1. The ROC curves of serum BICC1 between each pair of groups are presented in Figure 2.
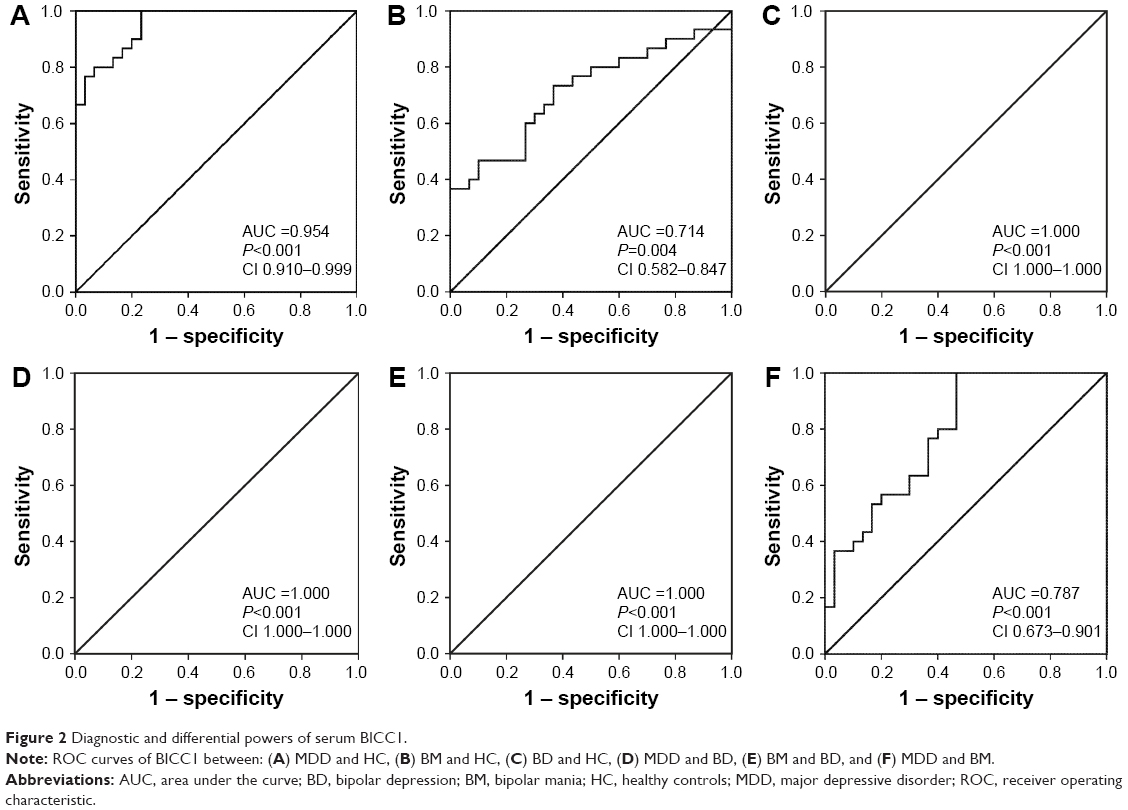 | Figure 2 Diagnostic and differential powers of serum BICC1. |
Figure 2A–F shows the ROC curves of BICC1 in MDD and HC, BM and HC, BD and HC, MDD and BD, BM and BD, and MDD and BM groups, respectively. The AUC representing the diagnostic power of serum BICC1 for MDD in Figure 2 was 0.954 (95% CI 0.910–0.999), which means that on average, the test would correctly predict an MDD diagnosis 95.4% of the time. From the ROC curve in Figure 2A, the sensitivity and specificity of serum BICC1 in diagnosing MDD were calculated as 100% and 76.7%, respectively, and the optimal cutoff value was 569.75 pg/mL. Similarly, the AUC representing the diagnostic capability of serum BICC1 for BM and BD in Figure 2B and C was 0.714 (95% CI 0.582–0.847) and 1.0, respectively. BICC1 showed the highest sensitivity (100%) and specificity (100%) when diagnosing BD, whereas the sensitivity and specificity were 36.7% and 100%, respectively, when diagnosing BM. The detailed results of ROC curve analysis of the potential of BICC1 to discriminate among MDD, BM, and BD are shown in Figure 2 and Table 2.
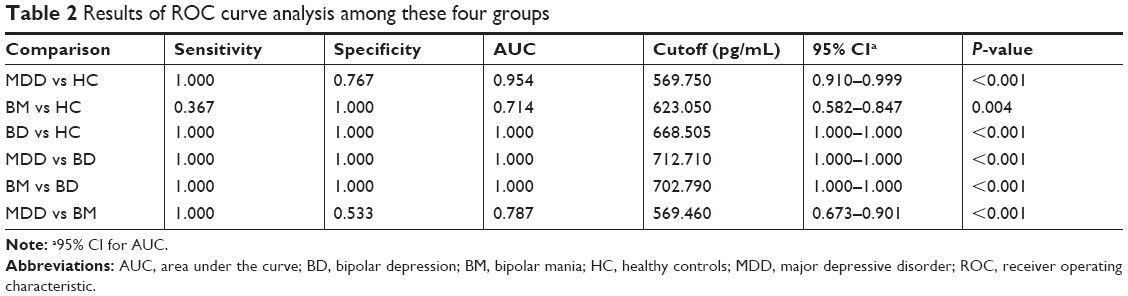 | Table 2 Results of ROC curve analysis among these four groups |
To investigate the differential capability of BICC1 to distinguish various patient groups from each other, ROC analysis between MDD and BD, BM and BD, and MDD and BM was performed. As Figure 2D–F shows, serum BICC1 showed a fair-to-excellent differential effectiveness with an AUC of 1.0 (95% CI 1.0–1.0), 1.0 (95% CI 1.000–1.000), and 0.787 (95% CI 0.673–0.901) for discriminating MDD from BD, BM from BD, and MDD from BM, respectively. Furthermore, both sensitivity and specificity were 100% for discriminating BD from MDD and BM, while sensitivity and specificity for distinguishing MDD from BM were 100% and 53.3%, respectively (Table 2). The ROC analysis showed that serum BICC1 could effectively discriminate BD subjects from HC, MDD subjects from BD subjects, as well as BM subjects from BD subjects with an AUC of 1.0.
Discussion
This study was novel in the way that we studied the role of serum BICC1 levels in patients with different mood disorders. The analysis of BICC1 levels in a total of 103 serum samples (30 from MDD patients, 30 from BM patients, 13 from BD patients, and 30 from HC) showed a significantly different BICC1 level in each group (Figure 1). Moreover, the ROC analysis provided evidence that serum BICC1 can differentiate patients with MDD, BM, and BD from HC and each other (Figure 2). Importantly, the results demonstrated the feasibility of using serum BICC1 levels as a diagnostic tool for different mood disorders.
Currently, the diagnosis of mental disorders is based on clinical criteria, such as DSM-IV or ICD-10,15 which solely rely on clinical manifestations or complaints of patients and their family members. As stated previously, misdiagnosis is common because of the nonspecific clinical symptoms of different mental disorders, such as schizophrenia and affective disorder, both of which could have hallucinations or delusions. There remains no clinical or laboratory finding that is specific for different mental disorders so far.
The present study investigated the diagnostic specificity of serum BICC1 obtained from the blood samples of patients with MDD, BM, and BD. The results indicated that the levels of BICC1 were significantly increased in the serum of patients with mood disorders compared with HC. The elevated serum BICC1 level in MDD patients was consistent with the results that BICC1 mRNA was upregulated in the brain of postmortem MDD patients and the rat CUS model of depression,14 suggesting that the peripheral expression of BICC1 may reflect the levels in the brain. Apart from the studies in MDD patients or depression-like animal models, we did not find any other studies about BICC1 in patients with BM and BD. However, the findings suggested that serum BICC1 levels changed significantly not only in MDD patients but also in patients with BM and BD compared with HC. Furthermore, there were significant differences in serum levels of BICC1 between each pair of groups among the study groups, suggesting that BICC1 may be implicated in the pathophysiology of mood disorders.
Until now, there are no studies investigating the relations between BICC1 and any clinical variables. In our present study, we explored these relations using correlation analyses. However, the results indicated that serum BICC1 levels were not related to any demographic or neuropsychological characteristics, including age, age of onset, BMI, duration of illness, and severity of symptoms.
In addition to the serum levels and the correlation analysis, we also investigated the efficacy of BICC1 as a disease-specific biomarker for diagnosing different mood disorders using the ROC analysis. The results of the present study suggested that alteration in serum levels of BICC1 helped to discriminate MDD, BM, and BD patients from HC with AUC values of 0.714–1.0, a sensitivity level of 36.7%–100%, and a specificity level of 76.7%–100%. Moreover, we also found that the differences in serum BICC1 levels enabled to correctly differentiate between different mood disorders with AUC values of 0.787–1.0, a sensitivity of 100%, and a specificity of 53.3%–100%. Furthermore, the study showed that BICC1 levels were able to discriminate between BD and HC, MDD and BD, as well as BM and BD with a 100% specificity and 100% sensitivity and an AUC of 1.0. Additionally, as peripheral blood is readily accessible, our finding indicates that serum BICC1 level can be used as a diagnostic and differential diagnosis tool for various types of mood disorders. For effective therapeutic interventions, an accurate identification of individuals with different mood disorders is critical.
Disrupted synaptic plasticity has been reported to be closely related to the pathogenesis of MDD according to the neurotrophic hypothesis. Previous research has shown that overexpression of BICC1 could potentially affect synaptic plasticity, which is disrupted by chronic stress and MDD.18,19 Furthermore, researchers have also reported that BICC1 acts through its sterile alpha motif domain to block Wnt signaling, a pathway associated with the pathophysiology of MDD.20,21 However, knockdown of BICC1 in the hippocampus protected rats from CUS-induced depressive behavior, and a single acute antidepressant dose of ketamine resulted in rapid BICC1 mRNA downregulation in vivo.14 In addition, scopolamine (25 or 50 mg/kg) treatment significantly reversed the upregulation of BICC1 in the prefrontal cortex of the CUS-induced depressive mice.22 These findings may explain the observation of enhanced levels of serum BICC1 in patients with mood disorders and suggest that the increased levels of BICC1 may be associated not only with the pathophysiology of MDD but also with other types of mood disorders.
These results highlight a new approach for diagnosing different mood disorders by utilizing serum BICC1 levels. Nevertheless, there are some limitations in the present study. First, the sample size was small and the study did not analyze data from the posttreatment groups. Next, although all patients in the study underwent a 2-week washout period, we did not know whether the drug treatment taken 2 weeks before the study influenced serum BICC1 levels. Finally, we recruited patients from several hospitals, which may have resulted in heterogeneity of the severity of illness. Therefore, we should detect serum BICC1 levels in large drug-naïve samples and conduct a posttreatment study to further confirm these preliminary findings.
Conclusion
To our knowledge, this was the first time that serum BICC1 levels were measured in patients with different mood disorders. Our study demonstrated that serum BICC1 levels were significantly higher in drug-free patients with MDD, BM, and BD than in HC. Furthermore, there were significant differences in the upregulated levels among these three patient groups. We also explored the relationship between serum BICC1 levels and various clinical variables by correlation analysis. Unfortunately, no correlations were found between serum BICC1 and any demographic or neuropsychological characteristics in any study group. The ROC analysis, however, indicated that serum BICC1 displayed fair-to-excellent differential power with AUC values from 0.787 to 1.0. The results suggested that BICC1 may be involved in the pathophysiology of mood disorders and that serum BICC1 may be a promising easy-to-use objective tool for diagnosing different mood disorders.
Data sharing statement
The data and material supporting the results of this article are included within the article.
Acknowledgments
The authors would like to thank all the subjects of the trial. They would also like to thank Yinghui Li, Xiaodong Mou, Lei Li, Tianyu Wang, Chongyang Han, Yuxiu Sui, Zhong Yang, Yifeng Zhu, Xinhua Shen, and Qingsong Chen for recruiting the subjects, and Zhenhua Hou, Yingying Yue, Yuqun Zhang, and Fuying Zhao for checking data. This work was supported by the National Natural Science Foundation of China (No 81071101, 81571330, and 81301167) and the National Key Research and Development Program of China (No 2016YFC1306700).
Author contributions
All authors contributed to data analysis, drafting or revising the article, gave final approval of the version to be published, and agree to be accountable for all aspects of the work.
Disclosure
The authors report no conflicts of interest in this work.
References
Kessler RC, Chiu WT, Demler O, Merikangas KR, Walters EE, Prevalence WEE. Prevalence, severity, and comorbidity of 12-month DSM-IV disorders in the National Comorbidity Survey Replication. Arch Gen Psychiatry. 2005;62(6):617–627. | ||
Whiteford HA, Degenhardt L, Rehm J, et al. Global burden of disease attributable to mental and substance use disorders: findings from the Global Burden of Disease Study 2010. Lancet. 2013;382(9904):1575–1586. | ||
Schwarz E, Bahn S. The utility of biomarker discovery approaches for the detection of disease mechanisms in psychiatric disorders. Br J Pharmacol. 2008;153(Suppl 1):S133–S136. | ||
Nassan M, Croarkin PE, Luby JL, et al. Association of brain-derived neurotrophic factor (BDNF) Val66Met polymorphism with early-onset bipolar disorder. Bipolar Disord. 2015;17(6):645–652. | ||
Ryan J, Artero S, Carrière I, et al. GWAS-identified risk variants for major depressive disorder: preliminary support for an association with late-life depressive symptoms and brain structural alterations. Eur Neuropsychopharmacol. 2016;26(1):113–125. | ||
Bilello JA, Thurmond LM, Smith KM, et al. MDDScore: confirmation of a blood test to aid in the diagnosis of major depressive disorder. J Clin Psychiatry. 2015;76(2):e199–e206. | ||
Haenisch F, Cooper JD, Reif A, et al. Towards a blood-based diagnostic panel for bipolar disorder. Brain Behav Immun. 2016;52:49–57. | ||
Lai CY, Scarr E, Udawela M, Everall I, Chen WJ, Dean B. Biomarkers in schizophrenia: a focus on blood based diagnostics and theranostics. World J Psychiatry. 2016;6(1):102–117. | ||
Lewis CM, Ng MY, Butler AW, et al. Genome-wide association study of major recurrent depression in the U.K. population. Am J Psychiatry. 2010;167(8):949–957. | ||
Guay-Woodford LM. Murine models of polycystic kidney disease: molecular and therapeutic insights. Am J Physiol Renal Physiol. 2003;285(6):F1034–F1049. | ||
Maisonneuve C, Guilleret I, Vick P, et al. Bicaudal C, a novel regulator of Dvl signaling abutting RNA-processing bodies, controls cilia orientation and leftward flow. Development. 2009;136(17):3019–3030. | ||
Fu Y, Kim I, Lian P, et al. Loss of Bicc1 impairs tubulomorphogenesis of cultured IMCD cells by disrupting E-cadherin-based cell-cell adhesion. Eur J Cell Biol. 2010;89(6):428–436. | ||
Mesner LD, Ray B, Hsu YH, et al. Bicc1 is a genetic determinant of osteoblastogenesis and bone mineral density. J Clin Invest. 2014;124(6):2736–2749. | ||
Ota KT, Andres W, Lewis DA, Stockmeier CA, Duman RS. BICC1 expression is elevated in depressed subjects and contributes to depressive behavior in rodents. Neuropsychopharmacology. 2015;40(3):711–718. | ||
Lopez Ibor JJ, Frances A, Jones C. Dysthymic disorder: a comparison of DSM-IV and ICD-10 and issues in differential diagnosis. Acta Psychiatr Scand Suppl. 1994;383:12–18. | ||
Hamilton M. A rating scale for depression. J Neurol Neurosurg Psychiatry. 1960;23:56–62. | ||
Young RC, Biggs JT, Ziegler VE, Meyer DA. A rating scale for mania: reliability, validity and sensitivity. Br J Psychiatry. 1978;133:429–435. | ||
Liu RJ, Aghajanian GK. Stress blunts serotonin- and hypocretin-evoked EPSCs in prefrontal cortex: role of corticosterone-mediated apical dendritic atrophy. Proc Natl Acad Sci U S A. 2008;105(1):359–364. | ||
Li N, Liu RJ, Dwyer JM, et al. Glutamate N-methyl-D-aspartate receptor antagonists rapidly reverse behavioral and synaptic deficits caused by chronic stress exposure. Biol Psychiatry. 2011;69(8):754–761. | ||
Kraus MR, Clauin S, Pfister Y, et al. Two mutations in human BICC1 resulting in Wnt pathway hyperactivity associated with cystic renal dysplasia. Hum Mutat. 2012;33(1):86–90. | ||
Voleti B, Tanis KQ, Newton SS, Duman RS. Analysis of target genes regulated by chronic electroconvulsive therapy reveals role for Fzd6 in depression. Biol Psychiatry. 2012;71(1):51–58. | ||
Yu H, Li M, Zhou D, et al. Vesicular glutamate transporter 1 (VGLUT1)-mediated glutamate release and membrane GluA1 activation is involved in the rapid antidepressant-like effects of scopolamine in mice. Neuropharmacology. 2018;131:209–222. |
 © 2019 The Author(s). This work is published and licensed by Dove Medical Press Limited. The
full terms of this license are available at https://www.dovepress.com/terms
and incorporate the Creative Commons Attribution
- Non Commercial (unported, 3.0) License.
By accessing the work you hereby accept the Terms. Non-commercial uses of the work are permitted
without any further permission from Dove Medical Press Limited, provided the work is properly
attributed. For permission for commercial use of this work, please see paragraphs 4.2 and 5 of our Terms.
© 2019 The Author(s). This work is published and licensed by Dove Medical Press Limited. The
full terms of this license are available at https://www.dovepress.com/terms
and incorporate the Creative Commons Attribution
- Non Commercial (unported, 3.0) License.
By accessing the work you hereby accept the Terms. Non-commercial uses of the work are permitted
without any further permission from Dove Medical Press Limited, provided the work is properly
attributed. For permission for commercial use of this work, please see paragraphs 4.2 and 5 of our Terms.