Back to Journals » Cancer Management and Research » Volume 11
SERS-based detection of haptoglobin in ovarian cyst fluid as a point-of-care diagnostic assay for epithelial ovarian cancer
Authors Perumal J ![]() , Mahyuddin AP, Balasundaram G
, Mahyuddin AP, Balasundaram G ![]() , Goh D
, Goh D ![]() , Fu CY, Kazakeviciute A, Dinish US, Choolani M
, Fu CY, Kazakeviciute A, Dinish US, Choolani M ![]() , Olivo M
, Olivo M
Received 26 August 2018
Accepted for publication 25 October 2018
Published 31 January 2019 Volume 2019:11 Pages 1115—1124
DOI https://doi.org/10.2147/CMAR.S185375
Checked for plagiarism Yes
Review by Single anonymous peer review
Peer reviewer comments 2
Editor who approved publication: Dr Chien-Feng Li
Jayakumar Perumal,1,* Aniza Puteri Mahyuddin,2,* Ghayathri Balasundaram,1,* Douglas Goh,1 Chit Yaw Fu,1 Agne Kazakeviciute,1,3 US Dinish,1 Mahesh Choolani,2 Malini Olivo1
1Laboratory of Bio-optical Imaging, Singapore Bioimaging Consortium, Agency for Science Technology and Research (A*STAR), Singapore; 2Department of Obstetrics and Gynecology, Yong Loo Lin School of Medicine, National University of Singapore, Singapore; 3Department of Mathematics, Brunel University London, Uxbridge, UK
*These authors contributed equally to this work
Purpose: To evaluate haptoglobin (Hp) in ovarian cyst fluid as a diagnostic biomarker for epithelial ovarian cancers (EOCs) using surface-enhanced Raman spectroscopy (SERS)-based in vitro diagnostic assay for use in an intraoperative setting.
Methods: SERS-based method was used to detect and quantify Hp in archived ovarian cyst fluids collected from suspicious ovarian cysts and differentiate benign tumors from EOCs. The diagnostic performance of SERS-based assay was verified against the histopathology conclusions and compared with the results of CA125 test and frozen sections.
Results: Hp concentration present in the clinical cyst fluid measured by SERS was normalized to 3.3 mg/mL of standard Hp. Normalized mean values for patients with benign cysts were 0.65 (n=57) and malignant cysts were 1.85 (n=54), demonstrating a significantly (P<0.01) higher Hp in malignant samples. Verified against histology, Hp measurements using SERS had a sensitivity of 94% and specificity of 91%. Receiver operating characteristic curve analysis of SERS-based Hp measurements resulted in area under the curve of 0.966±0.03, establishing the robustness of the method. CA125 test on the same set of patients had a sensitivity of 85% and specificity of 90%, while frozen section analysis on 65 samples had 100% sensitivity and specificity.
Conclusion: With a total execution time of <10 minutes and consistent performance across different stages of cancer, the SERS-based Hp detection assay can serve as a promising intraoperative EOC diagnostic test.
Keywords: surface-enhanced Raman spectroscopy, haptoglobin, epithelial ovarian cancer, ovarian cyst fluid, point-of-care diagnostics
Introduction
Ovarian cancer is the most lethal gynecological cancer and the eighth most common cause of death in women.1 Ninety percent of the ovarian cancers arise from the thin layer of epithelial tissue that covers the ovaries and hence called epithelial ovarian cancer (EOC). The 5-year prognosis for EOC is dismal as the disease often presents itself in the advanced stages with metastasis to the peritoneal and pelvic cavities.2,3 At the late stage, the 5-year prognosis is <40%,4 whereas if diagnosis was made at an early stage, the 5-year prognosis is >90%.5 Women with EOCs are either asymptomatic or would have “vague” symptoms at an early stage, which poses a challenge to physicians and often leads to significant delays in diagnosis.6,7 Currently, there is no known screening modality which is cost-effective and helps in lowering mortality rates.4,8
The use of intraoperative frozen section (FS) has been proposed to prevent delay in primary surgery. Although intraoperative FS has been widely used in clinical settings,9–11 it does suffer from several limitations such as variation in accuracy as a result of large cyst size, nonuniformity of the tissue malignancy resulting in sampling error, and finally, limited availability of staining methods11,12 resulting in misdiagnosis or underdiagnosis of the disease condition. Hence, there is a strong need for an intraoperative diagnostic solution.
Haptoglobin (Hp), an acute phase serum glycoprotein, is observed to be elevated in the sera and ascetic fluid of EOC patients,13,14 and thus, it serves as an effective biomarker for EOC. However, due to the time-consuming biochemical methods to detect Hp, its intraoperative use as a biomarker is impractical. The widely available method so far for detecting Hp is the use of ultraviolet spectroscopy similar to the standard ELISA assay.13,14 This technique is affected by poor sensitivity at lower concentrations of the peroxidase product and also any coloration arising from the cyst fluid samples (which can range from transparent to dark brown). Therefore, a highly sensitive method that can detect low concentrations of Hp and remains unaffected by the sample coloration would make a promising intraoperative diagnostic test.
We have previously demonstrated the proof of concept for the detection and quantification of Hp using a surface-enhanced Raman spectroscopy (SERS)-based assay with a detection limit of 50 nM and which is not affected by exogenous coloration due to the unique fingerprint spectrum associated with the molecule of interest.15 In the current study, we hypothesize that our highly sensitive and efficient SERS-based Hp detection assay can serve as an in vitro diagnostic test in an intraoperative setting to rapidly differentiate benign tumors from malignant EOCs based on the amount of Hp in the ovarian cyst fluid (OCF).
Materials and methods
Chemicals such as 3,3′,5,5′-tetramethylbenzidine (TMB), citric acid, buffer solutions along with biologicals such as hemoglobin (Hb) and BSA were purchased from Sigma-Aldrich (St Louis, MO, USA). Hp antigen of human origin was purchased from Abcam (Cambridge, MA, USA). Au colloid (60 nm) was obtained from BBI solutions (Crumlin, UK).
Clinical sample collection
OCF samples were collected during surgery without spillage into the abdominal cavity. Samples were later transported on ice to the laboratory, centrifuged at 2,000×g for 10 minutes at 4°C, and the supernatant archived at –80°C until analysis. All specimens were collected after obtaining written informed consent from each subject (parent or legal guardian provided the written informed consent for any patient under the age of 18) and used in accordance with the local ethics committee approved protocol numbered D2007/240.
Sample preparation
Hp forms an irreversible complex with Hb in a ratio of 1:0.5–0.9, as detailed in the Sigma-Aldrich website. Purified Hp (ab90924) or clinical OCFs were mixed with 3.3 mg/mL human Hb in equal volumes and left to react for several minutes to form (Hb–Hp) complex. Five microliters of (Hb–Hp) complex is added to 10 µL of TMB in an Eppendorf tube and allowed to react for a few minutes at room temperature. Stop solution was added and vortexed well to quench the reaction. Gold nanoparticles (5.2×1.010 particles/mL) were added to the reaction mixture. Twenty microliters of the above reaction mixture was dropped onto a clean glass slide with a cover slip on top to be read using Raman microscope. Figure 1 shows the schematic of SERS-based assay for Hp detection.
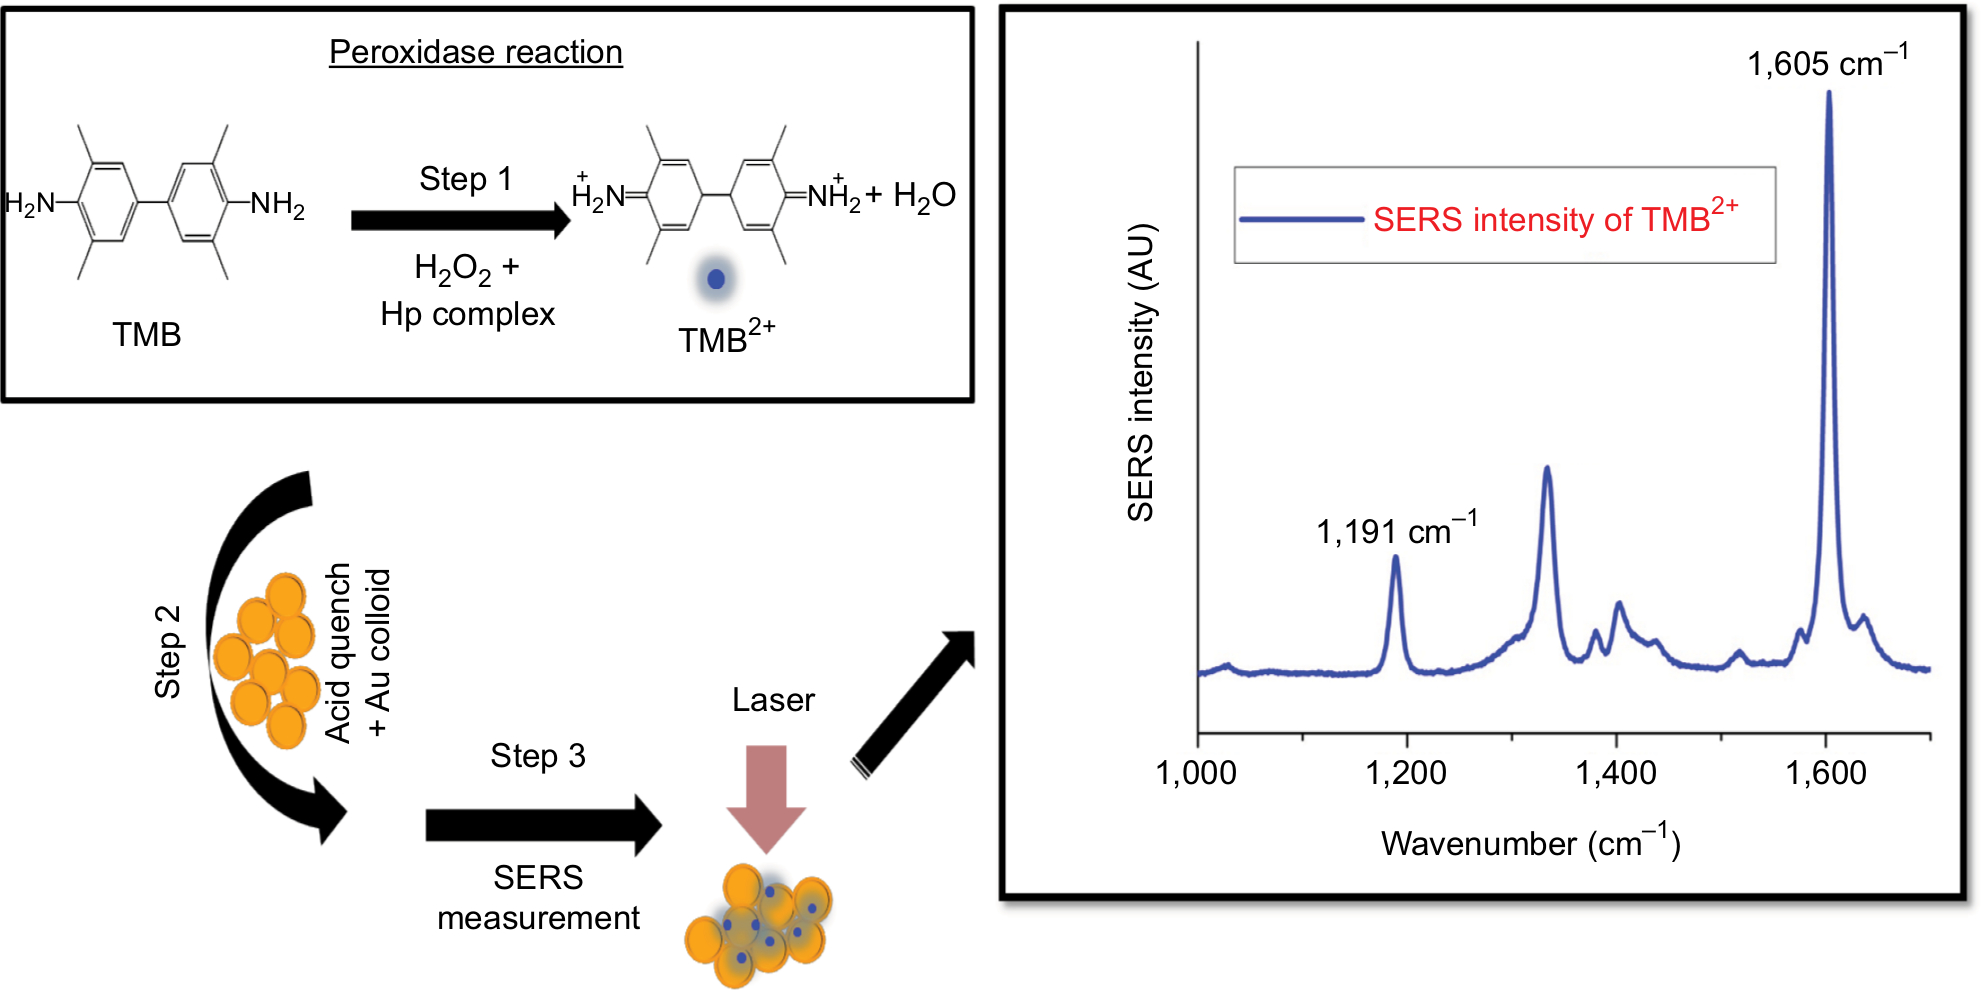 | Figure 1 Schematic of SERS-based assay for Hp detection. Abbreviations: Hp, haptoglobin; SERS, surface-enhanced Raman spectroscopy; TMB, 3,3′,5,5′-tetramethylbenzidine. |
Measurement of Hp using SERS
SERS measurements were performed on all 111 OCFs using Raman microscope (InVia; Renishaw) with a 633 nm excitation laser, 1,800 line/mm grating, and a cooled charge-coupled device (–70°C). A 20× objective lens (NA 0.4) was used to deliver the laser beam and collect scattered light. The laser spot size was around 3 µm with a power of 0.28 mW. Multiple measurements with an integration time of 10 seconds were taken at different locations across the sample region and data were averaged. Spectra were background subtracted by a 6-order polynomial fit before the curve-fitting procedure using WiRE 3.4 Software (Renishaw plc., Wotton-under-Edge, UK). The instrument was calibrated using a silicon standard at 520 cm−1. Raman data postprocessing and analysis were performed in Matlab (Mathworks, Natick, MA, USA). All SERS measurements were normalized against 3.3 mg/mL of Hp.
Statistical analysis and graphs
Binary classification
We evaluated the diagnostic performance of the SERS assay using four classifiers, including linear discriminant analysis, logistic regression (LR), support vector machine, and K-nearest neighbor classifier (with K set at 3). A repeated cross-validation technique was used to better generalize the diagnostic performance of the assay with these four classifiers. Holdout procedure, a form of cross-validation, is implemented to randomly partition the given data set, so that 80% of the total data set is used for training the model and the remaining 20% for testing each classifier. Such cross-validation process was then repeated 1,000 times, yielding 1,000 random partitions of the original data set from which performance measures were computed and averaged. The performance measures included accuracy, sensitivity, specificity, precision, and F1-score. In addition, following the same cross-validation procedure, LR was applied to construct receiver operating characteristic (ROC) curves, in which were plotted sensitivity against false-positive rate (1−specificity). The mean and SD of area under the curve (AUC) were computed from these ROCs.
Statistical analysis
Diagnostic performances of the SERS assay, CA125 test, and FS analysis on clinical samples were evaluated using clinical research calculators in VassarStats: Statistical Computation Web Site.
Graphs
Graphs were plotted using Origin 9.1 (OriginLab, Northampton, MA,USA).
Results
Clinical characteristics of patients
We performed a retrospective analysis on archived OCF from patients who were consecutively recruited, aged 16–82 years between December 2003 and January 2016, and undergoing either laparoscopy or laparotomy for cystic epithelial ovarian tumors at the National University Hospital, Singapore. All tumors were defined by histopathologic diagnoses and staged according to the International Federation of Gynecology and Obstetrics staging for ovarian cancer.16 The histopathology diagnoses (FS, when conducted, and paraffin) for the 111 samples were known prior to analysis. Ovarian dermoid cysts, endometriotic cysts, pelvic inflammatory disease, tubo-ovarian abscesses, borderline tumors, and solid and frank malignant tumors were excluded from this study. OCF samples were collected either at laparoscopy or laparotomy without spillage into the abdominal cavity. In total, there were 111 samples including 57 benign and 54 malignant samples. There were 29 malignancies in stage 1, 3 in stage 2, 15 in stage 3, and 7 in stage 4. The clinical characteristics of patients from whom OCF was collected are summarized in Table 1.
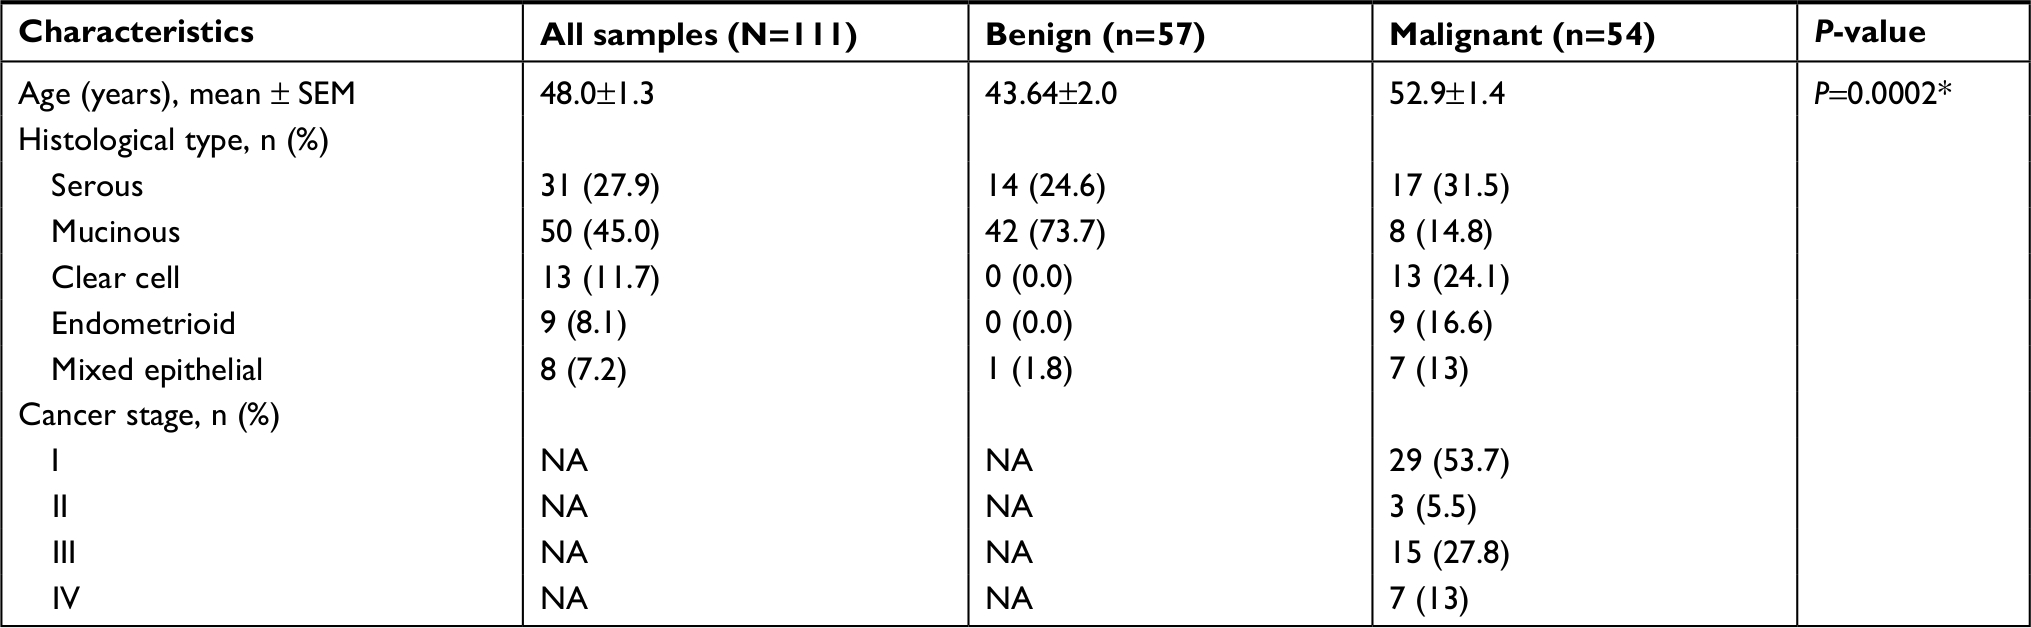 | Table 1 Summary of clinical characteristics of patients from whom ovarian cyst fluid samples were collected Note: *Mann Whitney test of significance. Abbreviation: NA, not applicable. |
SERS-based detection and quantification of Hp
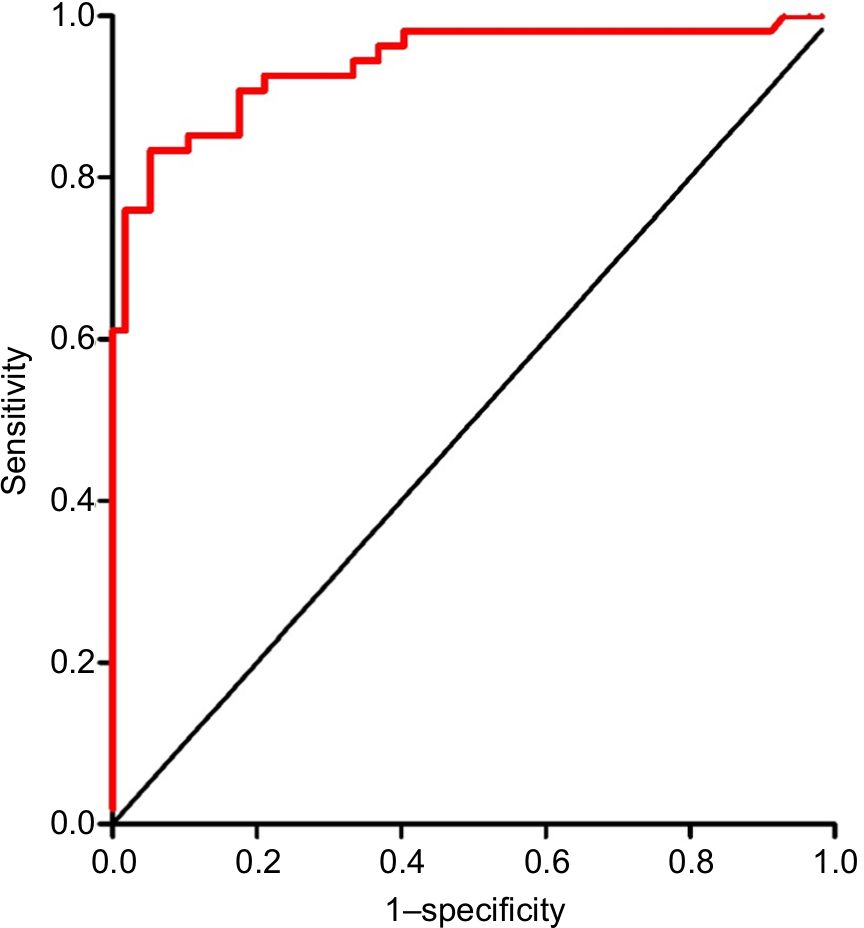
All OCF samples were blinded for malignancy and tumor stage and subjected to SERS-based Hp detection and quantification as described previously.15 Briefly, we exploited the peroxidase activity of (Hb–Hp) complex in converting the SERS-inactive TMB substrate to SERS-active TMB2+ (Figure S1). SERS spectra of TMB2+ exhibited unique peaks at 1,191, 1,337, and 1,605 cm−1 wavenumbers (Figure S2), of which 1,605 cm−1 was very prominent and changed linearly with increasing concentrations of Hp (Figure S3). Processed and normalized SERS spectral data for Hp quantification resulted in a mean of 0.65 for 57 OCFs collected from benign tumors and a mean of 1.85 for 54 OCFs collected from malignant tumors. Normalized Hp levels were significantly (P<0.01) higher in malignant OCFs than benign OCFs, suggesting the elevated levels of Hp in OCFs from patients with malignant tumors. A two-dimensional Kernel plot of the normalized data (Figure 2A, B) demonstrated the clear demarcation in Hp levels between benign and malignant OCFs. ROC curve analysis of SERS-based detection of Hp (Figure 2C) resulted in mean and SD of 0.966±0.03 for the AUC. To compare the SERS results with those of CA125 serum, we also performed the ROC curve analysis for CA125 serum from blood (Figure S4) and found the AUC to be 0.940±0.023, thus demonstrating the robustness of SERS-based Hp detection method with respect to CA125 serum, although it was not clinically significant.
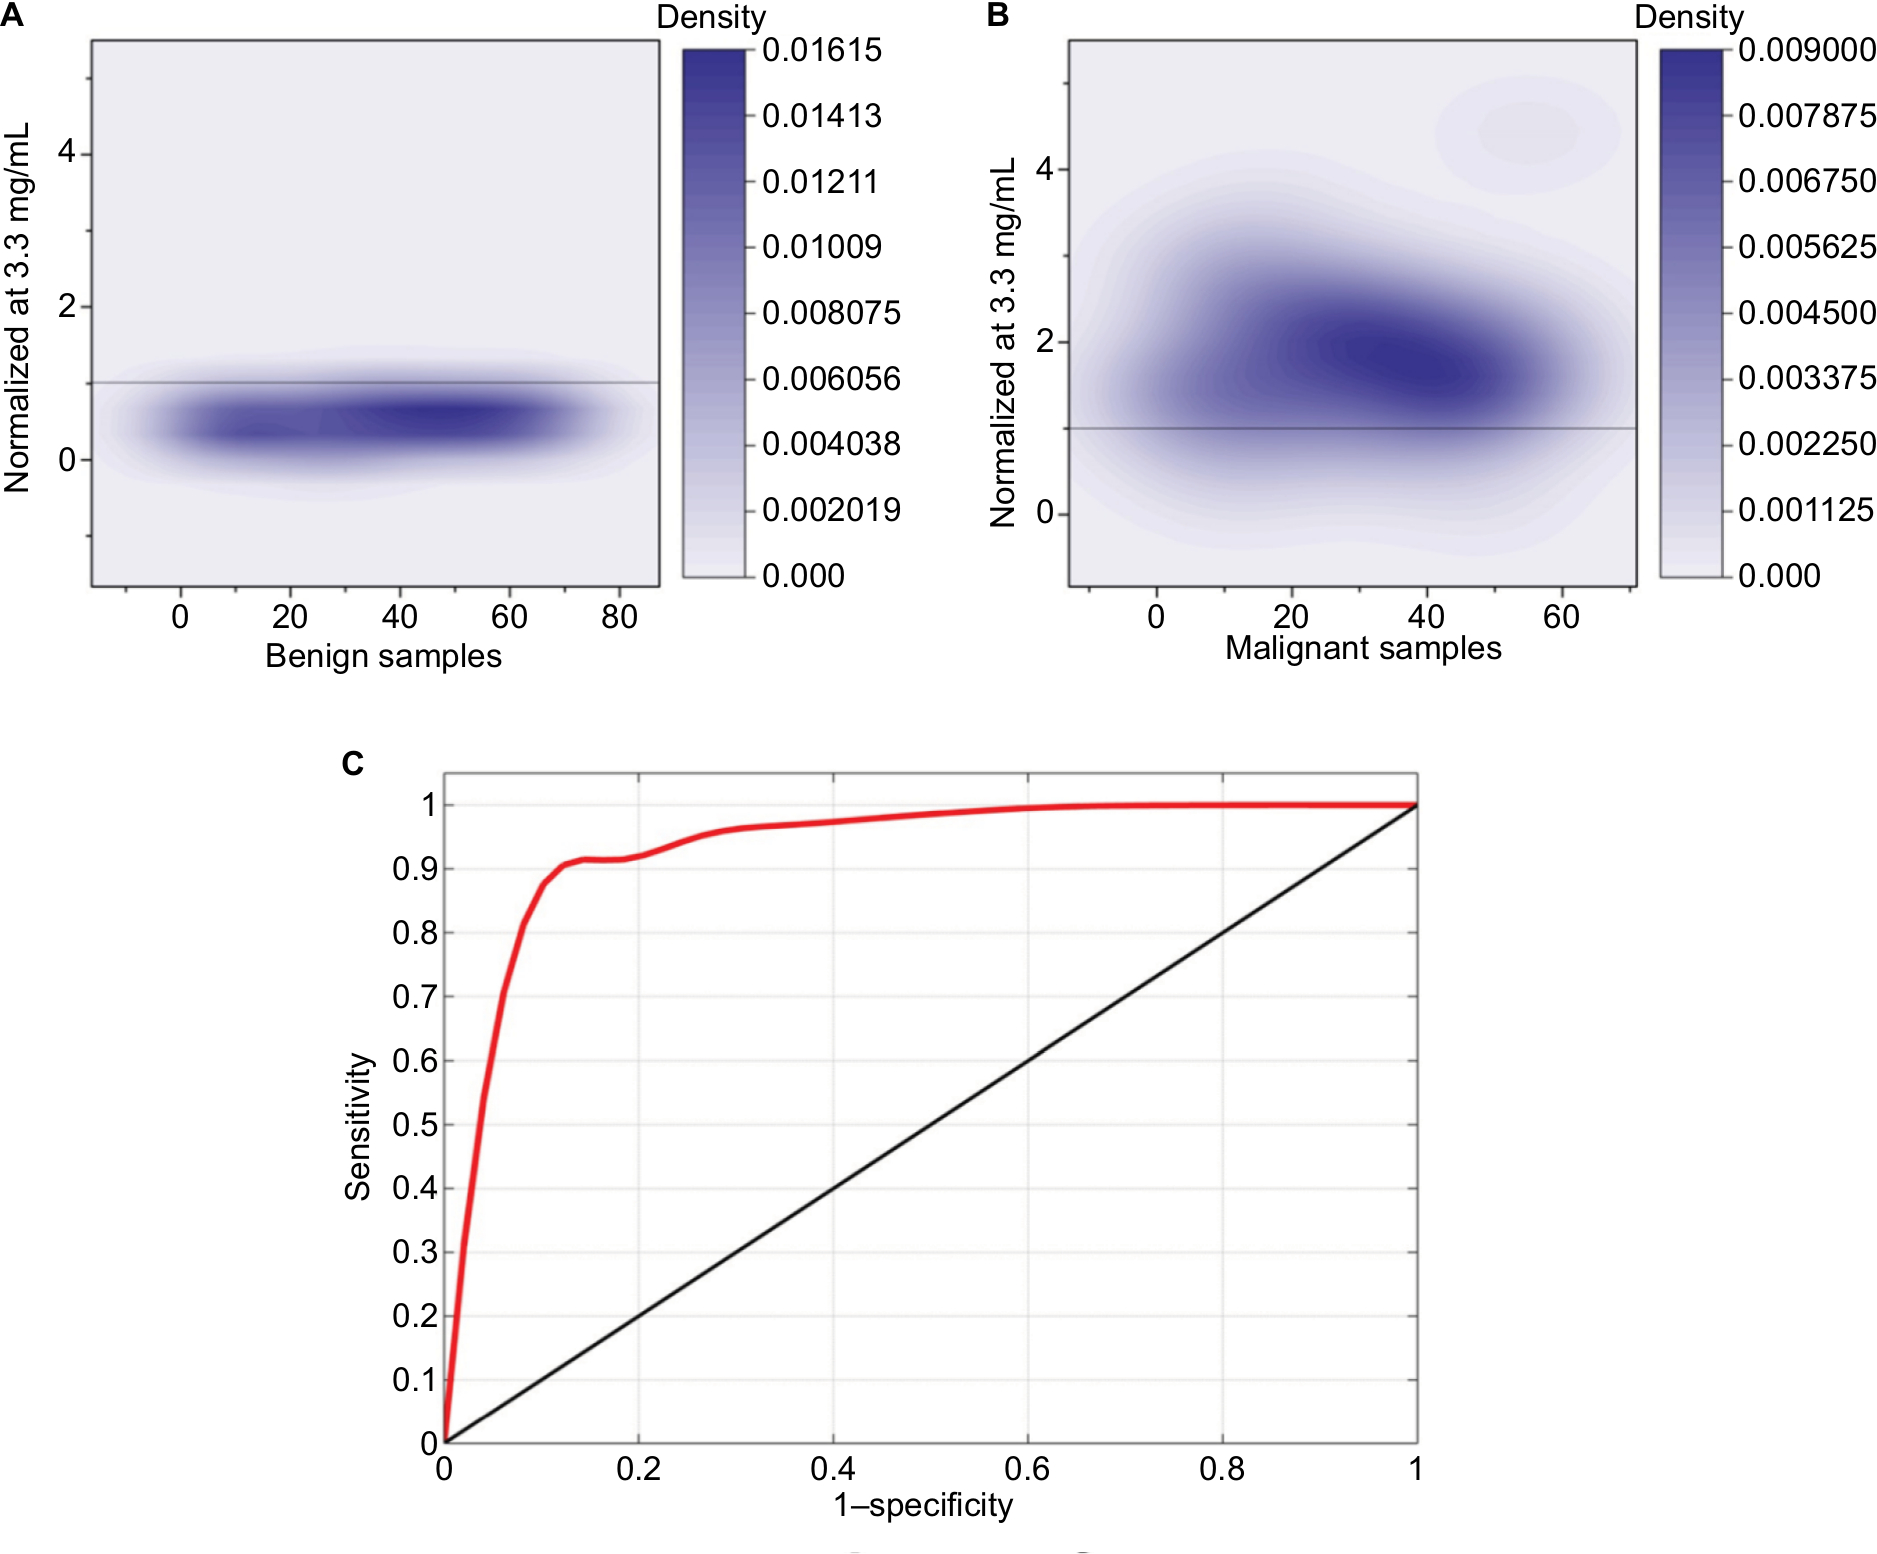 | Figure 2 Kernel density representation of the clinical sample from the benign and malignant categories. Notes: (A) Normalized Hp level in the benign ovarian cyst fluid samples is below the cutoff range. (B) Normalized Hp level in the malignant samples is above the cutoff range. Cutoff range is represented by a horizontal line across the plot. (C) Averaged ROC curve (red) for LR model estimated from testing data set by repeating the cross-validation 1,000 times. The mean and SD for the AUC are estimated to be 0.966±0.03. A diagonal line is plotted to represent an ROC curve for a nondiscriminatory test. Abbreviations: AUC, area under the curve; Hp, haptoglobin; LR, logistic regression; ROC, receiver operating characteristic. |
Diagnostic performance of SERS-based Hp detection
The diagnostic performance of SERS-based Hp detection assay on all 111 OCFs was verified against histology (Table 2) using VassarStats: Statistical Computation Web Site. The assay can differentiate between benign and malignant tumors with 94% sensitivity and 91% specificity. The assay can correctly identify 91% (positive predictive value, n=52/57) of benign samples and 94.5% of malignant samples (negative predictive value [NPV], n=51/54). The higher NPV of 94.5% for SERS-based assay implies false-negative predictions in 5.5% of the samples. SERS-based Hp detection also maintained a high sensitivity regardless of the stages of cancer, with 97% for stage 1, 100% for stage 2, 93% for stage 3, and six out of seven seven samples for stage 4 (Table 3). In particular, among women diagnosed with early-stage EOC, six had high-grade serous carcinoma subtype. In all the high-grade serous carcinoma samples, normalized Hp ratio (range 1.09–4.43) was higher than the cut-off ratio of 1 (Table 4), suggesting the usefulness of SERS assay in picking up early-stage high-grade lesions efficiently.
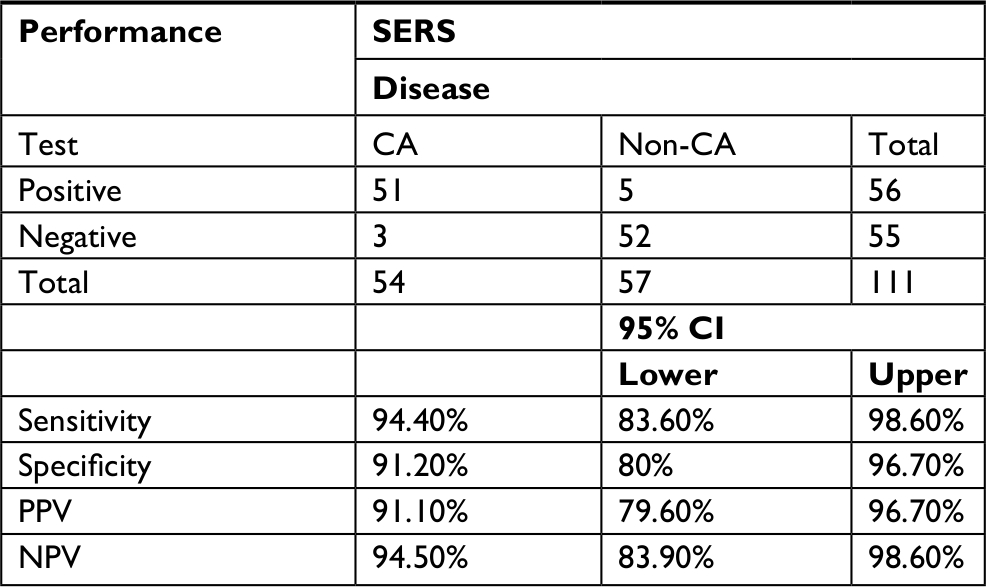 | Table 2 Diagnostic performance of SERS: sensitivity, specificity, PPV, and NPV of cyst fluid Hp determined by rapid SERS assay in the differential diagnosis of benign and malignant epithelial ovarian tumors Abbreviations: CA, cancer; NPV, negative predictive value; PPV, positive predictive value; SERS, surface-enhanced Raman spectroscopy. |
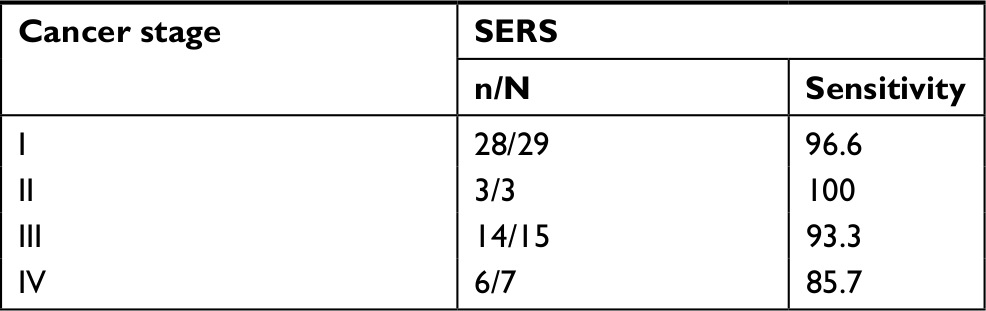 | Table 3 Sensitivity of rapid SERS assay for different stages of cancer based on histology data Notes: “n” corresponds to correct diagnosis by SERS assay. “N” corresponds to total number of samples in each stage. Abbreviation: SERS, surface-enhanced Raman spectroscopy. |
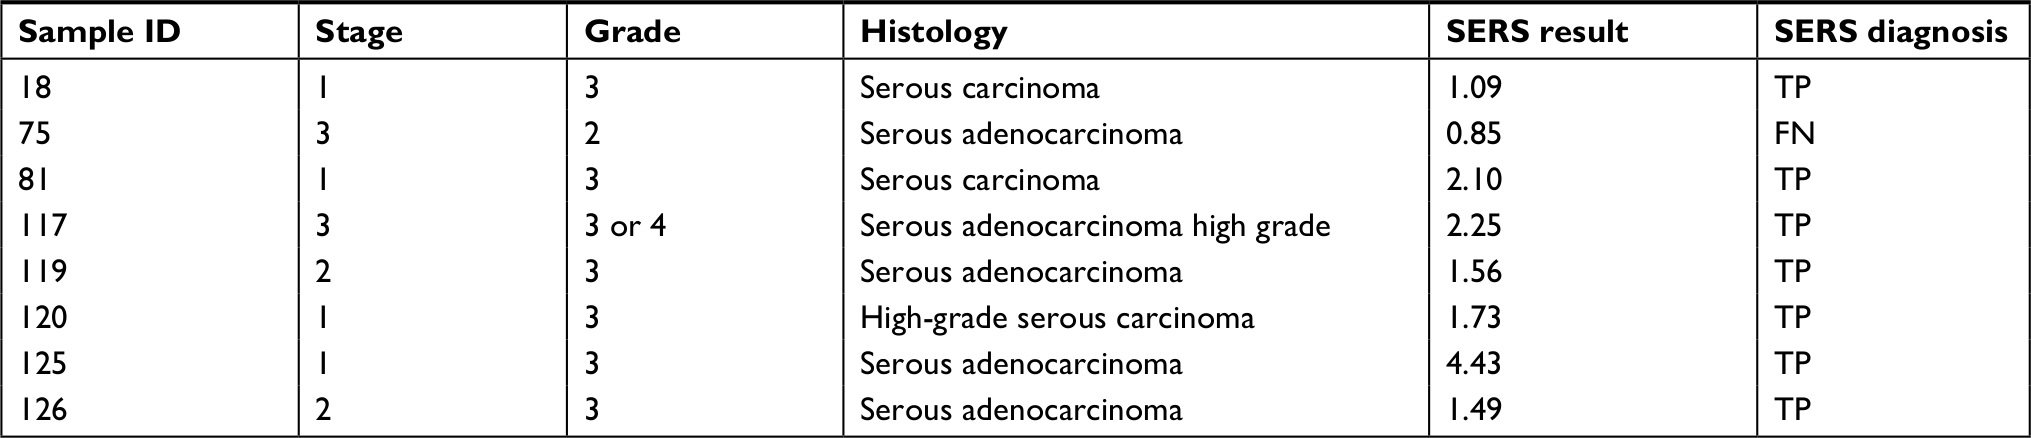 | Table 4 Comparison of histology results with those of diagnostic performance of SERS for different grades of cancer Abbreviations: FN, false negative; SERS, surface-enhanced Raman spectroscopy; TP, true positive. |
Diagnostic performance of SERS compared to CA125
As CA125 test with a cut-off of 35 U/mL17 is widely used as the benchmark in clinics to assess the risk of malignancy in ovarian cancer, we compared the performances of SERS-based Hp detection assay to CA125 test on the all 111 patients (Tables 5 and 6) using VassarStats: Statistical Computation Web Site. Prediction of malignancy based on CA125 test had a sensitivity of 85% and specificity of 90%. The assay can correctly identify 88% of benign samples (n=51/57) and 87% of malignant samples (n=46/54). Lower NPV of 87% for CA125 test implied >10% false-negative values, thus suggesting that Hp had superior diagnostic accuracy than CA125.
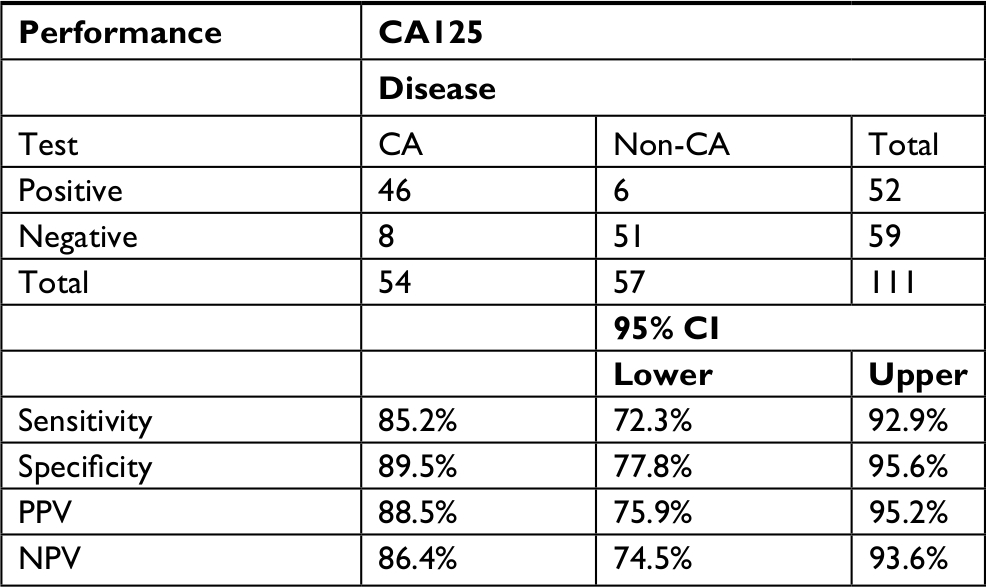 | Table 5 Diagnostic performance of CA125 vs histology: sensitivity of CA125 test for different stages of cancer based on histology data Abbreviations: CA, cancer; NPV, negative predictive value; PPV, positive predictive value; SERS, surface-enhanced Raman spectroscopy. |
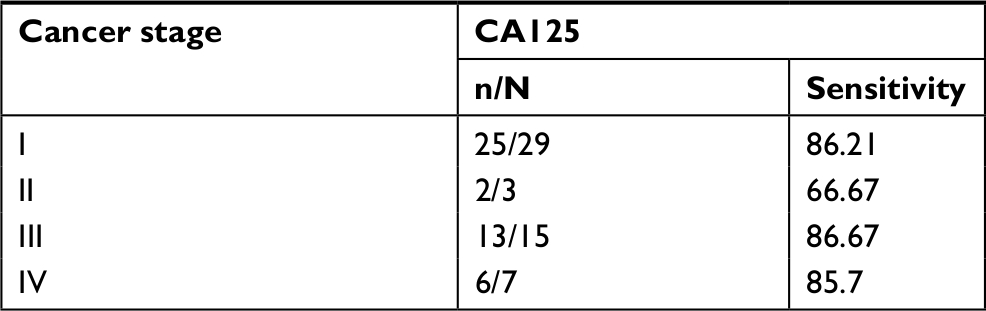 | Table 6 Comparison of histology results with those of CA125 test call for different grades of cancer Notes: “n” corresponds to correct diagnosis by CA125 test. “N” corresponds to total number of samples in each stage. Abbreviation: SERS, surface-enhanced Raman spectroscopy. |
Diagnostic performance of SERS compared to FS
FS histology was available for 65 of the 111 cases studied (58.6%; 28 benign and 37 malignant cases). For the 65 cases with FS performed, we compared the diagnostic accuracy of SERS assay and FS results against the gold standard paraffin histopathology results. The overall accuracy in determination of the status of malignancy was 90.8% for cyst fluid Hp by SERS and 100.0% for FS (Table 7). In two cases (3.1%) of OCF Hp measurements by SERS, there was underdiagnosis of malignant tumors and in four cases (6.2%), there was overdiagnosis of benign tumors.
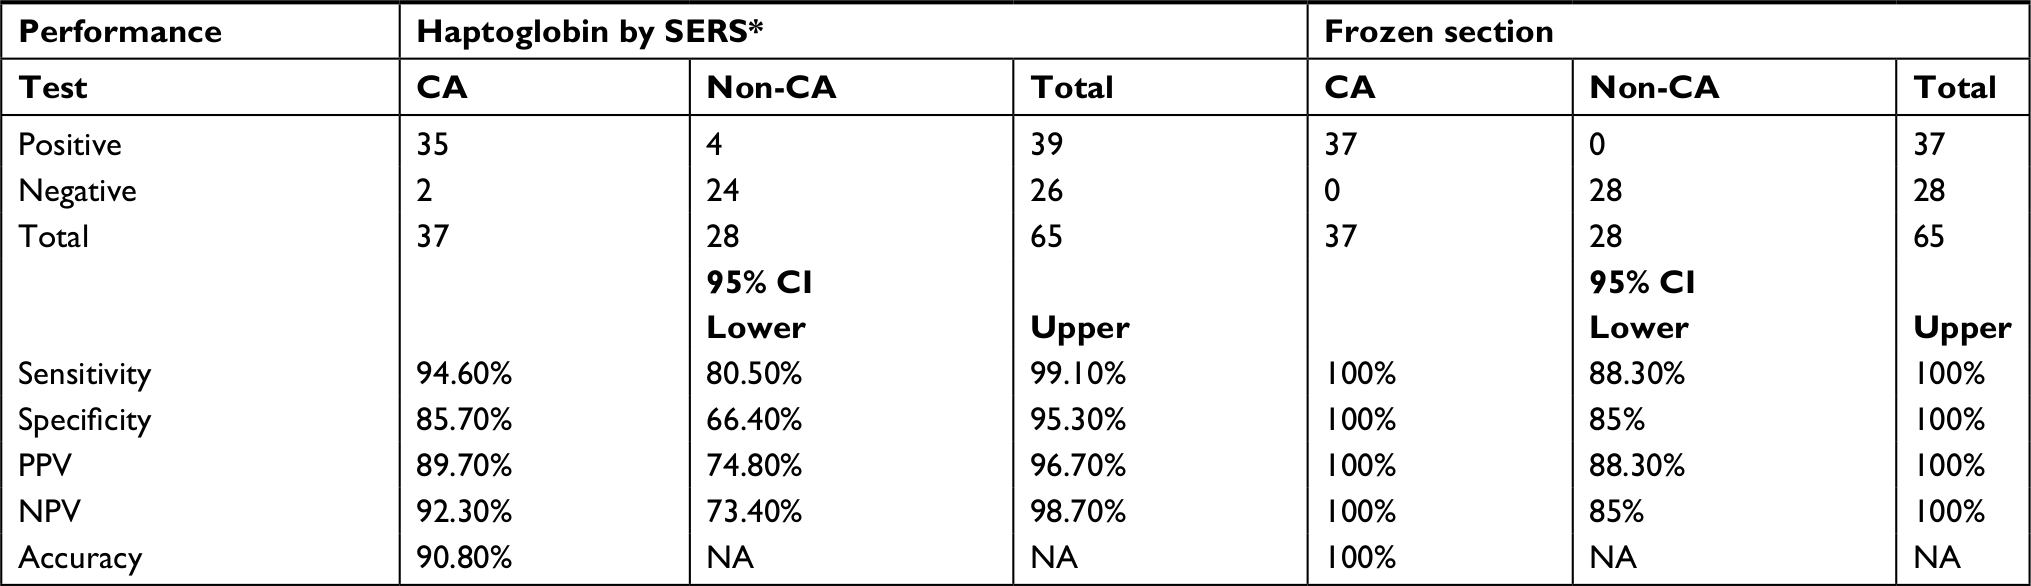 | Table 7 Diagnostic accuracy of SERS assay vs frozen section compared to histology for the diagnosis of epithelial ovarian tumors in a subset of women (n=65) Abbreviations: CA, cancer; NA, not applicable; NPV, negative predictive value; PPV, positive predictive value; SERS, surface-enhanced Raman spectroscopy. |
Discussion
SERS-based assay for detection of Hp in OCFs as a diagnostic biomarker of EOCs is suggested in this study as an intraoperative diagnostic test that can inform the clinician if the tumor is benign or malignant in under 10 minutes, and facilitates decision-making during the course of laparoscopy or laparotomy on the immediate course of action for the benefit of the patient. Every year, a large number of women undergo laparoscopic surgery for the removal of ovarian cysts which are initially thought to be benign. However, a small percentage (<2%) of unexpected malignancy has been encountered during postsurgery tumor analysis.18–20 The choice of management becomes straightforward for the surgeon in the case of postmenopausal women. However, the choice of management becomes complicated in the case of nulliparous premenopausal women who often require a fertility-sparing surgery. In order to make the most appropriate decision in case of such an unexpected malignancy suspected during the course of surgery, SERS-based Hp diagnostic test will make an immense difference.
Ovarian cancer is mostly asymptomatic at early stages and possesses vague nonspecific symptoms in later stages. Preoperatively, the diagnosis of ovarian cancer heavily relies on the Risk of Malignancy Index (RMI), which is based exclusively on CA125 test, ultrasonography, and menopausal status. This method works well for advanced ovarian cancer and postmenopausal women. However, early stage ovarian cancer detection suffers because CA125 is elevated in other benign conditions such as endometriosis and fibrosis.21,22 Also, in the Asian population, 50% of patients with ovarian cancer are premenopausal unlike the Caucasian population where 80% of ovarian cancer patients are postmenopausal, therefore affecting the RMI calculation severely.17 In this study, CA125 test demonstrated a sensitivity of 85% only and an NPV of 87%, thus leaving the false negatives for this method at 13%. This would also put the patients at a higher risk of inaccurate RMI determination.
To be intraoperatively useful in clinics, a diagnostic test must result in sensitive and, at the same time, fast detection of the biomarker. While conventional histological examination of the tumor samples can provide the actual stage of cancer and is used as a gold standard till date, the processing time of 1–2 weeks is markedly long. Intraoperative FS analysis has been proposed as an alternative as it is less time consuming and has shown specificity and sensitivity in clinical settings.9–11 However, given the logistics involved in the lengthy processing of the tissue, and the rate of misdiagnosed malignancy and understaged tumors,11,12 this method is still under evaluation. In our study, there seemed to be 100% agreement of FS results with histology. However, this is not the case all the time. While FS analyses have been associated with almost 100% sensitivity in diagnosing benign tumors, the sensitivity reduces to 88% for malignant tumors, resulting in misdiagnosis of the tumors23 and suggesting that lead time of Hp-based SERS assay is as good as FS for intraoperative diagnosis and may serve as a better alternative in clinics with no FS facility. This study, at the moment, is limited only to OCFs from benign and malignant tumors. Borderline tumors were excluded from the study in order to gain better understanding of the behavior of Hp in OCFs of benign and malignant tumors. In future, the study will be extended to borderline tumors. Based on the retrospective study results, we understand that the assay works best for benign and malignant samples in general and high-grade tumors in particular. However, the limited number of samples for stage 2 and 4 can bias the sensitivity and specificity of the assay. Additionally, we acknowledge the limitations of small sample size and higher prevalence of malignant cases in our study, which can bias the diagnostic accuracies of the SERS assay. However, moving forward, larger clinical validation studies are required to assess the potential utility of this assay in clinical settings.
Conclusion
In conclusion, we report the usefulness of SERS-based Hp diagnostic test in differentiating benign and malignant tumors based on the retrospective analysis of archived OCFs from patients who underwent laparotomy or laparoscopy. Our results suggest that SERS-based assay has a high sensitivity and specificity for picking up malignancy in under 10 minutes and, more importantly, showed consistency across all stages of cancer. The SERS assay technology that is currently being developed and tested along with a portable read-out system holds immense promise for the future as a point-of-care kit to distinguish between benign and malignant ovarian cysts in the operation theaters during an ovarian cystectomy.
Ethics approval and consent to participate
This study was conducted in accordance with the Declaration of Helsinki. All specimens were collected after obtaining informed consent from each subject and used in accordance with the local ethics committee, National Healthcare Group (NHG) Domain Specific Review Board (DSRB), Singapore; approved protocol numbered DSRB reference: D2007/240.
Acknowledgments
This work was funded by the Bench to Bedside grant awarded by the National Medical Research Council (NMRC), Singapore (Grant Reference Number NMRC/BnB/0002 c/2012), intramural funding from Bio-Medical Research Council of Agency for Science, Technology and Research (A*STAR), and the NHIC Innovation to Develop (I2D) grant with application number NHIC-I2D-1704160.
Author contributions
JP, GB, APM, MC, and MO initiated the study. JP, GB, USD, and MO planned the experiment. JP and DG did data acquisition and analyzed results. CYF and AK performed the statistical analysis. MC and APM provided clinical samples and clinical input, and were involved in discussion. All authors contributed toward data analysis, drafting and critically revising the paper, gave final approval of the version to be published, and agreed to be accountable for all aspects of the work.
Disclosure
The authors report no conflicts of interest in this work.
References
Ferlay J, Soerjomataram I, Dikshit R, et al. Cancer incidence and mortality worldwide: sources, methods and major patterns in GLOBOCAN 2012. Int J Cancer. 2015;136(5):E359–E386. | ||
Bast RC, Hennessy B, Mills GB. The biology of ovarian cancer: new opportunities for translation. Nat Rev Cancer. 2009;9(6):415–428. | ||
Matte I, Legault CM, Garde-Granger P, et al. Mesothelial cells interact with tumor cells for the formation of ovarian cancer multicellular spheroids in peritoneal effusions. Clin Exp Metastasis. 2016;33(8):839–852. | ||
Jacobs IJ, Menon U, Ryan A, et al. Ovarian cancer screening and mortality in the UK Collaborative Trial of Ovarian Cancer Screening (UKCTOCS): a randomised controlled trial. Lancet. 2016;387(10022):945–956. | ||
Howlader N, Noone AM, Krapcho M, editors. SEER Cancer Statistics Review, 1975–2011. Bethesda, MD: National Cancer Institute; based on November 2013 SEER data submission. | ||
Goff BA, Mandel L, Muntz HG, Melancon CH. Ovarian carcinoma diagnosis. Cancer. 2000;89(10):2068–2075. | ||
Lurie G, Thompson PJ, Mcduffie KE, Carney ME, Goodman MT. Prediagnostic symptoms of ovarian carcinoma: a case–control study. Gynecol Oncol. 2009;114(2):231–236. | ||
Goff B. Symptoms associated with ovarian cancer. Clin Obstet Gynecol. 2012;55(1):36–42. | ||
Cross PA, Naik R, Patel A, et al. Intra-operative frozen section analysis for suspected early-stage ovarian cancer: 11 years of Gateshead Cancer Centre experience. BJOG. 2012;119(2):194–201. | ||
Baker P, Oliva E. A practical approach to intraoperative consultation in gynecological pathology. Int J Gynecol Pathol. 2008;27(3):353–365. | ||
Ratnavelu ND, Brown AP, Mallett S, et al. Intraoperative frozen section analysis for the diagnosis of early stage ovarian cancer in suspicious pelvic masses. In: Ratnavelu ND, editor. Cochrane Database of Systematic Reviews. Chichester, UK: John Wiley & Sons, Ltd; 2016. | ||
Geomini PM, Zuurendonk LD, Bremer GL, de Graaff J, Kruitwagen RF, Mol BW. The impact of size of the adnexal mass on the accuracy of frozen section diagnosis. Gynecol Oncol. 2005;99(2):362–366. | ||
Zhao C, Annamalai L, Guo C, et al. Circulating haptoglobin is an independent prognostic factor in the sera of patients with epithelial ovarian cancer. Neoplasia. 2007;9(1):1–7. | ||
Mahyuddin A, Liu L, Zhao C, et al. Diagnostic accuracy of haptoglobin within ovarian cyst fluid as a potential point-of-care test for epithelial ovarian cancer: an observational study. BJOG. 2018;125(4):421–431. | ||
Perumal J, Balasundaram G, Mahyuddin AP, Choolani M, Olivo M. SERS-based quantitative detection of ovarian cancer prognostic factor haptoglobin. Int J Nanomedicine. 2015;10:1831–1840. | ||
Prat J; FIGO Committee on Gynecologic Oncology. Staging classification for cancer of the ovary, fallopian tube, and peritoneum. Int J Gynaecol Obstet. 2014;124(1):1–5. | ||
Eleftherios P, Diamandis, Fritche HA, Lilja H, Chan DW, Schwartz MK. Tumor markers: physiology, pathobiology, technology and clinical applications. In: Tumor Markers: Physiology, Pathobiology, Technology and Clinical Applications. Washington DC: AACC Press; 2002:239–252. | ||
Saito S, Kajiyama H, Miwa Y, et al. Unexpected ovarian malignancy found after laparoscopic surgery in patients with adnexal masses: a single institutional experience. Nagoya J Med Sci. 2014;76(1–2):83–90. | ||
Matsushita H, Watanabe K, Yokoi T, Wakatsuki A. Unexpected ovarian malignancy following laparoscopic excision of adnexal masses. Hum Reprod. 2014;29(9):1912–1917. | ||
Wahab NA, Chalermchockchareonkit A, Chaisilwattana P, Mustafa KB. Unexpected ovarian malignancy after conservative laparoscopic surgery: five case series in a half decade of experience. Arch Gynecol Obstet. 2012;285(6):1695–1698. | ||
Clarke-Pearson DL. Screening for ovarian cancer. N Engl J Med Overseas Ed. 2009;361(2):170–177. | ||
Cannistra SA. Cancer of the ovary. N Engl J Med. 2004;351(24):2519–2529. | ||
Brun JL, Cortez A, Rouzier R, et al. Factors influencing the use and accuracy of frozen section diagnosis of epithelial ovarian tumors. Am J Obstet Gynecol. 2008;199(3):244:244.e1–244.e7. |
Supplementary materials
Rapid surface-enhanced Raman spectroscopy (SERS) assay was done using 3,3′,5,5′-tetramethylbenzidine (TMB) peroxidase reactant, which is Raman inactive, once the completion of the peroxidase reaction in presence of (hemoglobin [Hb]–haptoglobin [Hp]) complex TMB2+ is formed, which is a Raman active product, as shown in Figure S1. Figure S2 shows the SERS spectra of TMB2+ with the specific peaks at 1,191, 1,337, and 1,605 cm−1, which corresponds to characteristic SERS bands of TMB2+.1 With increasing concentration of (Hb–Hp) complex, the SERS signal intensity from TMB2+ also increased and there was a linear correlation between the SERS signal intensity and Hp concentration from 50 nm to 34 µM, as shown in Figure S3.
Receiver operating characteristic (ROC) curve for CA125 present in blood serum
For the cross-validation procedure for the reliability of CA125 serum to predict malignant ovarian cysts, logistic regression was applied to construct ROC curves, which plot sensitivity against false-positive rate (1−specificity). The mean and SD of area under the curve (AUC) were computed from these ROCs.
As shown in Figure S4, averaged ROC curve (red) showing the relationship between sensitivity and specificity for CA125 serum in the prediction of epithelial ovarian cancer, with the mean and SD for the AUC are estimated to be (AUC 0.940, 95% CI 0.895–0.985; P>0.05) in N=111 cases (57 benign cases and 54 malignant cases). A diagonal line is plotted to represent an ROC curve for a nondiscriminatory test.
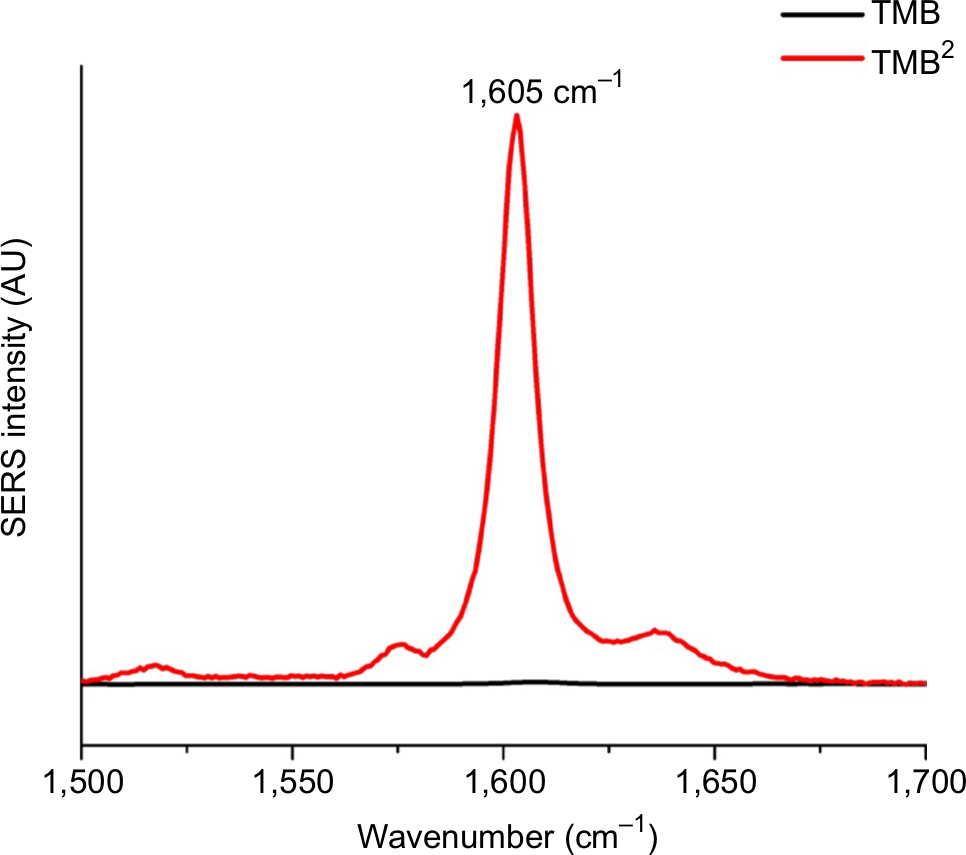 | Figure S1 Comparison of the SERS spectra for both reactant TMB and product TMB2+. Abbreviations: SERS, surface-enhanced Raman spectroscopy; TMB, 3,3′,5,5′- tetramethylbenzidine. |
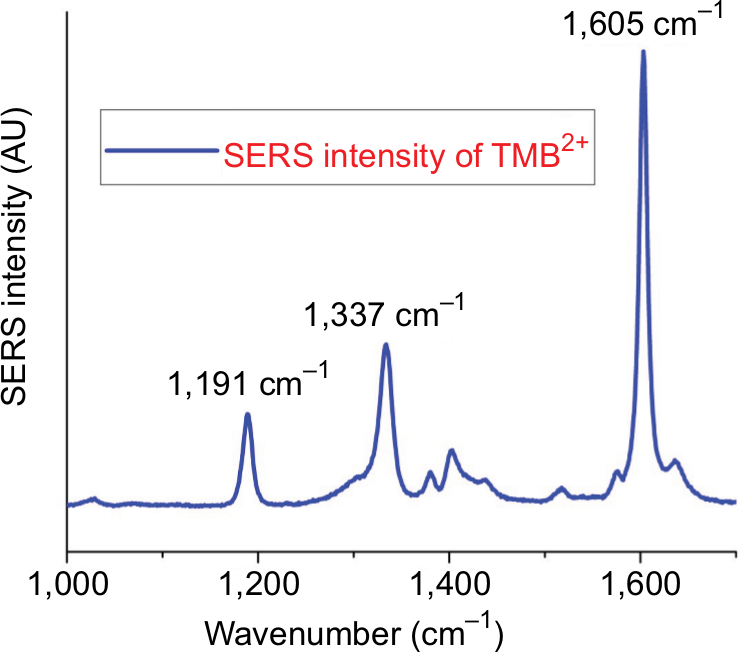 | Figure S2 SERS spectra with characteristic Raman bands of TMB2+. Abbreviations: SERS, surface-enhanced Raman spectroscopy; TMB, 3,3′,5,5′- tetramethylbenzidine. |
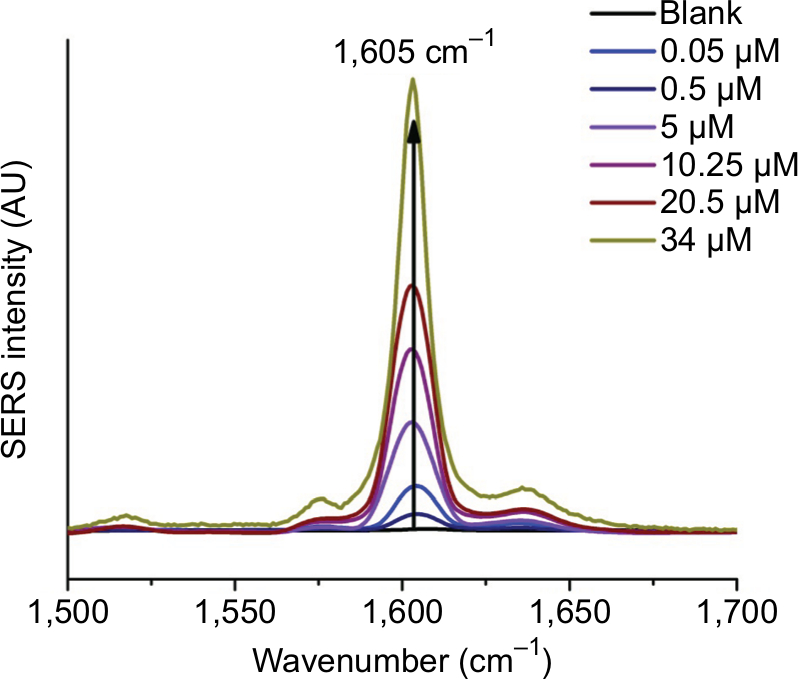 | Figure S3 Hp concentration-dependent change in SERS intensity of TMB2+ at 1,605 cm−1 wavenumber. Abbreviations: Hp, haptoglobin; SERS, surface-enhanced Raman spectroscopy; TMB, 3,3′,5,5′-tetramethylbenzidine. |
 | Figure S4 Averaged ROC curve showing the relationship between sensitivity and specificity for CA125 serum in the prediction of epithelial ovarian cancer, with the mean and SD for the AUC estimated to be 0.940±0.023. A diagonal line is plotted to represent an ROC curve for a nondiscriminatory test. Abbreviations: AUC, area under the curve; ROC, receiver operating characteristic. |
Reference
Perumal J, Balasundaram G, Mahyuddin AP, Choolani M, Olivo M. SERS-based quantitative detection of ovarian cancer prognostic factor haptoglobin. Int J Nanomedicine. 2015;10:1831–1840. |
 © 2019 The Author(s). This work is published and licensed by Dove Medical Press Limited. The
full terms of this license are available at https://www.dovepress.com/terms
and incorporate the Creative Commons Attribution
- Non Commercial (unported, 3.0) License.
By accessing the work you hereby accept the Terms. Non-commercial uses of the work are permitted
without any further permission from Dove Medical Press Limited, provided the work is properly
attributed. For permission for commercial use of this work, please see paragraphs 4.2 and 5 of our Terms.
© 2019 The Author(s). This work is published and licensed by Dove Medical Press Limited. The
full terms of this license are available at https://www.dovepress.com/terms
and incorporate the Creative Commons Attribution
- Non Commercial (unported, 3.0) License.
By accessing the work you hereby accept the Terms. Non-commercial uses of the work are permitted
without any further permission from Dove Medical Press Limited, provided the work is properly
attributed. For permission for commercial use of this work, please see paragraphs 4.2 and 5 of our Terms.