Back to Journals » Diabetes, Metabolic Syndrome and Obesity » Volume 13
Sera Anti-P53 Antibody Provides New Information Which Explains the Link Between Diabetes and Cancer
Authors Sauriasari R ![]() , Sekar AP
, Sekar AP ![]() , Aisyah N, Syahdi RR, Matsuura E
, Aisyah N, Syahdi RR, Matsuura E ![]()
Received 28 April 2019
Accepted for publication 3 January 2020
Published 11 February 2020 Volume 2020:13 Pages 325—331
DOI https://doi.org/10.2147/DMSO.S213731
Checked for plagiarism Yes
Review by Single anonymous peer review
Peer reviewer comments 2
Editor who approved publication: Dr Konstantinos Tziomalos
Rani Sauriasari,1,* Andisyah Putri Sekar,1,* Nurul Aisyah,1 Rezi Riadhi Syahdi,1 Eiji Matsuura2
1Faculty of Pharmacy, Universitas Indonesia, Depok, Indonesia; 2Neutron Therapy Research Center, Collaborative Research Center for OMIC & Department of Cell Chemistry, Okayama University Graduate School of Medicine, Dentistry, and Pharmaceutical Sciences, Okayama University, Okayama, Japan
*These authors contributed equally to this work
Correspondence: Rani Sauriasari Gedung A Rumpun Ilmu Kesehatan, Jalan Prof. Dr. Sudjono D Pusponegoro, Kampus UI, Depok, Jawa Barat 16424, Indonesia
Tel +62-21-7270031
Email [email protected]
Introduction: Abnormalities in glucose metabolism in diabetic patients may lead to an increased risk of certain cancers. Epidemiological studies and meta-analysis have shown that factors such as gender, age, obesity, and insulin resistance are related to cancer incidence. The anti-p53 antibody is a known cancer marker due to tumor-associated p53 accumulation. Many studies have aimed to unravel the link between diabetes and cancer. Here, we aimed to elucidate the impact of diabetes on malignancies by analyzing anti-p53 antibody in sera of type 2 diabetes mellitus (T2DM) patients.
Materials and Methods: We conducted an observational study with a cross-sectional design. A total of 149 subjects comprised of 78 T2DM patients (32 with cancer risk and 46 subjects without cancer risk), 51 T2DM patients with cancer, and 20 healthy subjects as controls from multisites. The anti-p53 antibody was measured by enzyme-linked immunosorbent assay, while HbA1c was measured using the NGSP standardized method.
Results: We observed an 8.3-fold (p< 0.05) increase of anti-p53 antibody in the sera of T2DM patients and a 24-fold increase (p< 0.001) in T2DM patients with cancer compared to healthy subjects. The anti-p53 antibodies significantly increased almost three times (p< 0.05) in T2DM patients with cancer (0.72 U/mL± 0.20) compared to T2DM patients (0.25 U/mL± 0.05). Meanwhile, this antibody was almost undetectable in healthy subjects as a control group (0.03 U/mL± 0.03). The anti-p53 antibody level was higher in T2DM with cancer risk patients. However, we did not find a significant difference for it in T2DM without cancer risk patients (0.19 U/mL± 0.03) and T2DM with cancer risk patients (0.29 U/mL± 0.08). Multivariate regression analysis showed that T2DM with cancer was the only one independent factor (beta=0.218, p=0.019) that could predict the increase of anti-p53 antibody, controlled by age, gender, BMI, DM duration, and HbA1c.
Conclusion: Our results showed that anti-p53 antibody almost not detected in healthy subjects, but 8.3-fold increase in the sera of T2DM patients and 24-fold increase in T2DM patients with cancer. Therefore, this biomarker provides new information which explains the link between diabetes and cancer.
Keywords: anti-p53 antibodies, P53, cancer, diabetes mellitus
Introduction
Diabetes is a metabolic disorder of multiple etiologies that is characterized by chronic hyperglycemia.1 Hyperglycemia is associated with overall cancer risk in women and an increased risk of cancer at many sites in both genders.2 Over the long term, poorly regulated metabolism in diabetes patients increases oxidative stress and upregulates the production of proinflammatory cytokines that may increase reactive oxygen species, which cause inflammation by reducing intracellular antioxidant activity.3 Cumulative data showed that chronic inflammation and systemic insulin resistance induced by hyperglycemia and excessive calorie intake are linked to the tumor suppressor activity.4 This calorie intake-tumor suppressor activity link could be also observed from another experiment that has found that cellular memory generated by prolonged exposure to oscillating glucose in endothelial cells can cause a detrimental condition, leading to the activation of p53 and its downstream pathways,5
Activation of p53 plays roles in regulating apoptosis, senescence, and DNA repair as well as in the regulation of glucose metabolism. Activation of p53 triggers induction of p53 upregulated mediator of apoptosis (PUMA), phosphatase and tensin homolog (PTEN),6 and its feedback inhibitor murine double minute oncoprotein (MDM2).7 In normal healthy cells, p53 is maintained at low levels by the E3 ubiquitin ligase MDM2, which ubiquitylates p53 and targets p53 for proteasomal degradation. In response to various stressors, phosphorylation of the amino terminus of p53 prevents interaction with MDM2, leading to p53 stabilization.8
Regarding the role of p53 in apoptosis and senescence, previous studies have suggested that p53 is mobilized to the mitochondrial membrane during oxidative stress induced by hyperglycemia, which leads to pancreatic β-cell apoptosis.9 The tumor suppressor p53 balances the glycolysis pathway and oxidative phosphorylation in producing ATP to help regulate metabolism. As a consequence, the tendency of cancer cells utilizing the glycolytic pathway to produce ATP is inhibited.8 It has recently been shown that p53 regulates glucose metabolism via p53-induced glycolysis and apoptosis regulator via TP53-inducible glycolysis and apoptosis regulator (TIGAR) and regulates insulin sensitivity via phosphatase and tensin homolog (PTEN). However, impaired glucose metabolism in diabetic patients leads to mitochondrial dysfunction and could notably inhibit p53. As a result, more elevated glucose circulating in the blood could activate several growth factors signaling. It is similar to the mechanism observed in mutant p53, of which positively regulates glucose uptake in cancer to use the glycolytic pathway as energy production more since there is a defect on oxidative phosphorylation.10
Interestingly, both in vitro and in vivo studies have shown that mutant p53 is correlated with increased AKT activity in some cancers.11,12 The accumulated mutant p53 protein is seen as an antigen that stimulates the formation of anti-p53 antibodies occurring in the sera of cancer patients.13 The anti-p53 antibody has been used as a molecular marker to study target tissues or fluids, such as blood serum, in populations with high cancer risk, such as heavy smokers.14 Therefore, anti-p53 antibody could be a potential biomarker in cancer detection and correlates with several cancers.15
We are interested to know the effect of glucose blood concentration measured as HbA1c and the role of p53 towards cancer metabolism, especially in type 2 diabetes mellitus (T2DM). Thus, the present study was undertaken to investigate anti-p53 antibody serum levels in T2DM patients further.
Materials and Methods
Study Design
This was a cross-sectional study and already approved by The Ethics Committee, Faculty of Medicine, Universitas Indonesia–Dr. Cipto Mangunkusumo Hospital (No. 346/UN2.F1/ETIK/2017) and The Ethics Committee, Dharmais Cancer Hospital (No. 048/KEPK/VIII/2017). This study was conducted in accordance with the Declaration of Helsinki. We collected samples from April 2017 to January 2019 and all the patients was provided informed consent prior to sample withdrawal.
Subjects
Participants comprised 78 T2DM patients (with and without cancer risks) attending the Diabetes Polyclinic in two primary health center (Pasar Minggu and Cimanggis Primary Health Center) and two general hospitals (Depok and Tangerang General Hospital). The inclusion criteria for T2DM patients group were diabetes mellitus patients age ≥ 35 years,16 HbA1c ≥ 6.5%,17 and regular treatment with antidiabetic drugs for at least for 6 months. The 51 T2DM patients with cancer were patients from Dharmais Cancer Hospital. The exclusion criteria for T2DM patients with cancer group were severe anemia or a cancer diagnosis before T2DM diagnosis and in a chemotherapy session. For the control, we involved 20 healthy subjects. The inclusion criteria for healthy subjects group were normal HbA1c, normal blood pressure, BMI ≤30 kg/m2, and not taking any medication for diabetes mellitus or hypertension. Patients’ medical records were screened to assess the eligibility, and an interview was conducted to assure that participants met all of the criteria.
T2DM with cancer risk definition is T2DM patients with one or more cancer risk(s). Each patient’s cancer risk was determined by smoking habit, obesity, and family’s cancer history. Based on this information, the participants were divided into three groups: T2DM patients, T2DM patients with cancer, and healthy subjects as control.
Sample Collection and Analysis
Blood samples were collected from all the participants, who were asked to refrain from consuming anything other than water for at least 8 hrs (fasting conditions). Blood was collected by a certified phlebotomist and transferred to a vacutainer serum tube. Samples were incubated at room temperature for 15–30 mins and then centrifuged at 1000–2000 rpm for 10 min in a refrigerated centrifuge to obtain serum. Serum was stored at −20 ºC until analysis. Serum anti-p53 antibody was analyzed using the enzyme-linked immunosorbent assay method (MESACUP Anti-p53 Test, Medical & Biological Laboratories Co. Ltd. (MBL), Nagoya, Japan). Whole blood samples for HbA1c analysis were taken from a peripheral vein and directly transferred to Afinion™ HbA1c Test Cartridge (Allere, USA) using a capillary pipe and then analyzed using Afinion™ AS100 Analyzer (Allere, USA).
Statistical Analysis
Descriptive statistics are presented on mean. For categorical variables, groups were compared using the chi-square test. The Kruskal–Wallis and Mann–Whitney U-tests were used to analyze non-parametric data, while ANOVA was used to analyze parametric data. Correlations between two variables were analyzed using the bivariate Pearson or Spearman test, depends on the normality of the data. Variables with p<0.25 in correlation analysis with anti-p53 antibody (age, gender, BMI, DM duration, and HbA1c) were included in multivariate linear regression analysis. A p-value of less than 0.05 was considered statistically significant. SPSS version 20 was used to perform the analysis (IBM Statistic).
Results
Subject Characteristics
The basic characteristics of the study subjects were presented in Table 1. There were differences in several characteristics (age, body weight, body height) between T2DM patients and T2DM patients with cancer groups. Most of diabetic patients were overweight (BMI 25 to 29.9 kg/m2), indicating that the elevated circulating of free fatty acids (FFAs) might decrease insulin-stimulated glucose uptake.18 The HbA1c level as seen in Table 2 were above the limit recommended for diabetes mellitus patients (HbA1c<7%), which indicates the level of blood glucose was higher.17 Uncontrolled blood glucose promotes mitochondrial dysfunction that contributes to insulin resistance.19 Both impaired mitochondria and defect of insulin sensitivity could activate various signaling pathways, particularly in insulin signaling, and therefore induce cancer progression.20
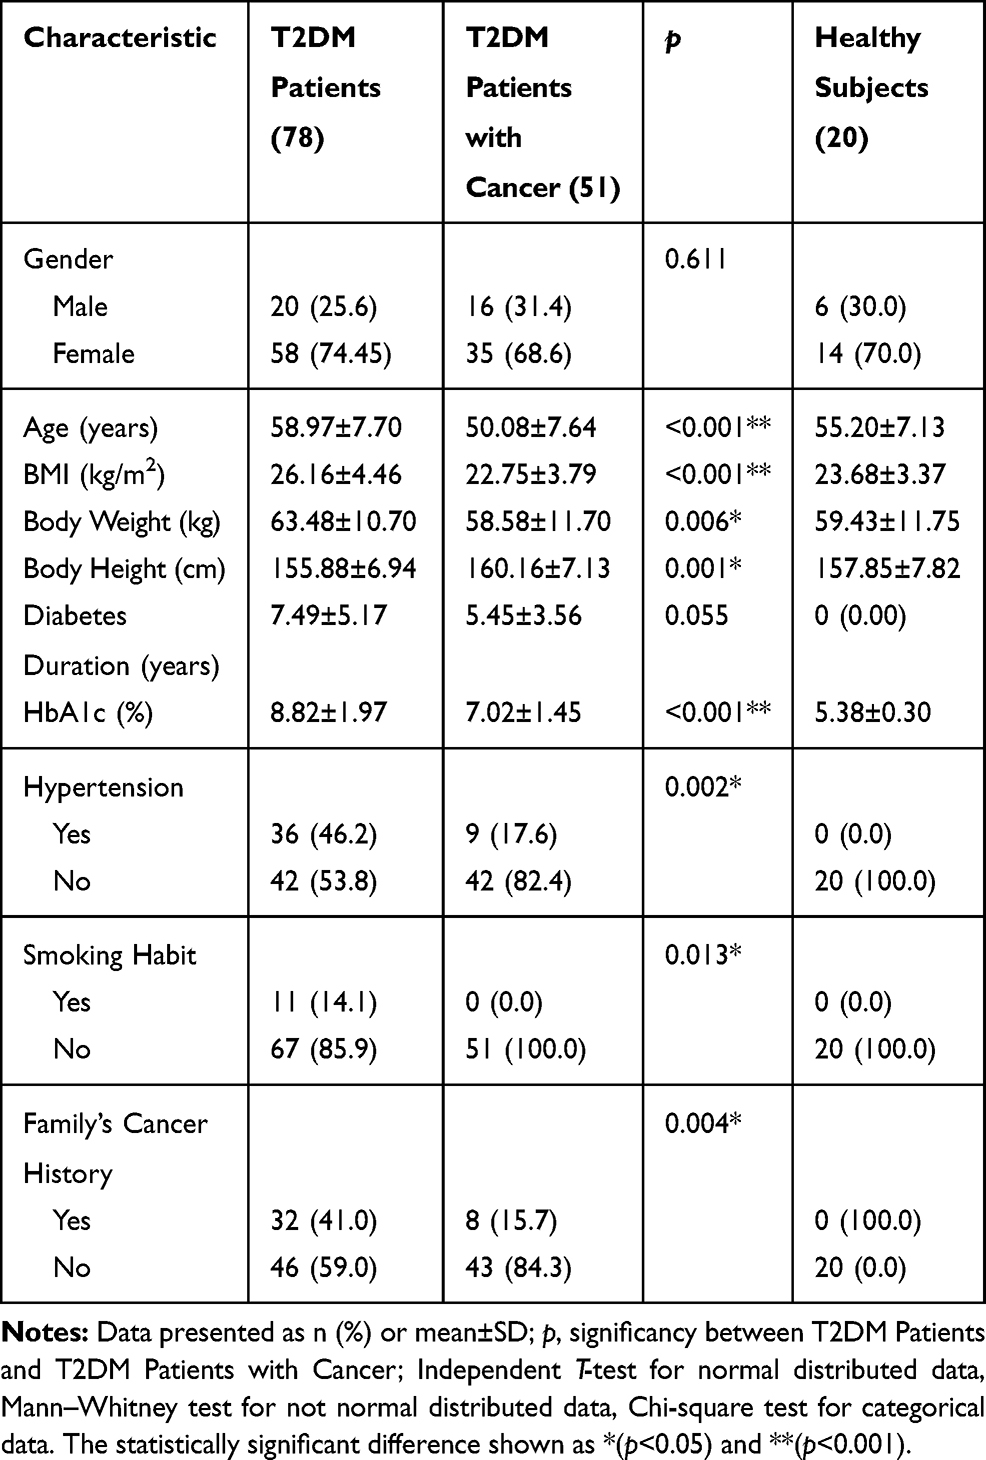 |
Table 1 Basic Characteristics of Study Subjects |
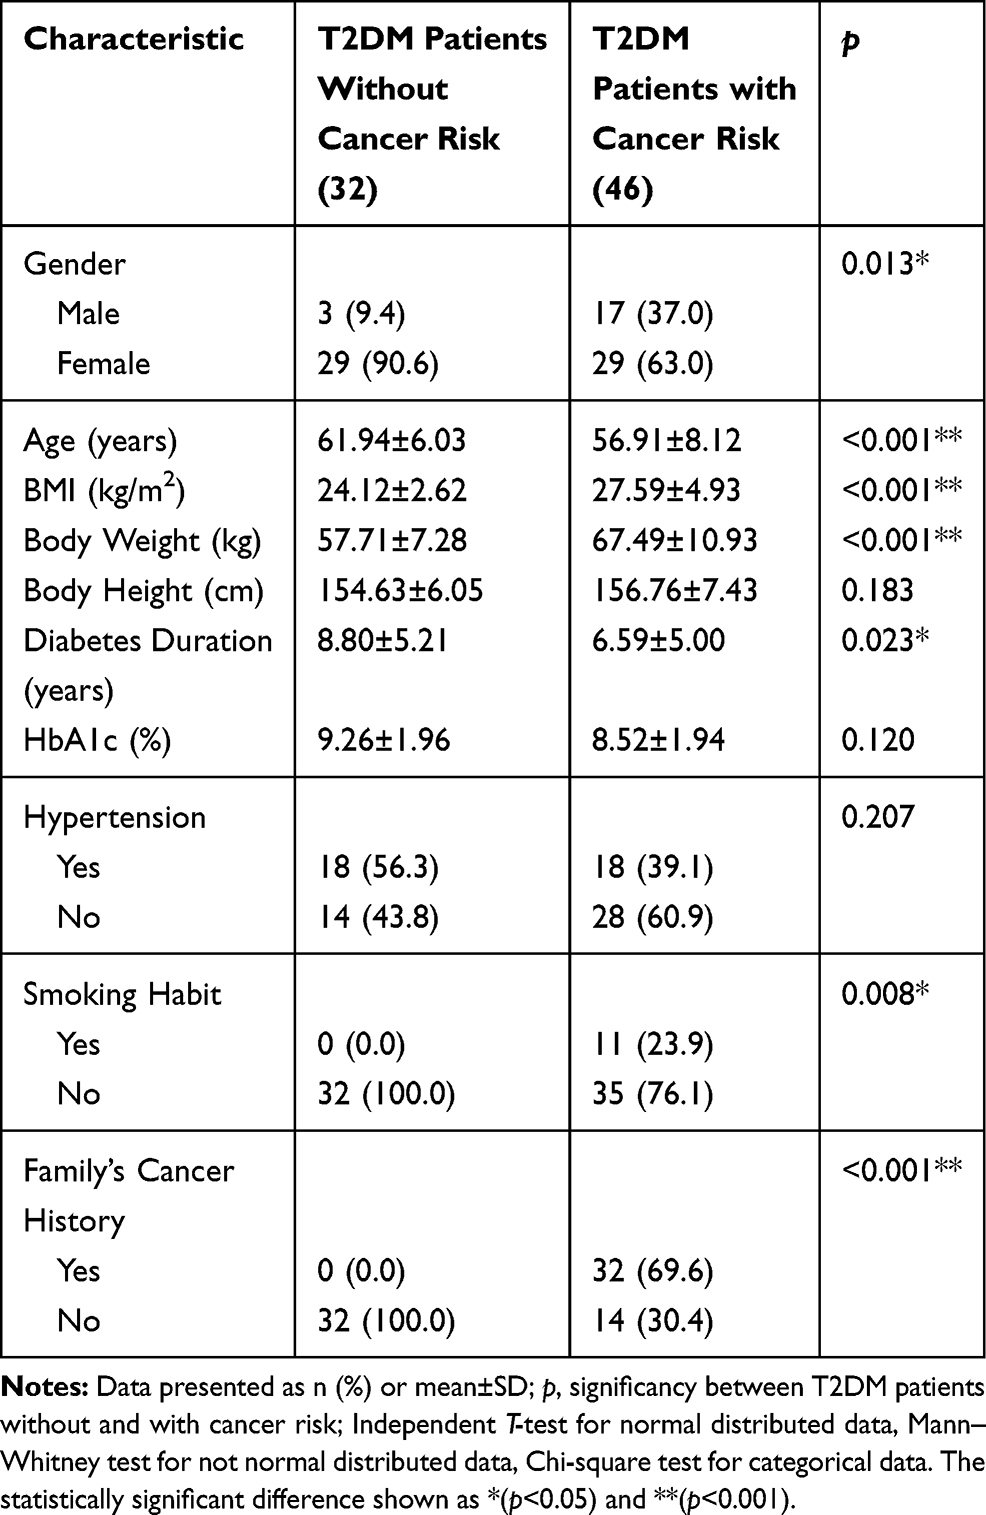 |
Table 2 Sub Analysis for T2DM Patients Group According to Cancer Risk: Basic Characteristics |
The number of participants in the T2DM patients without cancer risk was 32 and T2DM patients with cancer risk was 46. There were significant differences in term of gender, age, and duration of diabetes, instead of the risk cancer parameters (BMI, smoking habit, and family’s cancer history).
There were no difference in gender proportion between T2DM patients group (20 male and 58 female) and T2DM patients with cancer group (16 male and 35 female). However, there was significant difference between number of men and women in T2DM patients with cancer risk group (17 male and 29 female) and T2DM patients without cancer risk group (3 male and 29 female) (p=0.013). Further, we put gender and other potential confounders (which has p<0.025 in bivariate analysis with antiP53-antibody, and found that T2DM with cancer status was the only one independent factor (beta=0.218, p=0.019) that could predict the increase of anti-p53 antibody, controlled by age, gender, BMI, DM duration, and HbA1c (Table 3).
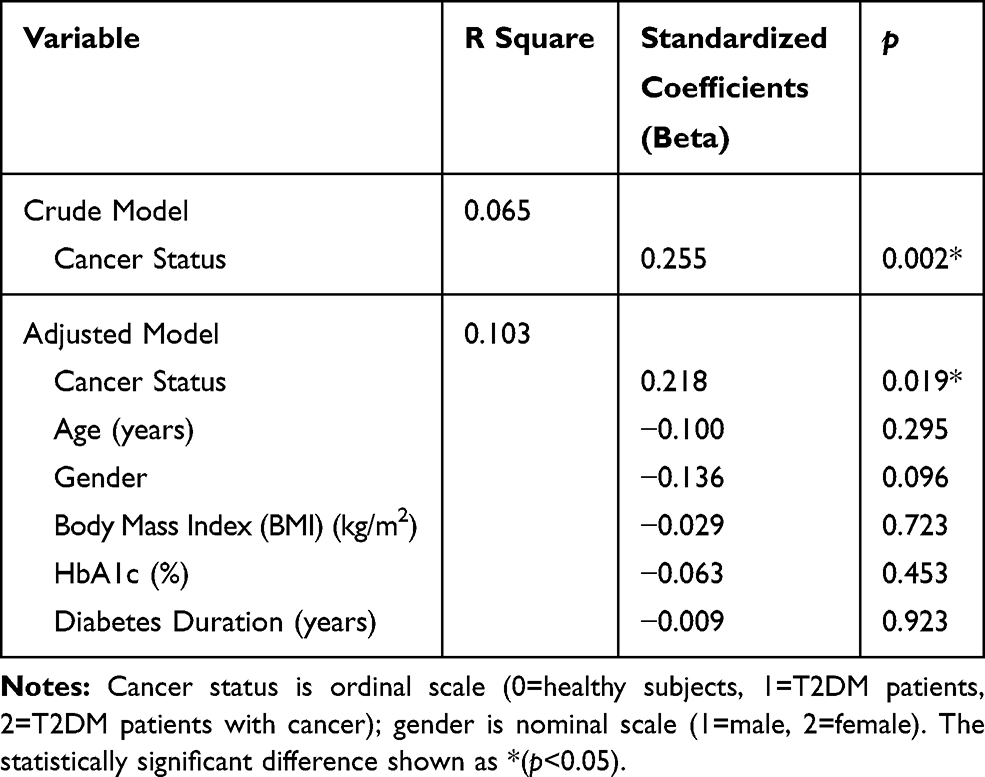 |
Table 3 Multivariate Linear Regression Analysis for Anti-P53 Antibody |
Anti-P53 Antibody Levels
We discovered an 8.3-fold (p<0.05) increase of anti-p53 antibody in the sera of T2DM patients and a 24-fold increase (p<0.001) in T2DM patients with cancer compared to healthy subjects (Figure 1). The anti-p53 antibodies significantly increased almost three times (p<0.05) in T2DM patients with cancer (0.72 U/mL±0.20) compared to T2DM patients (0.25 U/mL±0.05). Meanwhile, this antibody was almost undetectable in healthy subjects as a control group (0.03 U/mL±0.03). However, we did not find a significant difference for anti-p53 antibody between T2DM without cancer risk patients (0.19 U/mL±0.03) and T2DM with cancer risk patients (0.29 U/mL±0.08) (Figure 2), which the highest values were 0.67 U/mL and 2.95 U/mL in T2DM patients without and with cancer risk, respectively. The mean value of anti-p53 antibodies were presented in mean±SEM. The positive serum antibodies (≥ 1.3 U/mL)21 were found 3% in T2DM patients and 10% in T2DM patients with cancer.
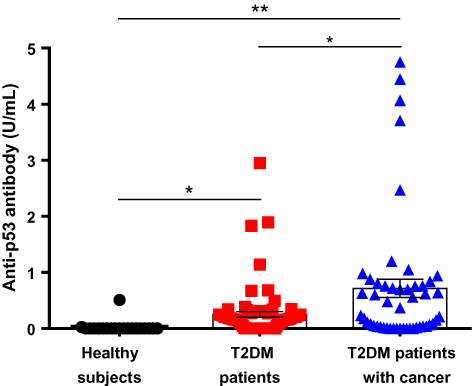 |
Figure 1 Anti-p53 antibody level in healthy subjects, T2DM patients, and T2DM patients with cancer. Values represent the mean of healthy subjects (n=20, 0.03 U/mL±0.03), T2DM patients (n=78, 0.25 U/mL±0.05), T2DM patients with cancer (n=50, 1 outlier was excluded, 0.72 U/mL±0.20). The statistically significant difference shown as *(p<0.05) and **(p<0.001). Data presented as mean±SEM. |
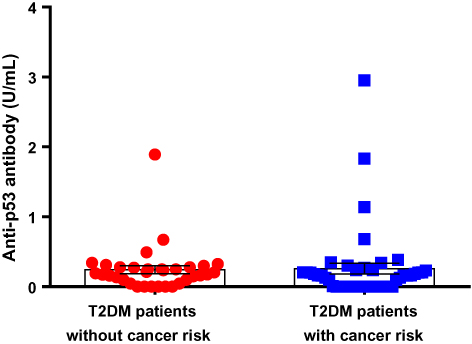 |
Figure 2 Anti-p53 antibody level in the sub group of T2DM patients according to cancer risk. Values represent the mean of T2DM without cancer risk patients (n=32, 0.19 U/mL±0.03) and T2DM with cancer risk patients (n=46, 0.29 U/mL±0.08) (p=0.292). Data presented as mean±SEM. |
Multivariate regression analysis showed that T2DM with cancer was the only one independent factor (beta=0.218, p=0.019) that could predict the increase of anti-p53 antibody, controlled by age, gender, BMI, DM duration, and HbA1c (Table 3).
Discussion
Extensive studies have been conducted to unravel the links between diabetes and cancer.22 Several mechanisms, including abnormality of glucose homeostasis and insulin resistance, have been suggested to involve as risk factors in the development of cancer survival in diabetes mellitus patients.1,23 Tumor suppressor p53 has associated with having a significant impact in respect of diabetes and cancer progression. Aside from the guardian of the genome that controlling gene expression and promoting DNA repair, p53 also crucial in maintaining glucose homeostasis via regulation of glucose transporters.8 Previous study has shown that hyperglycemia induces mutagenesis in human lymphoblastoid cells, which suggests promoting the activation of oncogenic signaling.24 It is also supported by another study that found abundant serum of glucose and insulin enhances cell cycle progression, which attributes to cell proliferation.25
High cytoplasmic p53 levels, whether mutant or wild-type, increased the likelihood of p53 protein being degraded by proteasomes and presented on cell surfaces, where T-cells recognize it in the major histocompatibility complex class I response to generate the p53 auto-antibody.26 This antibody is a potential predictor of cancer survival because p53 mutation occurs widely in certain cancers.27 Interestingly, we observed a 8.3-fold (p<0.05) increase of anti-p53 antibody in the sera of T2DM patients and a 24-fold increase (p<0.001) in T2DM patients with cancer compared to healthy patients. Moreover, this antibody was three times higher (p<0.05) in T2DM patients with cancer than T2DM patients only. The positive serum antibodies (≥ 1.3 U/mL) were found 3% in T2DM patients and 10% in T2DM patients with cancer. These percentages were quite smaller to indicate if there is an aberrant of p53 activity in T2DM patients. The anti-p53 antibody mostly detected in cancer patients with a prevalence range from 4–30%.28 It also appears at a low level in autoimmune diseases and types 1 diabetes mellitus.29 The anti-p53 antibody level was higher in T2DM with cancer risk, but we did not find a statistical difference when compared to T2DM without cancer risk. However the true risk factor could be something other than the suspected risk factor defined in this study. Though the anti-p53antibody value relative low to accurately detect cancer mutation in T2DM patients, these increased trends explained that diabetes exposure correlates with a higher anti-p53 antibody related to cancer progression.
Mutant p53 plays a significant role in inducing glycolysis through the translocation of glucose transporter protein type 1 (GLUT1) to the plasma membrane, which produces energy for cancer cells where excess glucose is available.8 However, when glucose is restricted, autophagy occurs and leading to degradation of mutant p53.30 The accumulation of mutant p53 in the cytoplasm is responsible for the inhibition of autophagy.31 Oxidative stress, the DNA damage response, and genome instability can cause autophagy deficiencies.32–34 Oxidative stress stimulates the activity of a signaling receptor that regulates many oncogenic pathways.35 Autophagy deficiency in the liver is known to drive the progress of liver cancer through inflammation and chronic cell death.36,37
Interestingly, there is increasing evidence that chronically elevated glucose in diabetes induces the accumulation of p53 in the cytosol that inhibits the autophagic clearance of damaged mitochondria by inhibitory protein-protein interactions with parkin, leading to impairment of mitochondrial energetics and subsequent insulin secretion signals in islet β-cells.38 The inhibition of autophagy in human, mouse, and nematode cells is mediated by cytoplasmic p53, but not nuclear p53.39 Hence, oxidative stress due to glucose abnormalities in type 2 diabetes may promote cancer progression directly through autophagy deficiency due to the accumulation of p53, which induces serum anti-p53 antibody production. By contrast, the role of autophagy in cancer cells varies by tissue. Some types of “autophagy addicted” cancers promote tumor growth as an adaption to stress.40–42 Although the role of autophagy in cancer is still poorly understood,43 balancing autophagy signaling by limiting glucose intake may be of therapeutic value in type 2 diabetes patients with a risk of cancer.
The complexities and inconsistencies regarding p53 function and status depend on the presence of distinct cellular stressors, such as obesity and nutrition deprivation, as well as the cell type. There is also a limitation in isolating p53 from the patient to measure p53 status, whether its mutant or normal cells that made anti-p53 antibodies are detectable in T2DM patients. Measurement of insulin and insulin growth factor 1(IGF1-1) may be needed to describe the patient’s condition more comprehensive. Therefore, additional molecular studies on the status of p53 are further needed.
Conclusion
Our results showed that antip53 antibody almost not detected in healthy subjects, but 8.3-fold increase in the sera of T2DM patients and 24-fold increase in T2DM patients with cancer. Therefore, this biomarker provides new information which explains the link between diabetes and cancer.
Acknowledgments
This study was supported by PDUPT Grant 2018–2019, Ministry of Research and Higher Education, Republic of Indonesia. We also would like to thank DRPM (Directorate of Research and Community Engagement) Universitas Indonesia for their support and assistance.
Disclosure
The authors report no conflicts of interest in this work.
References
1. Chang SC, Yang WCV. Hyperglycemia, tumorigenesis, and chronic inflammation. Crit Rev Oncol Hematol. 2016;108:146–153.
2. Stattin P, Björ O, Ferrari P, et al. Prospective study of hyperglycemia and cancer risk. Diabetes Care. 2007;30:561–567. doi:10.2337/dc06-0922
3. Federico A, Morgillo F, Tuccillo C, et al. Chronic inflammation and oxidative stress in human carcinogenesis. Int J Cancer. 2007;121:2381–2386. doi:10.1002/(ISSN)1097-0215
4. Strycharz J, Drzewoski J, Szemraj J, et al. Is p53 involved in tissue-specific insulin resistance formation? Oxid Med Cell Longev. 2017;2017:9270549.
5. Schisano B, Tripathi G, McGee K, et al. Glucose oscillations, more than constant high glucose, induce p53 activation and a metabolic memory in human endothelial cells. Diabetologia. 2011;54:1219–1226. doi:10.1007/s00125-011-2049-0
6. Puzio-Kuter AM. The role of p53 in metabolic regulation. Genes Cancer. 2011;2:385–391. doi:10.1177/1947601911409738
7. Nag S, Qin J, Srivenugopal KS, Wang M, Zhang R. The MDM2-p53 pathway revisited. J Biomed Res. 2013;27(4):254–271. doi:10.7555/JBR.27.20130030
8. Kung CP, Murphy ME. The role of the p53 tumor suppressor in metabolism and diabetes. J Endocrinol. 2016;231(2):R61–R75. doi:10.1530/JOE-16-0324
9. Ortega-Camarillo C, Guzmán-Grenfell AM, García-Macedo R, et al. Hyperglycemia induces apoptosis and p53 mobilization to mitochondria in RINm5F cells. Mol Cell Biochem. 2006;281:163–171. doi:10.1007/s11010-006-0829-5
10. Zhang C, Liu J, Liang Y, et al. Tumour-associated mutant p53 drives the warburg effect. Nat Commun. 2013;4:2935. doi:10.1038/ncomms3935
11. Tan BS, Tiong KH, Choo HL, et al. Mutant p53-R273H mediates cancer cell survival and anoikis resistance through AKTdependent suppression of BCL2-modifying factor (BMF). Cell Death Dis. 2015;16:e1826. doi:10.1038/cddis.2015.191
12. Dong P, Xu Z, Jia N, et al. Elevated expression of p53 gain-of-function mutation R175H in endometrial cancer cells can increase the invasive phenotypes by activation of the EGFR/PI3K/AKT pathway. Mol Cancer. 2009;16:103. doi:10.1186/1476-4598-8-103
13. Soussi T. p53 antibodies in the sera of patients with various types of cancer: a review. Cancer Res. 2000;60:1777–1788.
14. Lutz W, Nowakowska-Swirta E. Gene p53 mutations, protein p53, and anti-p53 antibodies as biomarkers of cancer process. Int J Occup Med Environ Health. 2002;15:209–218.
15. Chai Y, Peng B, Dai L, et al. Autoantibodies response to MDM2 and p53 in the immunodiagnosis of esophageal squamous cell carcinoma. Scand J Immunol. 2014;80:362–368. doi:10.1111/sji.2014.80.issue-5
16. PERKENI. Konsesnsus Pengelolaan dan Pencegaham Diabetes Melitus Tipe 2 di Indonesia 2015. PB. PERKENI; 2015.
17. American Diabetes Association (ADA). 2. Classification and diagnosis of diabetes. Diabetes Care. 2016;39:S13–S22. doi:10.2337/dc16-S005
18. Boden G. Free fatty acids, insulin resistance, and type 2 diabetes mellitus. Proc Assoc Am Physicians. 1999;111(3):241–248. doi:10.1046/j.1525-1381.1999.99220.x
19. Kim JA, Wei Y, Sowers JR. Role of mitochondrial dysfunction in insulin resistance. Circ Res. 2008;102(4):401–414. doi:10.1161/CIRCRESAHA.107.165472
20. Hsu CC, Tseng LM, Lee HC. Role of mitochondrial dysfunction in cancer progression. Exp Biol Med (Maywood). 2016;241(12):1281–1295. doi:10.1177/1535370216641787
21. Shimada H, Ochiai T, Nomura F. Titration of serum p53 antibodies in 1085 patients with various types of malignant tumors a multiinstitutional analysis by the Japan p53 antibody research group. Cancer. 2003;97:682–689. doi:10.1002/(ISSN)1097-0142
22. Abudawood M. Diabetes and cancer: a comprehensive review. J Res Med Sci. 2019;25(24):94. doi:10.4103/jrms.JRMS_242_19
23. Orgel E, Mittelman SD. The links between insulin resistance, diabetes, and cancer. Curr Diab Rep. 2013;13(2):213–222. doi:10.1007/s11892-012-0356-6
24. Zhang Y, Zhou J, Wang T, Cai L. High level glucose increases mutagenesis in human lymphoblastoid cells. Int J Biol Sci. 2007;3(6):375–379. doi:10.7150/ijbs.3.375
25. Kim D, Ahn BN, Kim Y, et al. High glucose with insulin induces cell cycle progression and activation of oncogenic signaling of bladder epithelial cells cotreated with metformin and pioglitazone. J Diabetes Res. 2019;2019:2376512. doi:10.1155/2019/2376512
26. Suppiah A, Greenman J. Clinical utility of anti-p53 auto-antibody: systematic review and focus on colorectal cancer. World J Gastroenterol. 2013;19:4651–4670. doi:10.3748/wjg.v19.i29.4651
27. Soussi T. The humoral response to the tumor-suppressor gene-product p53 in human cancer: implications for diagnosis and therapy. Immunol Today. 1996;17:354–356. doi:10.1016/0167-5699(96)30019-4
28. Angelopoulou K, Diamandis EP, Sutherland DJA, et al. Prevalence of serum antibodies against the p53 tumor suppressor gene protein in various cancers. Int J Cancer. 1994;58:480–487. doi:10.1002/ijc.2910580404
29. Di Cesare E, Previti M, Lombardo F, et al. Serum Anti-p53 autoantibodies in patients with type 1 diabetes. Ann Clin Lab Sci. 2001;31:253–258.
30. Rodriguez OC, Choudhury S, Kolukula V, et al. Dietary downregulation of mutant p53 levels via glucose restriction: mechanisms and implications for tumor therapy. Cell Cycle. 2012;11:4436–4446. doi:10.4161/cc.22778
31. Morselli E, Tasdemir E, Maiuri MC, et al. Mutant p53 protein localized in the cytoplasm inhibits autophagy. Cell Cycle. 2008;7:3056–3061. doi:10.4161/cc.7.19.6751
32. Karantza-Wadsworth V, Patel S, Kravchuk O, et al. Autophagy mitigates metabolic stress and genome damage in mammary tumorigenesis. Genes Dev. 2007;21:1621–1635. doi:10.1101/gad.1565707
33. Mathew R, Kongara S, Beaudoin B, et al. Autophagy suppresses tumor progression by limiting chromosomal instability. Genes Dev. 2007;21:1367–1381. doi:10.1101/gad.1545107
34. Takamura A, Komatsu M, Hara T, et al. Autophagy-deficient mice develop multiple liver tumors. Genes Dev. 2011;25:795–800. doi:10.1101/gad.2016211
35. Visconti R, Grieco D. New insights on oxidative stress in cancer. Curr Opin Drug Discov Devel. 2009;12:240–245.
36. Mathew R, Karp CM, Beaudoin B, et al. Autophagy suppresses tumorigenesis through elimination of p62. Cell. 2009;137:1062–1075. doi:10.1016/j.cell.2009.03.048
37. Sun B, Karin M. Inflammation and liver tumorigenesis. Front Med. 2013;7:242–254. doi:10.1007/s11684-013-0256-4
38. Hoshino A, Ariyoshi M, Okawa Y, et al. Inhibition of p53 preserves parkin-mediated mitophagy and pancreatic β-cell function in diabetes. Proc Natl Acad Sci. 2014;111:3116–3121. doi:10.1073/pnas.1318951111
39. Tasdemir E, Maiuri MC, Galluzzi L, et al. Regulation of autophagy by cytoplasmic p53. Nat Cell Biol. 2008;10:676–687. doi:10.1038/ncb1730
40. Guo JY, Chen HY, Mathew R, et al. Activated Ras requires autophagy to maintain oxidative metabolism and tumorigenesis. Genes Dev. 2011;25:460–470. doi:10.1101/gad.2016311
41. Lock R, Roy S, Kenific CM, et al. Autophagy facilitates glycolysis during Ras-mediated oncogenic transformation. Mol Biol Cell. 2011;22:165–178. doi:10.1091/mbc.e10-06-0500
42. Strohecker AM, Guo JY, Karsli-Uzunbas G, et al. Autophagy sustains mitochondrial glutamine metabolism and growth of BrafV600E-driven lung tumors. Cancer Discov. 2013;3:1272–1285. doi:10.1158/2159-8290.CD-13-0397
43. White E. Deconvoluting the context-dependent role for autophagy in cancer. Nat Rev Cancer. 2012;12:401–410. doi:10.1038/nrc3262
 © 2020 The Author(s). This work is published and licensed by Dove Medical Press Limited. The
full terms of this license are available at https://www.dovepress.com/terms
and incorporate the Creative Commons Attribution
- Non Commercial (unported, 3.0) License.
By accessing the work you hereby accept the Terms. Non-commercial uses of the work are permitted
without any further permission from Dove Medical Press Limited, provided the work is properly
attributed. For permission for commercial use of this work, please see paragraphs 4.2 and 5 of our Terms.
© 2020 The Author(s). This work is published and licensed by Dove Medical Press Limited. The
full terms of this license are available at https://www.dovepress.com/terms
and incorporate the Creative Commons Attribution
- Non Commercial (unported, 3.0) License.
By accessing the work you hereby accept the Terms. Non-commercial uses of the work are permitted
without any further permission from Dove Medical Press Limited, provided the work is properly
attributed. For permission for commercial use of this work, please see paragraphs 4.2 and 5 of our Terms.