Back to Journals » Research Reports in Clinical Cardiology » Volume 12
Sensitivity and Specificity of an Electrocardiogram to Detect Echocardiographic Left Ventricular Hypertrophy in a Sample of 326 Tanzanian Adults: Differences in Men and Women
Authors Chillo P ![]()
Received 27 March 2021
Accepted for publication 4 June 2021
Published 9 July 2021 Volume 2021:12 Pages 23—31
DOI https://doi.org/10.2147/RRCC.S313115
Checked for plagiarism Yes
Review by Single anonymous peer review
Peer reviewer comments 2
Editor who approved publication: Dr Richard Kones
Pilly Chillo
Department of Internal Medicine, Muhimbili University of Health and Allied Sciences, Dar es Salaam, Tanzania
Correspondence: Pilly Chillo
Department of Internal Medicine, Muhimbili University of Health and Allied Sciences, PO BOX 65001, Dar es Salaam, Tanzania
Tel +255 22 215 0603
Email [email protected]
Background: Although an electrocardiogram (ECG) is often used as the only tool to detect left ventricular hypertrophy (LVH) in many out-patient clinics in sub-Saharan Africa (SSA), its sensitivity has been reported to be low especially among black populations, and several studies have reported gender differences. These observations have however not been widely studied among SSA blacks.
Aim: To study the sensitivity and specificity of the ECG in detecting echocardiographic LVH in a sample of native adult Tanzanians.
Methods: Echocardiography and 12-lead resting ECGs were performed in Tanzanian adults who participated in studies to determine the prevalence and functional consequences of abnormal left ventricular geometry in out-patients with hypertension and diabetes. ECG-LVH was determined using Sokolow-Lyon (S-L) and Cornell product (C-P) criteria, and compared with echocardiographic LVH.
Results: In total, 326/425 (76.7%) participants of the original cohort had both ECG and echocardiogram measurements, and were included in this analysis. Echocardiographic LVH was present in 23.7% and 26.2% of men and women, respectively, while ECG-LVH was detected by S-L in 36.3% of men and 17.3% of women, and by C-P criteria in 20% of men and in 30.4% of women. The sensitivity [95% CI] and specificity [95% CI] of the S-L criteria was 43.8% [26.8– 62.1%] and 66.0% [55.9– 74.9%] in men while it was 36% [23.3– 50.9%] and 89% [82.8– 93.7%] in women, respectively. For the C-P criteria, the sensitivity and specificity were 43.8% [26.8– 62.1%] and 87.4% [79.0– 92.8%] in men and 60% [45.2– 73.3%] and 80.1% [89.7– 97.8%] in women, respectively.
Conclusion: The sensitivity of the ECG to detect LVH is low in this population, but better than that found in many white populations. Men and women have differences in the sensitivity of the different ECG criteria, with men performing better with S-L and women with C-P criteria. These differences should be considered when including or excluding cases with ECG-LVH in our populations.
Keywords: electrocardiogram, left ventricular hypertrophy, echocardiography, sensitivity, specificity, Tanzania, sub-Saharan Africa
Introduction
Left ventricular hypertrophy (LVH) is a strong and independent predictor of cardiovascular disease events including myocardial infarction, sudden death, stroke, congestive heart failure and overall CVD mortality.1–7 The existence of LVH in hypertensive, diabetic or even the general population has therefore important implications for assessing risk and for management with regards to decision making on interventions and/or medications to be used.8
LVH has been found to be highly prevalent among hypertensive and diabetic blacks in Africa and in the USA,9–12 which could partly explain the increased cardiovascular morbidity and mortality seen in blacks.13,14 It is therefore especially important to accurately diagnose LVH in these populations. To date, a number of highly accurate diagnostic tests for LVH detection are available, and they include cardiac magnetic resonance imaging (MRI), computed tomography (CT) - Scan and more recently 3- and 4-dimensional echocardiography.15 These tests are however limited by their costs and/or invasiveness, and therefore not recommended for regular clinical use. Two-dimensional trans-thoracic echocardiography is currently the recommended standard diagnostic test for the detection of LVH.8 Despite this, echocardiography is still not available in many parts of sub-Saharan Africa (SSA),16 making most clinicians in the region rely on the electrocardiogram (ECG) as the only tool available to diagnose or exclude LVH. However, the ECG has generally been questionable in its ability to detect or refute a true LV mass increase due to its variable sensitivity and specificity,17 with gender differences,18,19 making it an unreliable test especially among black populations.20,21 Furthermore, other factors including age, body habitus, race, underlying condition as well as the ECG criteria used, are known to influence the sensitivity and specificity of the ECG.22
Most of the previous studies on ECG among SSA populations have studied the prevalence and factors associated with ECG-LVH.23–26 Only few studies from the region have studied the ECG sensitivity and specificity to detect echocardiographic LV mass increase.26–29 Furthermore, the gender difference in the sensitivity and specificity of the ECG has not been previously studied. The current study was therefore carried out to determine the sensitivity and specificity of the commonly used ECG-LVH criteria, the Sokolow-Lyon (S-L) and the Cornell product (C-P) criteria, and to study gender differences in a sample of native Tanzanian adults.
Methods
Study Design and Population
This was a cross-sectional study conducted among untreated hypertensives, diabetic patients and normal individuals who participated in studies that were done to determine prevalence and functional consequences of echocardiographically determined LVH at Muhimbili National Hospital in Dar es Salaam, Tanzania.9,10,30 The present analysis include all adult (≥18 years) participants for whom an electrocardiogram was also recorded at the time of echocardiogram examination.
Sample Size
The sample size was calculated using the Kish-Leslie formula and a total of 320 subjects was enough to determine the prevalence of ECG-LVH at a power of 80%, using the previous known prevalence of 16% in the Tanzanian adult diabetic population.23
Data Collection Methods
Socio-Demographic and Clinical Variables
Structured questionnaires were used to record the participants’ socio-demographic characteristics, cardiovascular risk factors and use of medications. Height, weight, waist and hip circumference were measured. Body mass index was calculated from body weight in kilograms divided by height in m2 and obesity was considered present when body mass index was ≥ 30kg/m2.31 Waist circumference was considered increased when it was >88 cm in women and >110 cm in men.
A mercury sphygmomanometer was used to measure blood pressure, and a set of three readings, five minutes apart were performed by an experienced study nurse. For analysis, the average of the last two readings was taken as the participant’s clinic blood pressure.
Blood samples were drawn in the morning after an overnight fast and analyzed for creatinine, lipid profile and glucose. Biochemical tests were performed with the use of a chemistry analyser (Abbott Architect, Illinois, USA) at the Muhimbili National Hospital laboratory, while blood glucose was analyzed at the clinic using a HemoCue AB glucose analyzer (Angelholm, Sweden).
Electrocardiography
All electrocardiograms were performed at the Muhimbili National Hospital Electrocardiogram laboratory using a Phillips Machine. A 12-lead ECG was used and measurements were done in a quiet room by an experienced nurse. All ECGs were interpreted by the primary investigator and proofread by another senior cardiologist. QRS duration was measured to the nearest 4 ms and the R-wave amplitudes in leads aVL, V5, and V6; and S wave amplitudes in leads V1 and V3 were measured to the nearest 0.5 mm (0.05 mV) using calipers. The product of QRS duration times the Cornell voltage combination (RaVL + SV3, with 8 mm added in women) was used with a threshold value of 2440 mm x ms to identify LVH in the Cornell product criteria.32 Sokolow-Lyon voltage (SV1 + RV5/6) > 38 mm was considered to indicate LVH.
Echocardiography
All echocardiograms were performed by the primary investigator (PC) after receiving special training in echocardiography. A SONOS 7500 Phillips machine equipped with a 3-MHz transducer and second harmonic imaging was used. Quantitative echocardiography was performed following the American Society of Echocardiography guidelines.33 LV mass was calculated using the anatomically validated formula by Devereux.34 For this analysis, LV hypertrophy was considered present when LV mass indexed for body surface area exceeded 115 g/m2 in men and 95 g/m2 in women.8 Relative Wall Thickness was calculated as the ratio of end-diastolic posterior wall thickness to end-diastolic LV internal radius and considered increased if ≥0.43.8
Data Handling and Statistical Methods
Data management and statistical analysis was performed using SPSS for Windows version 21.0 (SPSS Inc., Chicago, Illinois, USA). Data were expressed as mean ± SD for continuous variables and as percentages for categorical variables. Groups of patients were compared using chi-square test for categorical variables and unpaired Student’s t-test, as appropriate. Bivariate correlations were assessed by Pearson’s correlation coefficient. A two-tailed p-value of ≤0.05 was considered statistically significant.
Ethical Considerations
The study was performed in accordance with the Helsinki Declaration on studies involving human subjects. Ethical approval was obtained from the Muhimbili University of Health and Allied Sciences’ research and publication committee, and all participants signed a written informed consent form before any data were collected.
Results
Out of the 425 participants of the original cohort, 326 (76.7%) were eligible for this study and had both ECG and echocardiogram measurements. Table 1 shows the demographic and clinical characteristics in men and women. The mean (SD) age of the total population was 49.5 (13.9) years (range 18–85), and 58.6% were women. On average, men were taller, leaner and had higher serum creatinine levels when compared with women. Women had higher mean values for overweight and an unfavourable lipid profile.
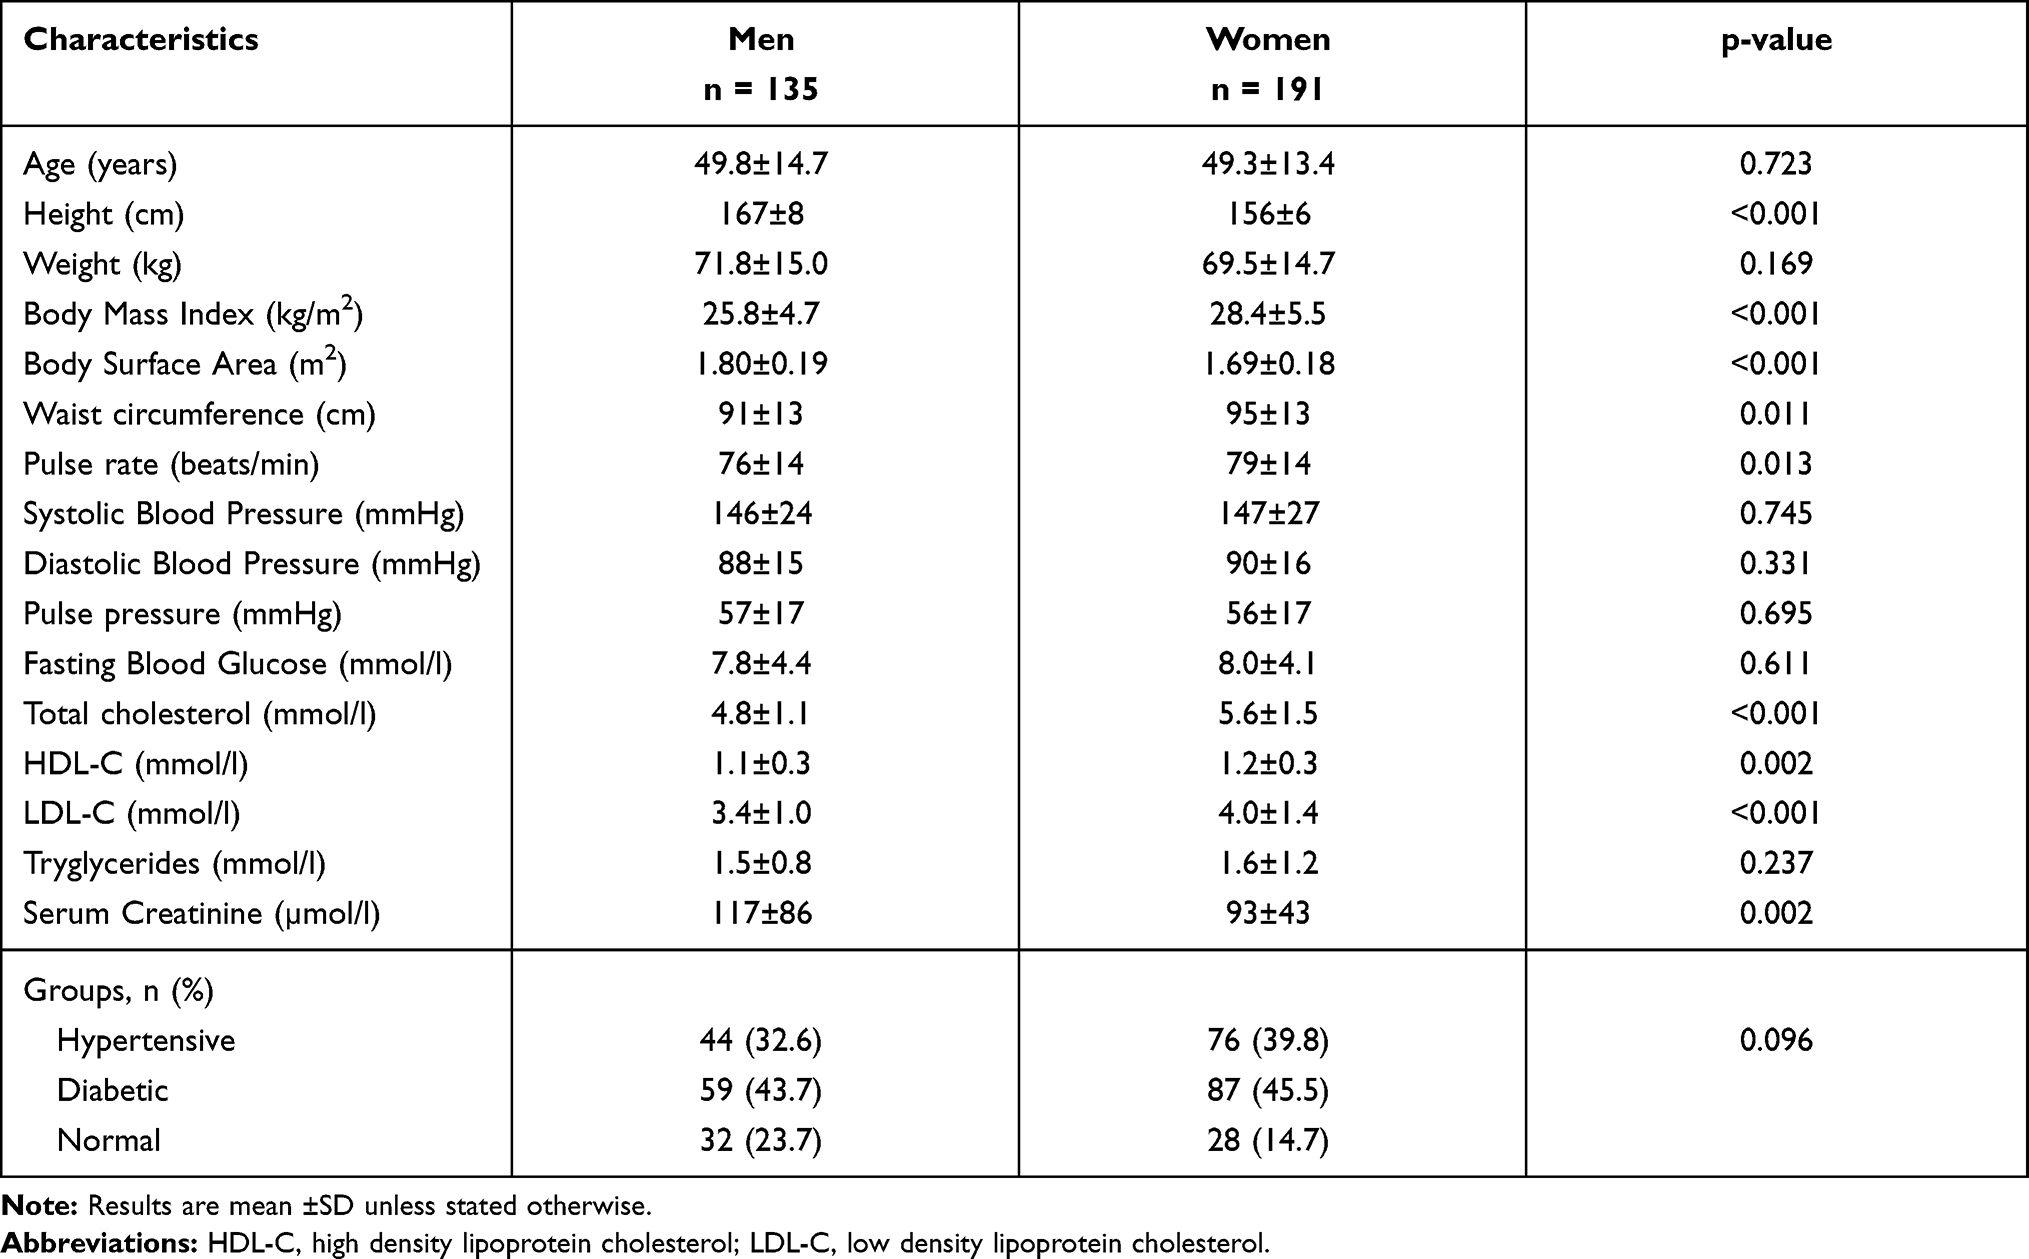 |
Table 1 Demographic and Clinical Characteristics of the Study Population |
Table 2 shows the mean values for electrocardiographic and echocardiographic findings compared between men and women. Most of the electrocardiographic findings differed between men and women, with men having significantly higher mean values of chest leads voltages, as well as higher mean QRS duration, all p<0.01. On the other hand, women had significantly higher mean value for the C-P criteria (p<0.001). On echocardiography, men had significantly higher mean values for LV end diastolic diameter, higher LV mass and LV mass index, all p < 0.05.
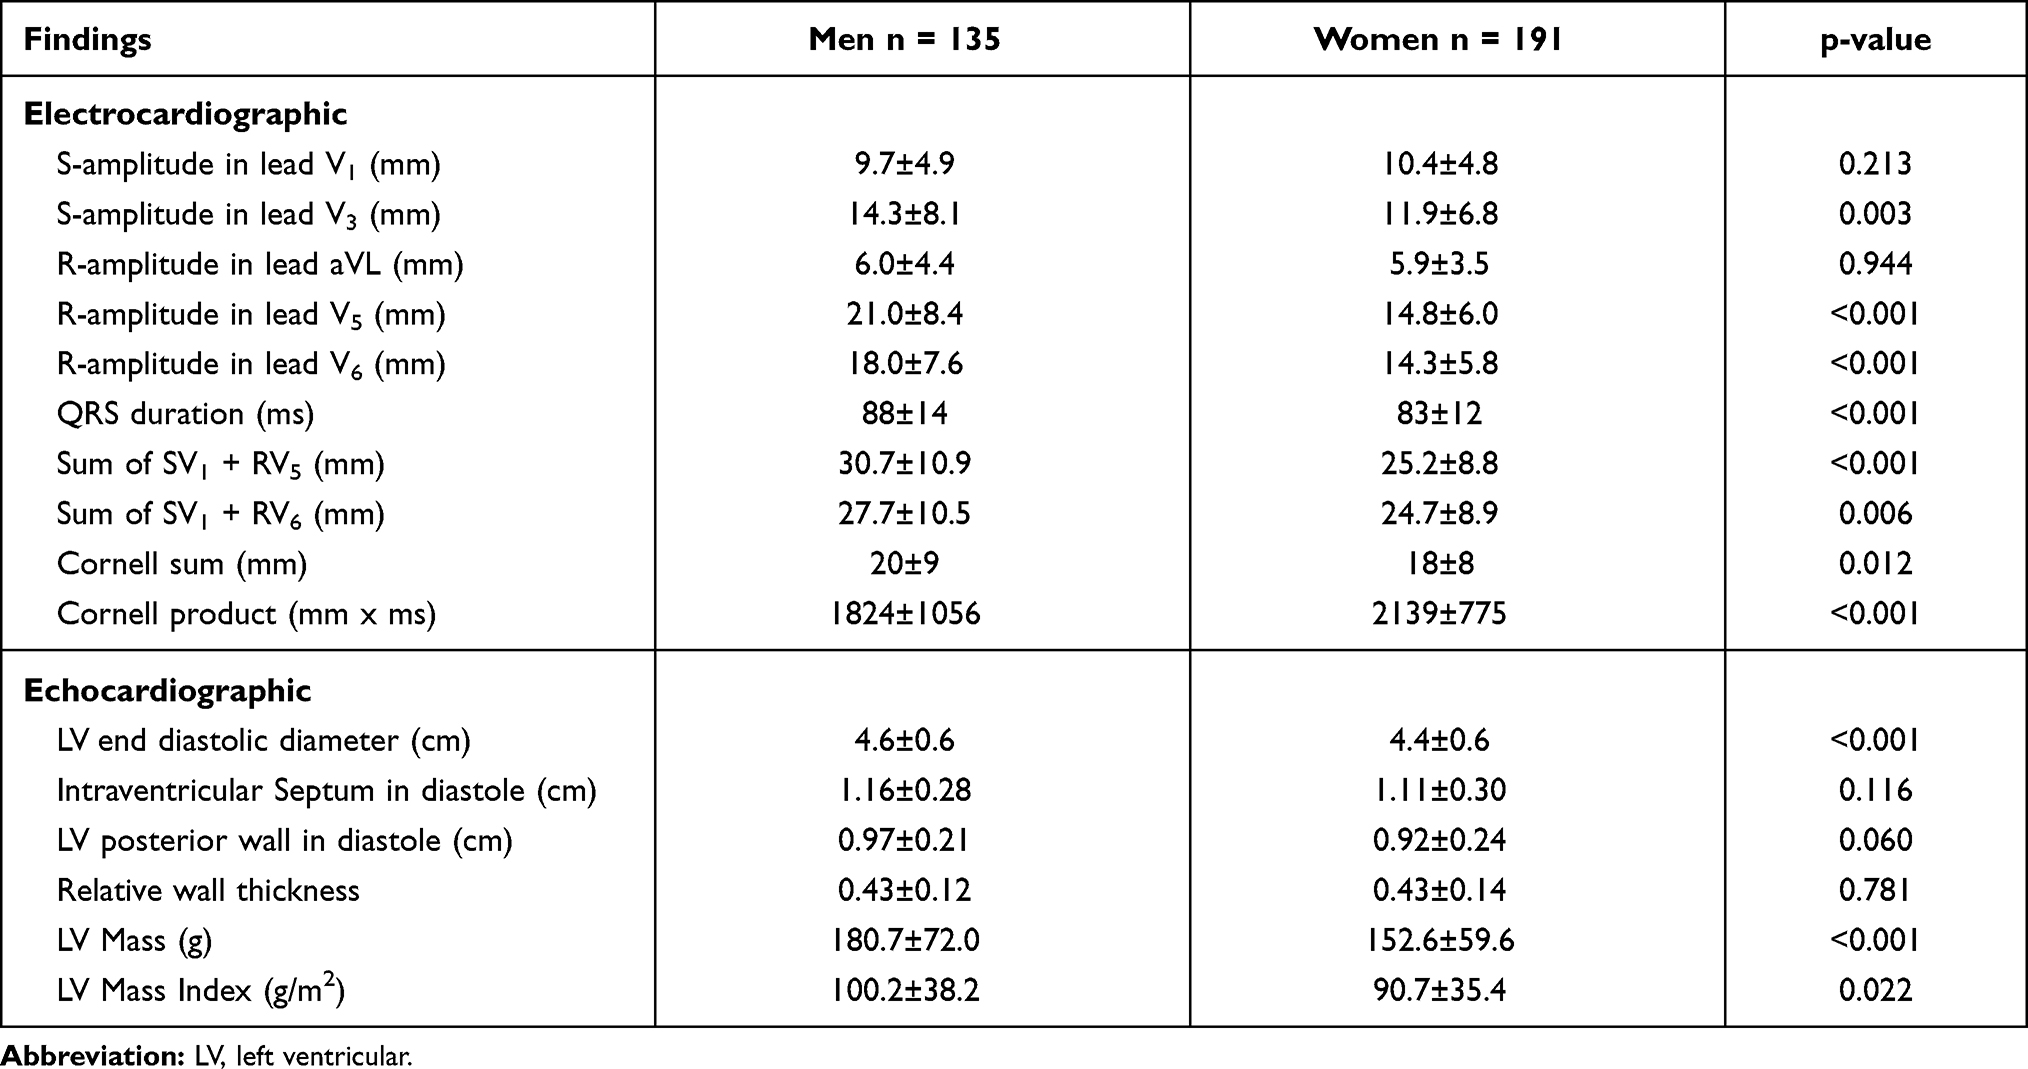 |
Table 2 Mean Values for Electrocardiographic and Echocardiographic Findings in Men and Women |
Table 3 shows the correlation between clinical and echocardiographic parameters with sum of voltage (as a function of S-L criteria) and the total Cornell-product index (as a function of C-P criteria). For the S-L criteria men had best correlations between leanness parameters and the sum of S-L, but no significant correlations with blood pressure. On the other hand, women in addition to measures of leanness, had also significant correlations between S-L and blood pressure. In men, only serum creatinine correlated with the C-P criteria, while several factors including age, blood pressure as well as serum creatinine showed significant correlations in women.
 |
Table 3 Clinical and Echocardiographic Correlation Coefficients (r) for Sokolow-Lyon and Cornell-Product Indices in Men and Women |
LV mass index had significant correlation with both ECG LVH criteria in men and women, although women had better correlation coefficients in both criteria (Table 3).
The prevalence of LVH by electrocardiogram and echocardiogram is shown in Figure 1. In those diagnosed to have ECG-LVH, only 10.4% and 11% of men and women respectively were diagnosed by both the S-L and C-P criteria.
 |
Figure 1 Prevalence of electro- and echo-cardiographic LVH in men and women. |
The correlation between LV mass index with the S-L and C-P indices as continuous variables is shown in Figure 2. Both criteria had significant and positive correlations with LV mass index as shown in the figure. Inserting the defining variables for LVH, Figure 2 shows the ability of the ECG to detect true LV mass increase as detected by echocardiography. Repeating this analysis using LV mass indexed for height2.7 did not much alter the correlations and the sensitivity results.
 |
Figure 2 Correlation between the S-L and C-P indices with echocardiographic LV mass index. |
As shown in Table 4, the sensitivity and specificity of the two ECG criteria differed between men and women, with women having best sensitivity and specificity using the C-P criteria, while men had equal sensitivity using the S-L criteria, and the overall poorest specificity when the S-L criteria was used. Of note, when both criteria were used, the sensitivity dropped to 28% but with a higher specificity at 95% for both men and women (Table 4).
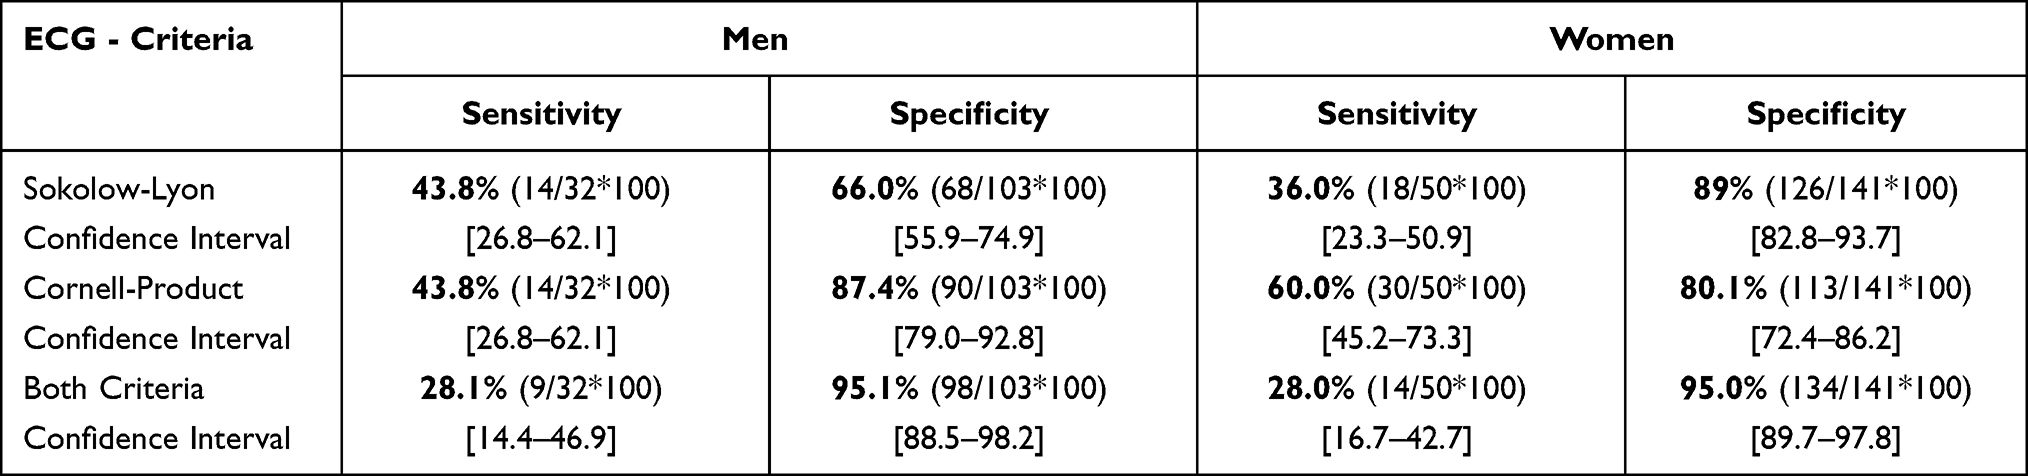 |
Table 4 Sensitivity and Specificity of the ECG in Detecting Echocardiographic LVH in Men and Women |
Discussion
Accurate diagnosis of LVH is important for clinical decision making. The cheap and readily available ECG has traditionally been the mainstay screening tool, however there are increasing concerns that the ECG is problematic in detecting true LVH.35 The present study confirms, and adds to the current literature among sub-Saharan black populations that the commonly used criteria S-L and C-P have low sensitivity in a native Tanzanian population, nonetheless with high specificity in detecting echocardiographic LVH. Further, there are ECG differences between men and women.
Both ECG criteria used for LVH diagnosis in this study had low sensitivity regardless of gender, similar to previous studies in Africa26,28,29 and from other parts of the world.17,18,20,21,36 The sensitivity seen in this study is however relatively higher than that obtained from several studies among white populations.17,20,37,38 In a recent publication from the Netherlands, de Hartog-Keyzer and colleagues reported the ECG to be only 14% sensitive in detecting echocardiographic LVH in a population of patients with long-standing hypertension,17 while in the Losartan Intervention For Endpoint reduction (LIFE) study the sensitivity among white patients was 27% and 45% when the S-L and C-P criteria were used, respectively.20 In a meta-analysis performed by Pewsner et al. which included mainly white populations in Europe and America, the sensitivity reported ranged between 8.5–21%,38 again much lower than the findings using either of the ECG criteria in the current study of black native Tanzanians. Nevertheless, our results show that the ECG only detected a few (between 36–60%) of the participants with echocardiographic LVH, leaving many others as false negatives. In clinical practice, this is unfavorable since patients with LVH need special attention in terms of medications choice and risk stratification, therefore a more sensitive test would be best. Others have suggested that the ECG should not be used to detect LVH due to its low and unreliable sensitivity.38 However, previous studies have found LVH detected by ECG provides independent prognostication of cardiovascular events,2,39 and this has been attributed to other mediation of prognosis including genetic differences seen in electrocardiographic LVH.40 It is therefore sensible to note that the ECG remains a valuable test in clinical cardiology.
Apart from the S-L in men, the other ECG criteria in this study had high specificity ranging from 80–89%, meaning that the ECG in this aspect was good in detecting patients without LVH. This finding has been reported by others17,18,20,26,28,36 and it is generally known that the ECG is mostly highly specific.35 In the LIFE study which included both black and white hypertensives in Europe and America, using the S-L criteria, the ECG was less specific among blacks (44%) when compared with whites (69%) in that study.20 The findings in this study show a relatively higher specificity even with the S-L criteria, and suggest that the lower specificity observed among blacks compared with whites in the LIFE study was likely due to the low specificity in men and not in women, as seen in this study (Table 4). However, in a setting of low sensitivity, the high specificity does not make sensible clinical meaning since many patients with LVH are, to begin with, labeled as without LVH. In this study, the specificity reached 95% when both criteria were positive for LVH, but at a very low sensitivity of 28%. Of note only 10.4% of women and 11% of men participants in our study were detected by both criteria, confirming the general observation that patients who meet one set of ECG criteria for LVH commonly do not meet other criteria.35 Okin et al. found that only 11.2% of patients with LVH by either Cornell voltage criteria or Sokolow-Lyon criteria had LVH diagnosed by both criteria in a large multiracial sample of patients with hypertension,32 remarkably similar to the present study.
Men and women differ in terms of their body habitus as well as cardiac muscle mass, with different ECG criteria giving different sensitivity and specificity between men and women.35 In the present study, using the S-L, men compared with women had better sensitivity (43.8% versus 30%), but at a cost of lower specificity (66% versus 89%). While women performed better with the C-P criteria reaching a sensitivity of 60% (versus 43.8%). These differences between men and women are similar to previous reports from outside SSA,2,18,36,41 and our study confirms this observation also in a native black population from Tanzania. Of note, in this study the clinical and echocardiographic parameters correlated better with the C-P criteria in women (Table 3) indicating a true relationship between the increased C-P indices with clinical and echocardiographic parameters. On the other hand, the S-L being calculated from chest leads, favored men due to the fact that the chest leads are in close proximity with the heart, different from women (due to the breast tissue), as others have suggested.36,41 Of note, men had significantly higher mean values for chest leads V3 – V6, compared with women (Table 2), and these are likely to translate to higher S-L indices, and therefore higher sensitivity to detect LVH, although at a cost of low specificity. It is also seen in our findings that among men, the S-L index did not correlate with important clinical variables for LVH including blood pressure, indicating a lack of relationship between the two (Table 3). This has translated to the lowest ECG-LVH specificity in this study (60%), also confirming previous other studies.21,36,41
This study is among the first to study the sensitivity and specificity of ECG in detecting echocardiographic LVH in Tanzania, therefore the study provides baseline data for future comparisons.
Conclusion
The sensitivity of the ECG to detect LVH is low in this population, comparable to previous observations but better than that found in many white populations. Men and women have differences in the sensitivity of the S-L and C-P criteria, with men performing better with S-L and women with C-P criteria. These differences should be considered when including or excluding cases with ECG-LVH among our populations.
Disclosure
The author reports no conflicts of interest in this work.
References
1. Sundstrom J, Lind L, Arnlov J, Zethelius B, Andren B, Lithell HO. Echocardiographic and electrocardiographic diagnoses of left ventricular hypertrophy predict mortality independently of each other in a population of elderly men. Circulation. 2001;103(19):2346–2351. doi:10.1161/01.CIR.103.19.2346
2. Okwuosa TM, Soliman EZ, Lopez F, Williams KA, Alonso A, Ferdinand KC. Left ventricular hypertrophy and cardiovascular disease risk prediction and reclassification in blacks and whites: the Atherosclerosis Risk in Communities Study. Am Heart J. 2015;169(1):155–161 e155. doi:10.1016/j.ahj.2014.09.013
3. Bots ML, Nikitin Y, Salonen JT, et al. Left ventricular hypertrophy and risk of fatal and non-fatal stroke. EUROSTROKE: a collaborative study among research centres in Europe. J Epidemiol Community Health. 2002;56(Suppl 1):i8–13. doi:10.1136/jech.56.suppl_1.i8
4. Tin LL, Beevers DG, Lip GY. Hypertension, left ventricular hypertrophy, and sudden death. Curr Cardiol Rep. 2002;4(6):449–457. doi:10.1007/s11886-002-0105-6
5. Walker RW, Dewhurst M, Gray WK, et al. Electrocardiographic assessment of coronary artery disease and stroke risk factors in rural and urban Tanzania: a case-control study. J Stroke Cerebrovascular Dis. 2014;23(2):315–320.
6. Lang RM, Badano LP, Mor-Avi V, et al. Recommendations for cardiac chamber quantification by echocardiography in adults: an update from the American Society of Echocardiography and the European Association of Cardiovascular Imaging. Eur Heart J Cardiovasc Imaging. 2015;16(3):233–270.
7. Chillo P, Lwakatare J, Rieck AE, Lutale J, Gerdts E. Prevalence and covariates of abnormal left ventricular geometry in never-treated hypertensive patients in Tanzania. Blood Press. 2014;23(1):31–38. doi:10.3109/08037051.2013.791415
8. Chillo P, Lwakatare J, Lutale J, Gerdts E. Increased relative wall thickness is a marker of subclinical cardiac target-organ damage in African diabetic patients. Cardiovasc J Afr. 2012;23(8):435–441. doi:10.5830/CVJA-2012-023
9. Baldo MP, Goncalves MA, Capingana DP, Magalhaes P, da Silva ABT, Mill JG. Prevalence and Clinical Correlates of Left Ventricular Hypertrophy in Black Africans. High Blood Pressure Cardiovascular Prevent. 2018;25(3):283–289. doi:10.1007/s40292-018-0267-y
10. Ogah OS, Bamgboye AE. Correlates of left ventricular mass in hypertensive Nigerians: an echocardiographic study. Cardiovasc J Afr. 2010;21(2):79–85.
11. Tajeu GS, Safford MM, Howard G, et al. Black-White Differences in Cardiovascular Disease Mortality: a Prospective US Study, 2003–2017. Am J Public Health. 2020;110(5):696–703. doi:10.2105/AJPH.2019.305543
12. Yuyun MF, Sliwa K, Kengne AP, Mocumbi AO, Bukhman G. Cardiovascular Diseases in Sub-Saharan Africa Compared to High-Income Countries: an Epidemiological Perspective. Glob Heart. 2020;15(1):15. doi:10.5334/gh.403
13. Agabiti-Rosei E, Muiesan ML, Salvetti M. New approaches to the assessment of left ventricular hypertrophy. Ther Adv Cardiovasc Dis. 2007;1(2):119–128. doi:10.1177/1753944707086350
14. Glezeva N, Gallagher J, Ledwidge M, et al. Heart failure in sub-Saharan Africa: review of the aetiology of heart failure and the role of point-of-care biomarker diagnostics. Tropical Med Int Health. 2015;20(5):581–588. doi:10.1111/tmi.12461
15. de Hartog-keyzer JML, El Messaoudi S, Harskamp R, et al. Electrocardiography for the detection of left ventricular hypertrophy in an elderly population with long-standing hypertension in primary care: a secondary analysis of the CHELLO cohort study. BMJ Open. 2020;10(8):e038824. doi:10.1136/bmjopen-2020-038824
16. Gasperin CA, Germiniani H, Facin CR, Souza AM, Cunha CL. An analysis of electrocardiographic criteria for determining left ventricular hypertrophy. Arq Bras Cardiol. 2002;78(1):59–82. doi:10.1590/S0066-782X2002000100006
17. Goncalves MAA, Pedro JM, Silva C, Magalhaes P, Brito M. Normal limits of the electrocardiogram in Angolans. J Electrocardiol. 2020;63:68–74. doi:10.1016/j.jelectrocard.2020.10.011
18. Okin PM, Wright JT, Nieminen MS, et al. Ethnic differences in electrocardiographic criteria for left ventricular hypertrophy: the LIFE study. Losartan Intervention For Endpoint. Am J Hypertens. 2002;15(8):663–671. doi:10.1016/S0895-7061(02)02945-X
19. Mahn JJ, Dubey E, Brody A, et al. Test characteristics of electrocardiography for detection of left ventricular hypertrophy in asymptomatic emergency department patients with hypertension. Acad Emergency Med. 2014;21(9):996–1002. doi:10.1111/acem.12462
20. Petersen SS, Pedersen LR, Pareek M, et al. Factors associated with diagnostic discrepancy for left ventricular hypertrophy between electrocardiography and echocardiography. Blood Press. 2017;26(1):54–63. doi:10.1080/08037051.2016.1235959
21. Lutale JJ, Thordarson H, Gulam-Abbas Z, Vetvik K, Gerdts E. Prevalence and covariates of electrocardiographic left ventricular hypertrophy in diabetic patients in Tanzania. Cardiovasc J Afr. 2008;19(1):8–14.
22. Dzudie A, Choukem SP, Dehayem MY, Kengne AP. Blood pressure variables and prevalent electrocardiographic left ventricular hypertrophy in sub-Saharan African individuals with type 2 diabetes. J Diabetes. 2012;4(4):424–431. doi:10.1111/j.1753-0407.2012.00209.x
23. Huston SL, Bunker CH, Ukoli FA, Rautaharju PM, Kuller LH. Electrocardiographic left ventricular hypertrophy by five criteria among civil servants in Benin City, Nigeria: prevalence and correlates. Int J Cardiol. 1999;70(1):1–14. doi:10.1016/S0167-5273(99)00061-3
24. Dada A, Adebiyi AA, Aje A, Oladapo OO, Falase AO. Standard electrocardiographic criteria for left ventricular hypertrophy in Nigerian hypertensives. Ethn Dis. 2005;15(4):578–584.
25. Mbaye A, Dodo B, Ngaide AA, et al. Left ventricular hypertrophy in black African subjects with artery hypertension: results of a cross-sectional survey conducted in semi-rural area in Senegal. Ann de cardiologie et d’angeiologie. 2017;66(4):210–216. doi:10.1016/j.ancard.2017.04.011
26. Jingi AM, Noubiap JJ, Kamdem P, Kingue S. Determinants and improvement of electrocardiographic diagnosis of left ventricular hypertrophy in a black African population. PLoS One. 2014;9(5):e96783. doi:10.1371/journal.pone.0096783
27. Robinson C, Woodiwiss AJ, Libhaber CD, Norton GR. Novel Approach to the Detection of Left Ventricular Hypertrophy Using Body Mass Index-Corrected Electrocardiographic Voltage Criteria in a Group of African Ancestry. Clin Cardiol. 2016;39(9):524–530. doi:10.1002/clc.22560
28. Chillo P, Rieck AE, Lwakatare J, Lutale J, Gerdts E. Left atrial volume index as a marker of left ventricular diastolic dysfunction in asymptomatic Tanzanian diabetic patients. Blood Press. 2013;22(2):86–93. doi:10.3109/08037051.2012.707351
29. National Institutes of Health. Clinical Guidelines on the Identification, Evaluation, and Treatment of Overweight and Obesity in Adults--The Evidence Report. Obes Res. 1998;6(Suppl 2):51S–209S.
30. Okin PM, Devereux RB, Jern S, Kjeldsen SE, Julius S, Dahlof B. Baseline characteristics in relation to electrocardiographic left ventricular hypertrophy in hypertensive patients: the Losartan intervention for endpoint reduction (LIFE) in hypertension study. The Life Study Investigators. Hypertension. 2000;36(5):766–773. doi:10.1161/01.HYP.36.5.766
31. Lang RM, Bierig M, Devereux RB, et al. Recommendations for chamber quantification. Eur J Echocardiogr. 2006;7(2):79–108. doi:10.1016/j.euje.2005.12.014
32. Devereux RB, Alonso DR, Lutas EM, et al. Echocardiographic assessment of left ventricular hypertrophy: comparison to necropsy findings. Am J Cardiol. 1986;57(6):450–458. doi:10.1016/0002-9149(86)90771-X
33. Bang CN, Soliman EZ, Simpson LM, et al. Electrocardiographic Left Ventricular Hypertrophy Predicts Cardiovascular Morbidity and Mortality in Hypertensive Patients: the ALLHAT Study. Am J Hypertens. 2017;30(9):914–922. doi:10.1093/ajh/hpx067
34. Liao Y, Cooper RS, Durazo-Arvizu R, Mensah GA, Ghali JK. Prediction of mortality risk by different methods of indexation for left ventricular mass. J Am Coll Cardiol. 1997;29(3):641–647. doi:10.1016/S0735-1097(96)00552-9
35. Hancock EW, Deal BJ, Mirvis DM, et al. AHA/ACCF/HRS recommendations for the standardization and interpretation of the electrocardiogram: part V: electrocardiogram changes associated with cardiac chamber hypertrophy: a scientific statement from the American Heart Association Electrocardiography and Arrhythmias Committee, Council on Clinical Cardiology; the American College of Cardiology Foundation; and the Heart Rhythm Society: endorsed by the International Society for Computerized Electrocardiology. Circulation. 2009;119(10):e251–261. doi:10.1161/CIRCULATIONAHA.108.191097
36. Okin PM, Roman MJ, Devereux RB, Kligfield P. Gender differences and the electrocardiogram in left ventricular hypertrophy. Hypertension. 1995;25(2):242–249. doi:10.1161/01.HYP.25.2.242
37. Levy D, Labib SB, Anderson KM, Christiansen JC, Kannel WB, Castelli WP. Determinants of sensitivity and specificity of electrocardiographic criteria for left ventricular hypertrophy. Circulation. 1990;81(3):815–820. doi:10.1161/01.CIR.81.3.815
38. Pewsner D, Juni P, Egger M, Battaglia M, Sundstrom J, Bachmann LM. Accuracy of electrocardiography in diagnosis of left ventricular hypertrophy in arterial hypertension: systematic review. BMJ. 2007;335(7622):711. doi:10.1136/bmj.39276.636354.AE
39. Okin PM, Hille DA, Kjeldsen SE, Devereux RB. Combining ECG Criteria for Left Ventricular Hypertrophy Improves Risk Prediction in Patients With Hypertension. J Am Heart Assoc. 2017;6(11). doi:10.1161/JAHA.117.007564
40. Mayosi BM, Avery PJ, Farrall M, Keavney B, Watkins H. Genome-wide linkage analysis of electrocardiographic and echocardiographic left ventricular hypertrophy in families with hypertension. Eur Heart J. 2008;29(4):525–530. doi:10.1093/eurheartj/ehn028
41. Colossimo AP, Costa Fde A, Riera AR, et al. Electrocardiogram sensitivity in left ventricular hypertrophy according to gender and cardiac mass. Arq Bras Cardiol. 2011;97(3):225–231. doi:10.1590/S0066-782X2011005000085
 © 2021 The Author(s). This work is published and licensed by Dove Medical Press Limited. The
full terms of this license are available at https://www.dovepress.com/terms
and incorporate the Creative Commons Attribution
- Non Commercial (unported, 3.0) License.
By accessing the work you hereby accept the Terms. Non-commercial uses of the work are permitted
without any further permission from Dove Medical Press Limited, provided the work is properly
attributed. For permission for commercial use of this work, please see paragraphs 4.2 and 5 of our Terms.
© 2021 The Author(s). This work is published and licensed by Dove Medical Press Limited. The
full terms of this license are available at https://www.dovepress.com/terms
and incorporate the Creative Commons Attribution
- Non Commercial (unported, 3.0) License.
By accessing the work you hereby accept the Terms. Non-commercial uses of the work are permitted
without any further permission from Dove Medical Press Limited, provided the work is properly
attributed. For permission for commercial use of this work, please see paragraphs 4.2 and 5 of our Terms.