")
Back to Journals » Patient Preference and Adherence » Volume 12
Self-reported adherence and biomarker levels of CoQ10 and alpha-tocopherol
Authors Vitolins MZ , Case LD, Rapp SR, Lively MO, Shaw EG, Naughton MJ, Giguere J, Lesser GJ
Received 2 December 2017
Accepted for publication 23 February 2018
Published 24 April 2018 Volume 2018:12 Pages 637—646
DOI https://doi.org/10.2147/PPA.S158682
Checked for plagiarism Yes
Review by Single anonymous peer review
Peer reviewer comments 2
Editor who approved publication: Dr Johnny Chen
Mara Z Vitolins,1 L Douglas Case,1 Stephen R Rapp,2 Mark O Lively,3 Edward G Shaw,4 Michelle J Naughton,5 Jeffrey Giguere,6 Glenn J Lesser7
1Division of Public Health Sciences, Wake Forest School of Medicine, Winston-Salem, NC, USA; 2Department of Psychiatry and Behavioral Medicine, Wake Forest School of Medicine, Winston-Salem, NC, USA; 3Department of Biochemistry, Wake Forest School of Medicine, Winston-Salem, NC, USA; 4Department of Internal Medicine-Gerontology and Geriatric Medicine, Wake Forest School of Medicine, Winston-Salem, NC, USA; 5Department of Internal Medicine, The Ohio State University, Columbus, OH, USA; 6Greenville Community Oncology Research Program of the Carolinas, Greenville, SC, USA; 7Department of Internal Medicine-Hematology and Oncology, Wake Forest School of Medicine, Medical Center Boulevard, Winston-Salem, NC, USA
Purpose: Women with breast cancer were randomized to receive coenzyme Q10 (CoQ10) plus Vitamin E or placebo in a clinical trial. The objective of this evaluation is to examine the association between participant self-reported adherence to the study supplements and changes in plasma biomarker levels.
Patients and methods: Correlation coefficients quantified the association between changes in alpha-tocopherol and CoQ10 levels and the association between self-reported adherence and changes in biomarkers. Participants were categorized by self-reported adherence; Kruskal–Wallis tests compared changes in alpha-tocopherol and CoQ10 levels between self-reported adherence groups.
Results: Women (N=155) provided baseline and post-treatment biomarkers; 147 completed at least one diary. While changes in alpha-tocopherol and CoQ10 levels were moderately correlated, correlations ranged from 0.40 to 0.48, association between self-reported adherence and plasma alpha-tocopherol or CoQ10 levels was weak; correlations ranged from 0.10 to 0.29 at weeks 8, 16, and 24. Some participants with high self-reported adherence actually had decreases in their biomarker levels.
Conclusion: These findings support that self-reported adherence is likely to be overestimated. Biological and other measures of adherence that can better identify true adherence to study pills provided in clinical trials are greatly needed as they may assist in improving the interpretation of findings of future clinical trials.
Keywords: adherence, self-report, blood biomarkers, clinical trial, CoQ10, alpha-tocopherol
Introduction
It is well known that participants in clinical trials do not always fully adhere to their assigned study arm. Participants randomized to the intervention may discontinue the intervention and participants in the control condition may begin following the intervention, more typically if the intervention is readily available; for example, when a nutritional supplement can be purchased over-the-counter. There are a number of factors that influence participant adherence and while some are addressable, others are not.1 Unfortunately, trial results can be greatly affected by participant nonadherence, because lack of adherence can lead to an underestimation of the treatment effect, as well as a loss of statistical power.2
It has been estimated that 25%–50% of the participants enrolled in clinical trials are not fully adherent and a universal “gold standard” approach for monitoring adherence has yet to be identified.3 Current methods used to assess medication/pill adherence in clinical trials include diaries (participant self-report), pill counts, medication container technology and, less frequently, biomarker measurements. Participant-reported adherence has been found to overestimate adherence and is subject to recall bias.4–7 Biomarkers of adherence are also limited as differential absorption of the contents of the study pill, interactions with other medications and supplements, and comorbidities all contribute to the low correlations in biomarker measures in assessing adherence.8,9
A randomized, double-blind, placebo-controlled study was conducted in female breast cancer patients with the primary objective of determining the effect of coenzyme Q10 (CoQ10) supplementation on self-reported treatment-related fatigue.10 This clinical trial presented a unique opportunity to investigate adherence to 2 study arms, (intervention vs control groups), as both intervention and control participants were provided study supplements also containing Vitamin E, and blood levels of alpha-tocopherol and CoQ10 were assessed at baseline, 8, 16, and 24 weeks. The objective of this evaluation was to examine the association between participant self-reported adherence to the protocol-prescribed regimen for consuming the study pills and associated changes in plasma biomarker levels.
Patients and methods
This secondary analysis was performed on data collected from the randomized double-blind, placebo-controlled study of oral CoQ10 to relieve self-reported treatment-related fatigue in newly diagnosed patients with breast cancer.10 Two hundred and thirty-six women were enrolled through the Comprehensive Cancer Center of the Wake Forest University Research Base Community Clinical Oncology Practice (CCOP) sites and were randomized to receive daily oral supplements of Vitamin E (300 IU)±CoQ10 (300 mg). The intervention pill consisted of 100 IU of CoQ10+100 IU of Vitamin E and the control group pill contained 100 IU of Vitamin E. The participants were asked to consume 1 study pill 3 times a day. The main study and methods are fully described elsewhere. Briefly, women were eligible to participate if they had a new, primary diagnosis of breast cancer and planned adjuvant chemotherapy.10 Exclusion criteria included unintentional weight loss in the past 3 months (>5% of body weight), taking statins, use of medications for fatigue, and being treated for diabetes or hypertension. Participants were stratified by type of chemotherapy (anthracycline vs no anthracycline) and whether or not they received radiation as a part of their treatment. Institutional review board (IRB) approval was obtained by Alamance Regional Medical Center; East Carolina University; Wake Forest Baptist School of Medicine; Christiana Care Health Services CCOP; Louisiana State University–Shreveport MBCCOP; Northern Indiana Cancer Research Consortium CCOP; Ozarks Regional CCOP; Santa Rosa Memorial CCOP; Southeast Cancer Control Consortium and Western Regional CCOP, and all patients signed informed consent forms. For this secondary analysis, we included data from participants who completed at least 1 post-randomization adherence diary and had baseline and post-treatment blood draws.
The CoQ10 and Vitamin E supplements were manufactured to look identical to avoid unmasking participants. The Vitamin E was included in the CoQ10 supplement to support absorption of CoQ10. Participants were also instructed to avoid taking any additional supplements during the course of the study. Participants were requested to complete a diary in which they recorded the number of pills taken daily (ie, 0, 1, 2, or 3 pills). Diaries were returned to study staff during clinic visits.
Participant demographic and health characteristics
Participants self-reported their age and race/ethnicity. Body weight and height were measured using standardized methodology. Weight was measured to the nearest 0.1 kg and height was measured to the nearest 0.1 cm by trained staff in the clinics. Body mass index was calculated using the following formula: weight in kg/(height in m)2.
Laboratory blood collection
All participants were asked if they would agree to a blood draw at study visits to allow investigators to measure blood levels of CoQ10 and Vitamin E. If the participant agreed, blood was drawn following an 8-h fast.
CoQ10 measurement
CoQ10 was analyzed utilizing methodology described by Kaikkonen et al.11 A total of 200 μL of the plasma sample (or standard in ethanol) was mixed with 1 mL of buffer and 1 mL of ethanol and 200 μL of CuCl2 and allowed to oxidize at room temperature. At the end of this incubation, 50 μL of the internal standard (tocol) was added. The mixture was rapidly extracted with 4 mL of hexane, vortexed and centrifuged (at 1,500× g for 10 min). The upper hexane layer was removed and transferred into a borosilicate glass culture tube. The ethanol/buffer layer was extracted again with 4 mL of hexane. The combined hexane layers were evaporated to dryness under stream of nitrogen. The dry residue was reconstituted with 200 μL of butylated hydroxytolene (BHT) ethanol. A total of 35 mL was injected onto the high-performance liquid chromatography (HPLC) system. The HPLC instrumentation included a C18 (4.6×250 mm) analytical column. The mobile phase (I) consisted of acetonitrile/tetrahydrofuran/methanol/1% ammonium acetate (660:220:68:28 by volume) and was pumped isocratically at a flow rate of 1.5 mL/min. The column eluent was monitored at 292 and 275 nm.
Alpha-tocopherol measurement
Alpha-tocopherol was measured using a modification of the HPLC methodology.12 A total of 200 mL of the plasma sample (or standard in ethanol) was mixed with 50 μL of the internal standard (tocol) and 1 μL of BHT ethanol and vortexed for 30 s. Two milliliters of hexane were added, and the solution was vortexed and centrifuged (at 1,500× g for 10 min). The upper hexane layer was removed and transferred into a borosilicate glass culture tube. The ethanol layer was extracted again with 2 μL of hexane. The combined hexane layers were evaporated to dryness under stream of nitrogen. The dry residue was reconstituted with 200 μL of BHT ethanol. A total of 35 mL was injected onto the HPLC system. The HPLC instrumentation included a C18 (4.6×250 mm) analytical column. The mobile phase (I) consisted of acetonitrile/tetrahydrofuran/methanol/1% ammonium acetate (660:220:68:28 by volume) and was pumped isocratically at a flow rate of 1.5 mL/min. The column eluent was monitored at 292 nm. All steps were performed in subdued amber lighting.
Statistical methods
Adherence was calculated using 3 definitions, each progressively more conservative with respect to missing data: 1) percent of ideal dose for returned diaries with missing days excluded; 2) percent of ideal dose for returned diaries with missing days counted as zeros; and 3) percent of ideal dose with missing days and missing diaries counted as zeros. For example, one participant returned only the first diary with 1 day coded “2.” Twenty-one days should have been coded, but 20 were left blank. By the first definition, the participant was 100*2/3=66.7% adherent. By the second definition, the participant was 100 2/(21*3)=3.2% adherent. By the third definition, the participant was 100*2/(56*3)=1.2% adherent for the first 8 weeks and 100*2/(168*3)=0.4% adherent over the entire study period.
CoQ10 and alpha-tocopherol levels were assessed at baseline and 8, 16, and 24 weeks following randomization. Change in alpha-tocopherol from baseline in all women was used as one marker of “objective” adherence. The change in CoQ10 from baseline (in the CoQ10 group only) was used as a second “objective” marker of adherence. Self-reported adherence was calculated for the first 8 weeks, the first 16 weeks, and for the entire 24-week study period. Since CoQ10 and alpha-tocopherol have relatively short half-lives, we also calculated self-reported adherence for the 1 and 2 weeks prior to the study visits. Pearson and Spearman correlations were used to quantify the strength of the linear and monotonic associations between self-reported adherence and the change in CoQ10 and alpha-tocopherol at 8, 16, and 24 weeks. Additionally, using the third and most conservative definition of adherence, participants were categorized into low (≤60%), intermediate (60%–90%), and high (>90%) self-reported adherence after 8, 16, and 24 weeks, and Kruskal–Wallis test was used to assess differences in the “objective” markers of adherence between these self-reported adherence groups.
Results
Two hundred and thirty-six women were enrolled through the participating practice sites into the main trial. Of these, 155 participants provided blood samples at baseline and at least 1 post-treatment visit. Most (91%) of the 81 women who did not provide both baseline and post-treatment blood samples dropped out of the study early. Characteristics of the women who did and did not provide usable biomarker data are shown in Table 1 and are similar for the 2 groups. The 155 women in this analysis had a median age of 52 years with a range between 28 and 72. Most were white (87%), 10% were black, and 3% were Hispanic. Most women (90%) had an Eastern Cooperative Oncology Group performance status of 0%, and 66% were overweight or obese; 83% received anthracycline chemotherapy and 62% received radiation therapy.
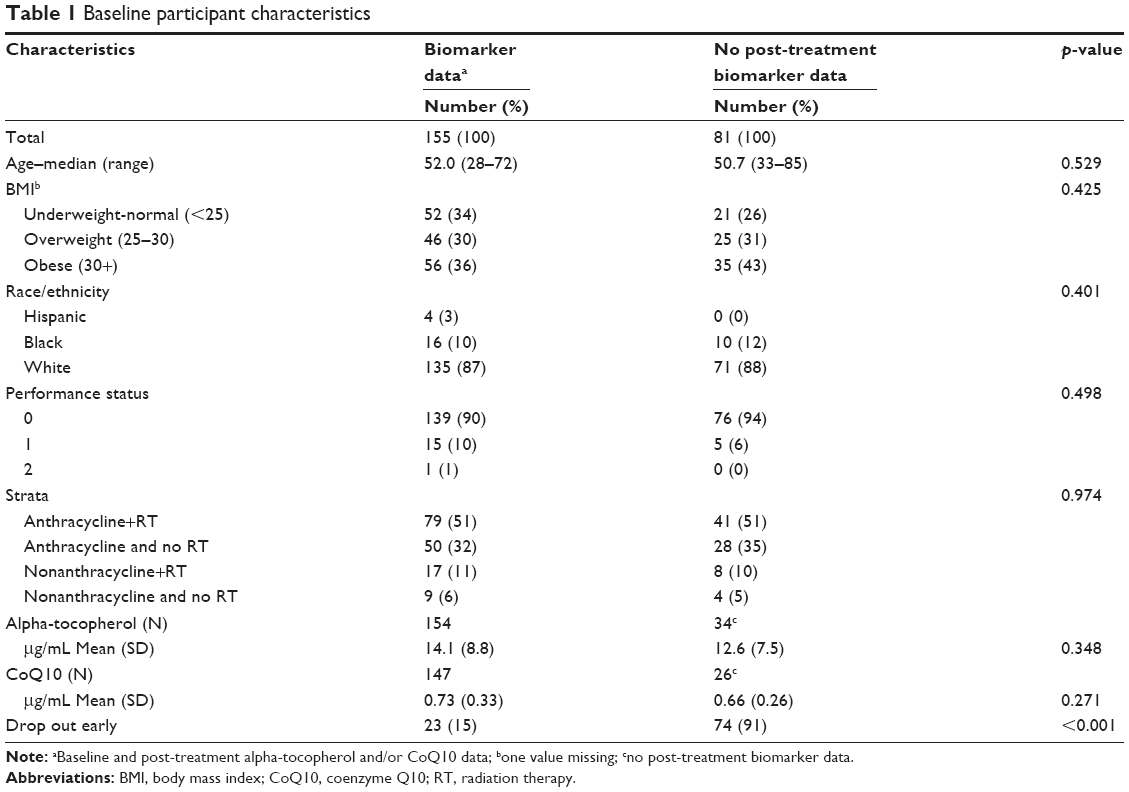 | Table 1 Baseline participant characteristics |
Pill-adherence diary
One hundred forty-seven of the 155 women (95%) returned at least 1 day of diary information. Of those who returned diaries, the mean number of completed diary days was 143 and ranged from 1 to 168 (Table 2). Adherence distributions are shown in Figure 1. Mean (SD) self-reported adherence for the first 8 weeks was 91.9% (10.0), 85.8% (17.2), and 80.6% (26.5) using definitions 1, 2, and 3, respectively. These estimates were 91.3% (10.3), 83.6% (17.5), and 74.2% (30.1) over the entire 24-week study period. All 3 estimates of adherence get progressively lower over time, but the drop is greatest using the third definition (most stringent) as more women dropped out of the study over time.
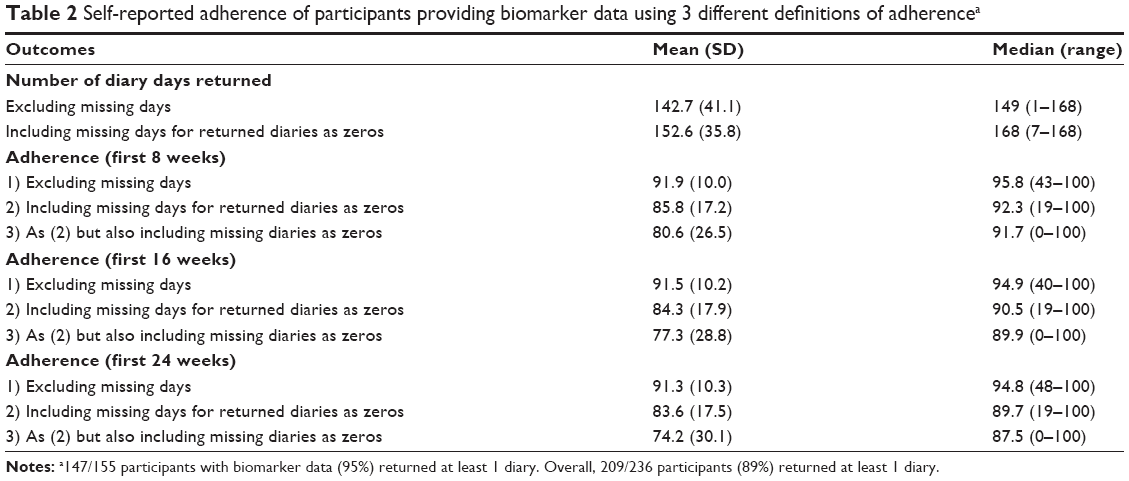 | Table 2 Self-reported adherence of participants providing biomarker data using 3 different definitions of adherencea |
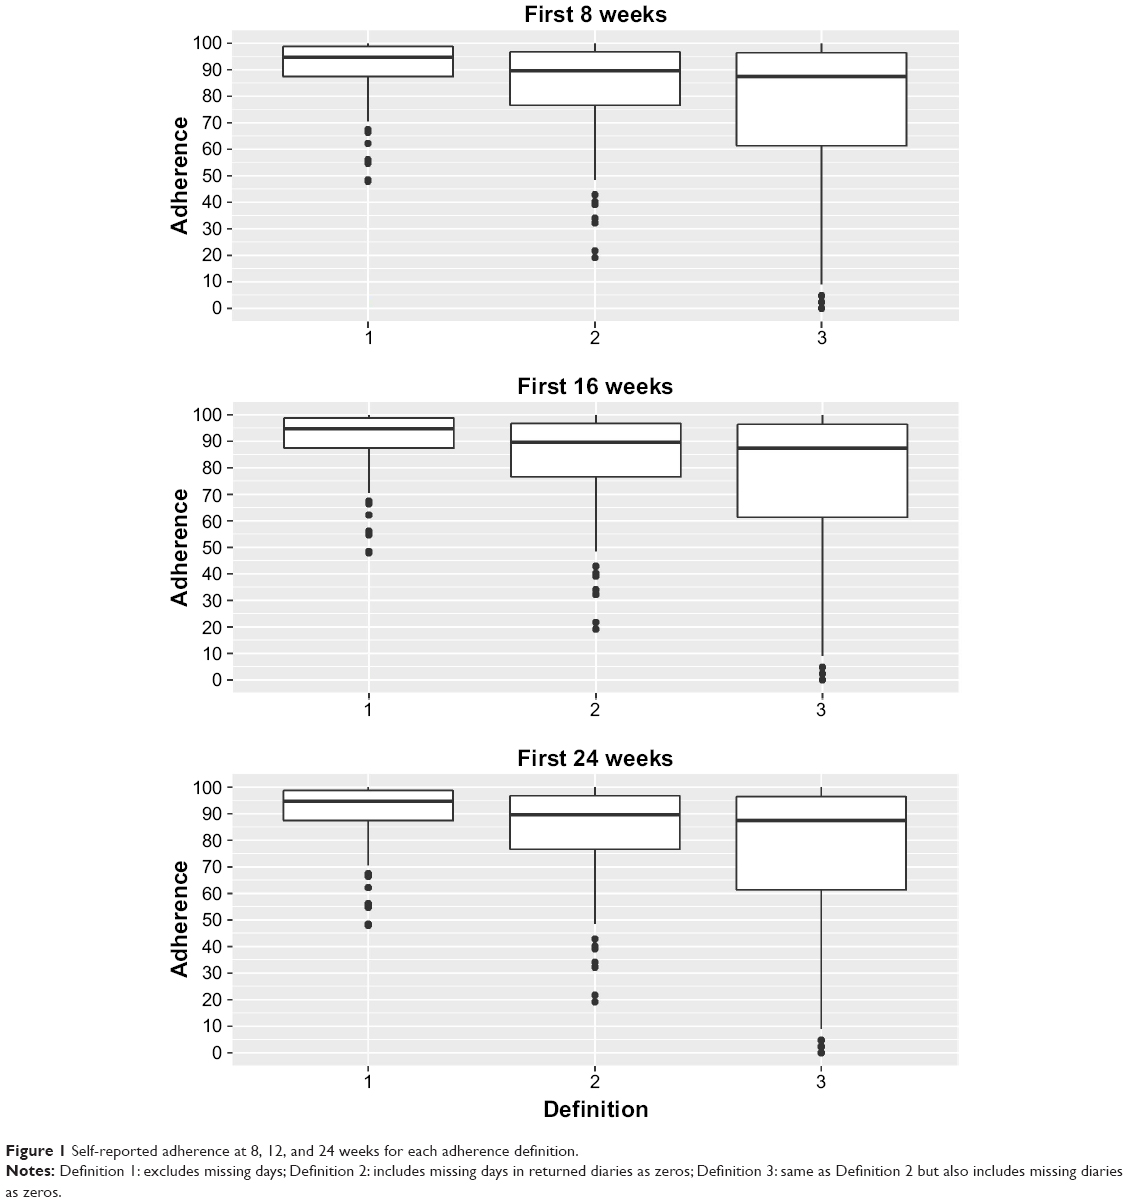 | Figure 1 Self-reported adherence at 8, 12, and 24 weeks for each adherence definition. |
Biomarker assessments
In women with pre- and post-blood measures, mean (SD) alpha-tocopherol levels increased from 14.1 μg/mL (8.8) at baseline to 24.1 μg/mL (15.3) at 8 weeks. Mean levels were 24.8 μg/mL (15.4) and 22.6 μg/mL (13.6) at 16 and 24 weeks, respectively. Distributions for the change in alpha-tocopherol from baseline to 8, 16, and 24 weeks are shown in Figure 2. While mean levels of alpha-tocopherol increased by ~75%, not all women had increased levels. Of the 152 women with baseline and 8-week alpha-tocopherol measures, 20 (13%) actually had a decrease in their alpha-tocopherol levels.
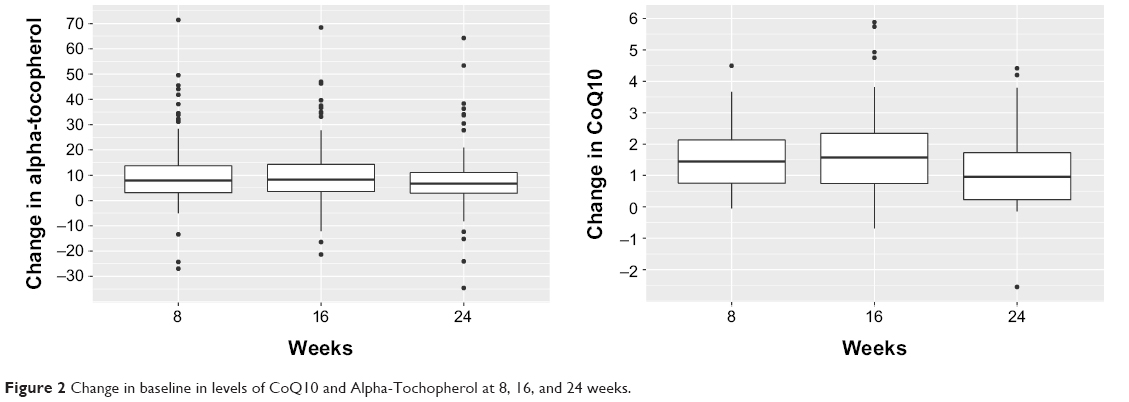 | Figure 2 Change in baseline in levels of CoQ10 and Alpha-Tochopherol at 8, 16, and 24 weeks. |
In women randomized to the intervention arm who had both pre- and post-assessments, mean (SD) CoQ10 levels increased from 0.71 μg/mL (0.39) at baseline to 2.25 μg/mL (1.15) at 8 weeks. Mean levels were 2.43 μg/mL (1.42) and 1.84 μg/mL (1.09) at 16 and 24 weeks, respectively. Distributions for the change in CoQ10 from baseline to 8, 16, and 24 weeks are shown in Figure 2. Most of the women in the intervention arm had increased levels of CoQ10 by 8 weeks. Of the 76 women with baseline and 8-week CoQ10 levels, only 2 (3%) had a decrease in CoQ10 level while 83% had increases of 0.5 μg/mL or greater. Only 3% of the women in the control (Vitamin E) arm had increases in CoQ10 of 0.5 μg/mL or greater.
Scatterplots of the change in CoQ10 by the change in alpha-tocopherol for the intervention participants at 8, 16, and 24 weeks are shown in Figure 3. In general, there is a moderate positive relationship between changes in the 2 biomarkers (correlations between 0.40 and 0.48, all p-values <0.001). Of note, there were several women in the intervention arm who had increased levels of alpha-tocopherol without corresponding increases in CoQ10 and several women who had increased CoQ10 levels without an increase in alpha-tocopherol.
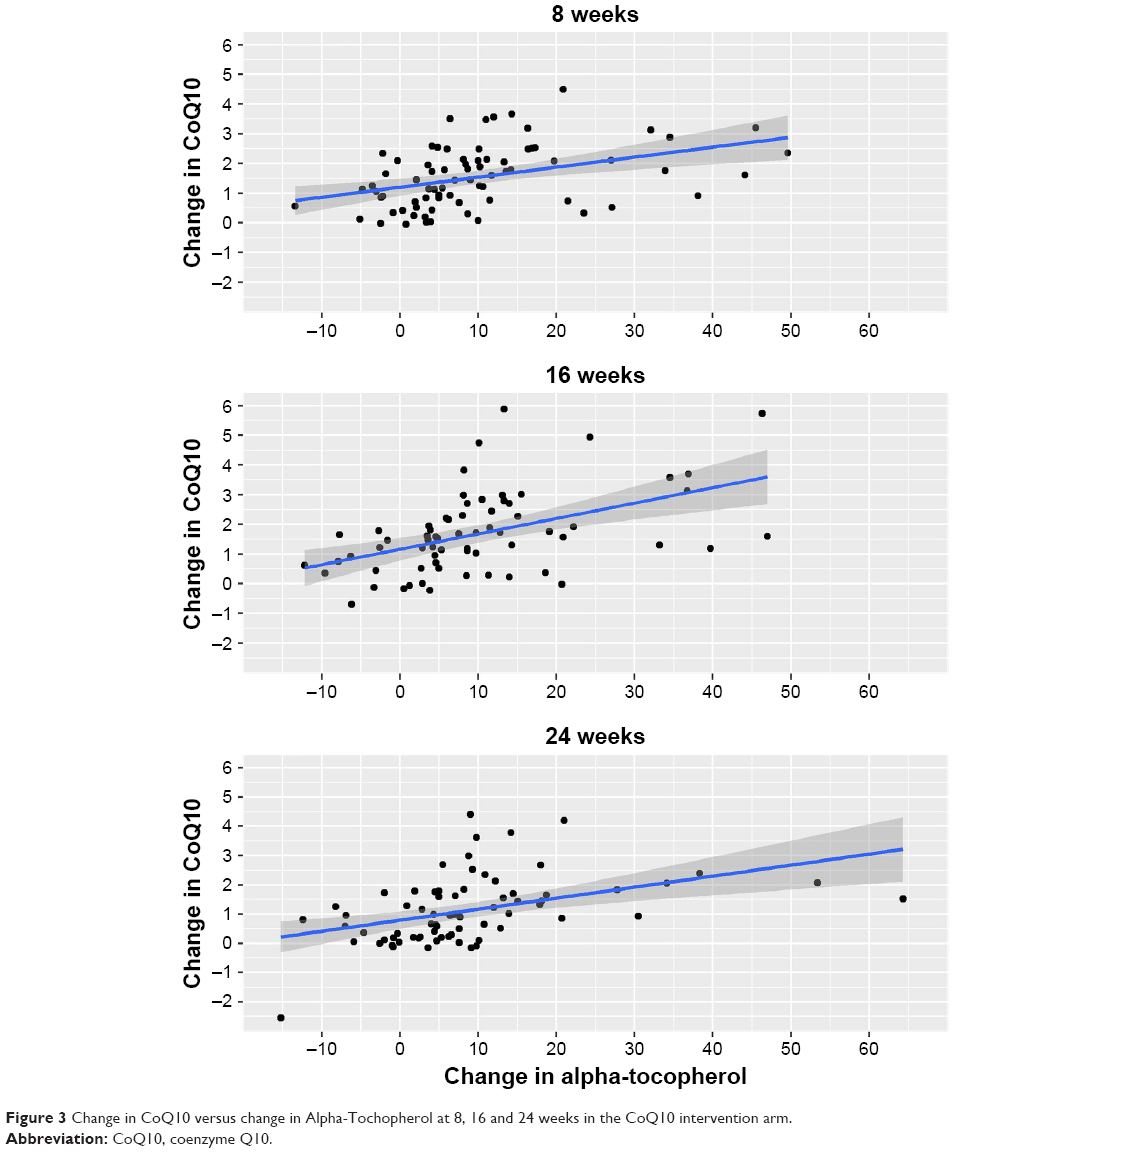 | Figure 3 Change in CoQ10 versus change in Alpha-Tochopherol at 8, 16 and 24 weeks in the CoQ10 intervention arm. |
Association between self-reported and biomarker adherence
Pearson and Spearman correlations are provided in Table 3A. These correlations are very similar, so we focus on the Pearson correlations. In general, there was a modest positive association between the measures of adherence and the changes in biomarker levels. The correlations are strongest over the first 8 weeks. The association between self-reported adherence and biomarker changes becomes much weaker over 16 and 24 weeks. Over 8 weeks, the correlation between self-reported adherence and the change in alpha-tocopherol ranges from 0.21 to 0.28, while the correlation between self-reported adherence and the change in CoQ10 ranges from 0.26 to 0.40 (all p-values <0.05). The corresponding correlations were moderate to weak over longer time periods. Pearson correlations between biomarker changes and self-reported adherence for the 1- and 2-week period prior to a study visit are shown in Table 3B. The correlations tend to be slightly lower when using the 1-week period before the study visit and slightly higher when using the 2-week period prior to the study visit. However, correlations using the 2-week period are not consistently higher than those using the entire period and the increases are marginal at best.
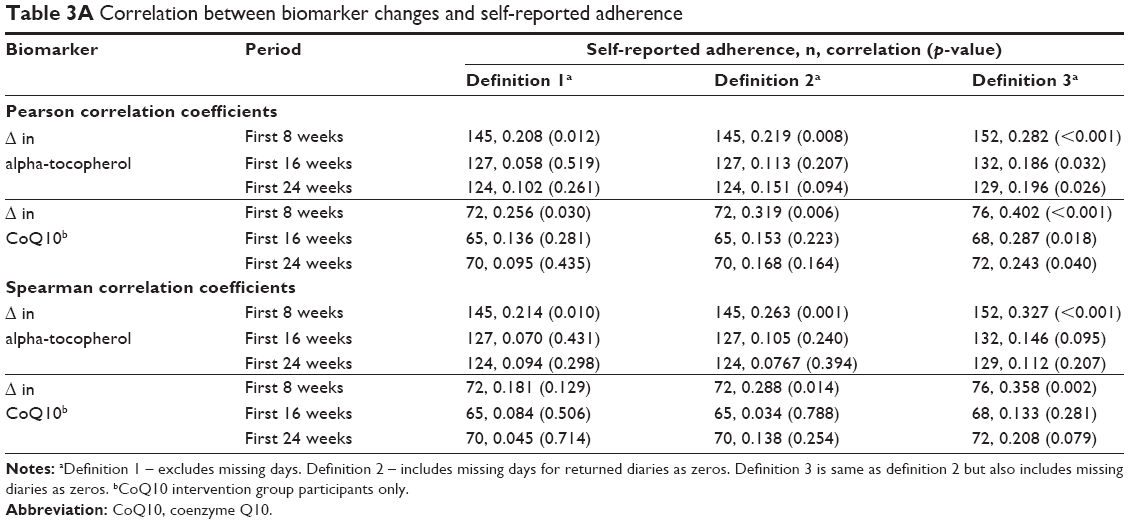 | Table 3A Correlation between biomarker changes and self-reported adherence |
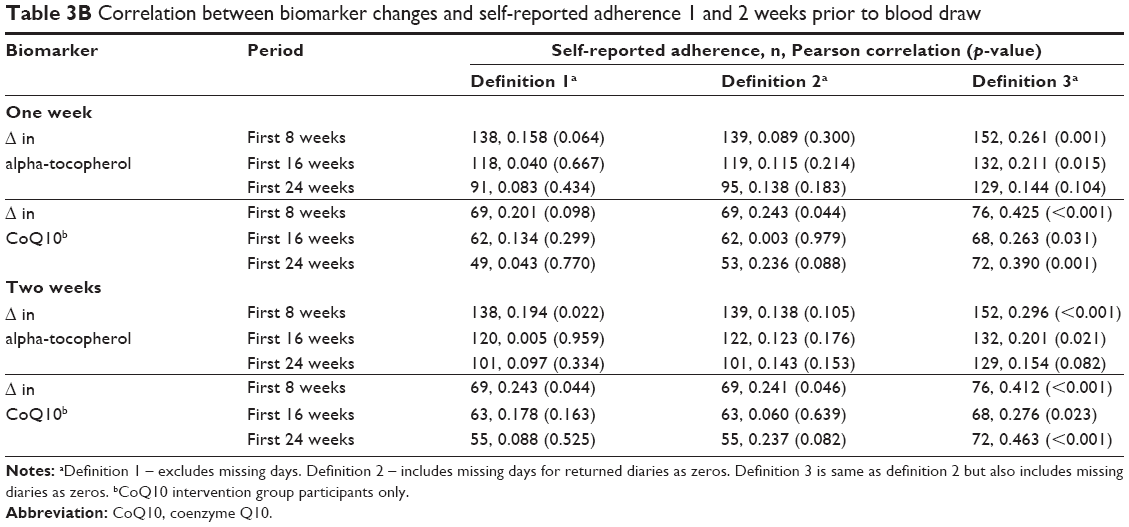 | Table 3B Correlation between biomarker changes and self-reported adherence 1 and 2 weeks prior to blood draw |
Participants were categorized into low (≤60%), intermediate (60%–90%), and high (>90%) adherence based on the third definition adherence. Mean (SD) levels of the biomarker changes are presented in Table 4 by adherence level at 8, 16, and 24 weeks. Changes in both biomarkers were greater for women who reported greater adherence (Figure 4). However, not all women with high self-reported adherence experienced increases in alpha-tocopherol or CoQ10.
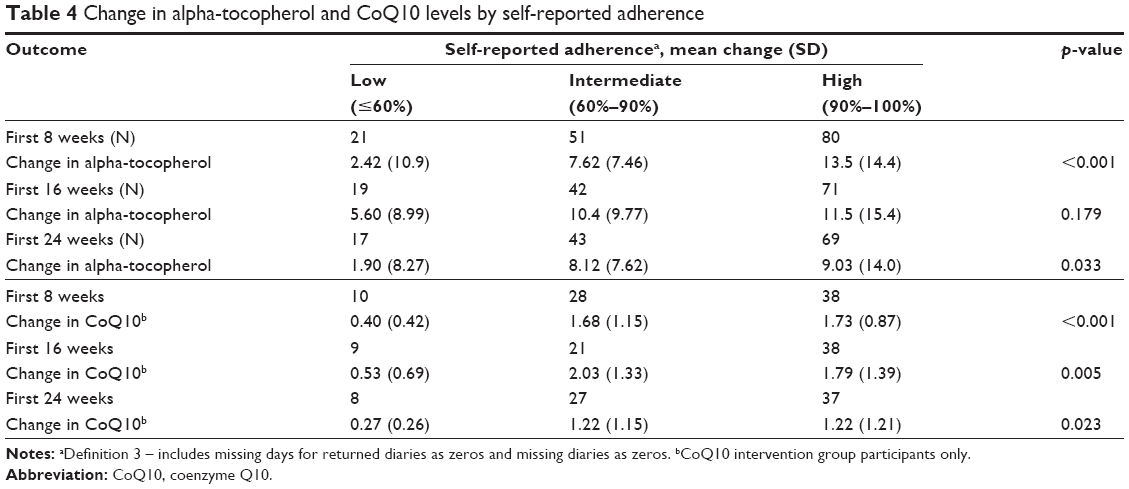 | Table 4 Change in alpha-tocopherol and CoQ10 levels by self-reported adherence |
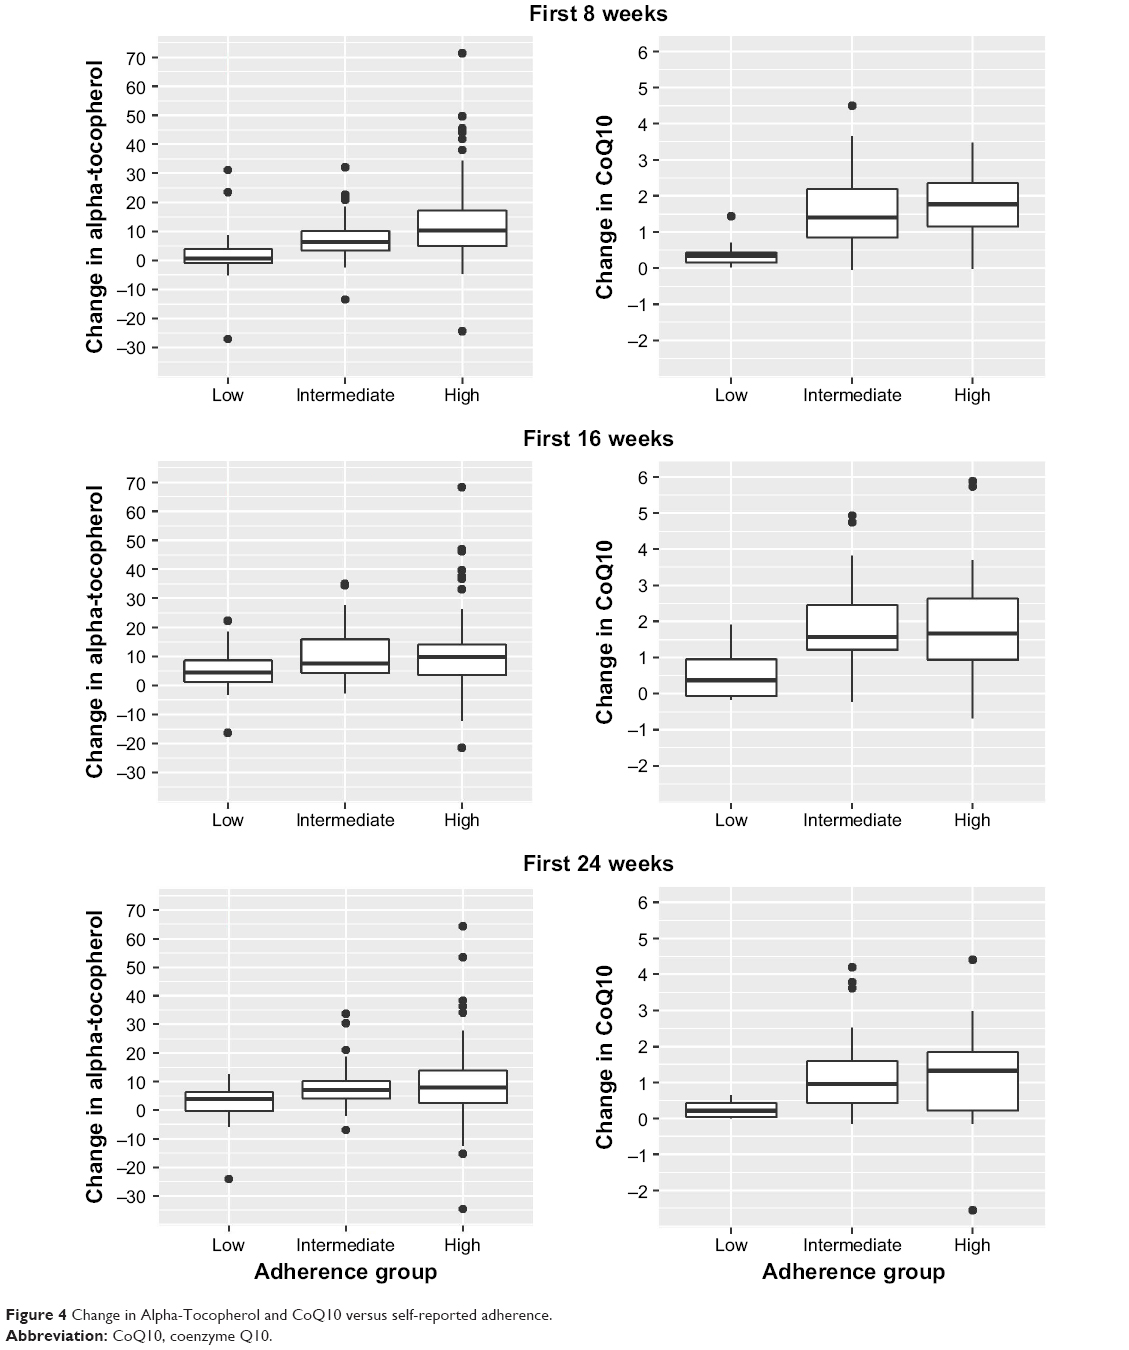 | Figure 4 Change in Alpha-Tocopherol and CoQ10 versus self-reported adherence. |
Discussion
In this secondary data analysis, we found a modest positive association between self-reported adherence (pills taken) and biomarkers (change in alpha-tocopherol and CoQ10 levels). The association became weaker over the course of the study period illustrating the need for continual monitoring and ongoing participant encouragement to enhance ingestion of the study pills. There were more participants with high self-reported adherence and zero to little increase in biomarker levels than there were participants with low self-reported adherence and large increases in biomarker levels. This supports previous reports that participants overestimate adherence to study-related regimens.4,6,7
CoQ10 levels normally range between 0.64 and 1.06 μg/mL in plasma and the elimination half-life of CoQ10 is ~33 h.13,14 The reference range for alpha-tocopherol in adults is between 5.5 and 17 μg/mL in plasma and the elimination half-life of alpha-tocopherol has been reported to be ~44 h.15,16 We recognized that the CoQ10 and the Vitamin E supplements would not be perfectly reflected in the participants’ plasma as most circulating fatty acids are not exclusively from dietary sources and that circulating fatty acids reflect complex fatty acid metabolism and de novo lipogenesis.17,18 Even so, we provided doses of CoQ10 and Vitamin E to allow for plasma changes to be large enough to generally identify those who took the pills compared with those who did not.
Interestingly, we found that most of the participants who did not provide baseline blood samples dropped out of the main trial early; willingness to have a blood draw turned out to be a good predictor of participants who remained in the trial. In addition, participants who did not have their blood drawn also provided very little adherence diary data.
This paper demonstrates that the way in which missing data are analyzed can make a dramatic difference in the actual estimate of adherence. Considering missing data as “no pills taken” for those diaries that were returned is probably a fair, if somewhat conservative, approach. Treating all missing diaries as 0% adherence is probably too conservative as there were some women who failed to return diaries but exhibited increases in the alpha-tocopherol and/or CoQ10 levels.
Limitations
For this investigation, we took advantage of data collected in a previously conducted clinical trial. Measuring adherence to the study treatments was not the primary outcome of that trial and blood and diaries were not collected from all participants; therefore, these results should be interpreted with these limitations in mind. This secondary analysis was conducted using data collected in a very specific population of women who may not have been as motivated to take the study supplements. These participants may have been more motivated to adhere had the study pills been known to affect mortality and morbidity, not just fatigue. This limits the generalizability of our findings. Selecting an appropriate and robust measure of adherence is a key aspect of research and for the main study, the self-report diary was selected prior to the conduct of the study as the primary assessment of adherence. The study team recognized the advantages of using self-report diaries in that they are completed daily thereby requiring a limited amount of recall, are inexpensive, simple to administer, and have been found to have higher agreement with clinical measures than interviews.19 However, this analysis shows that participants over-estimated their adherence using the self-report diary, which may reduce enthusiasm for their use in future studies and should be considered a limitation in this study. The blood samples were taken following an 8-h fast, however, participants were not queried about when they last consumed their study pills. This limits our ability to correlate levels to the consumption of the study pills. Finally, it may be difficult to extrapolate the biomarker results of this trial due to a variety of individual variations, including the use of medications, alcohol consumption, and tobacco use and is a limitation of this study.20
Conclusion
Overall, the findings reported here support that self-reported adherence is likely to be overestimated. In addition, we showed that how adherence is defined makes a difference in the assessment of adherence. It is clear that stable and reliable biological and other objective measures of adherence that can better identify true adherence to study pills provided in clinical trials are greatly needed. Unfortunately, all current methods of assessing adherence have problems that make them <100% reliable. New digital technologies for better pill-tracking adherence are on the horizon and include pill bottles with companion mobile phone applications. Recently, a device was developed that tracks pills using sensor-embedded labels. Advances in technology and the ongoing work to identify ways to account for error in self-report, and identify reliable biomarker assays to assess adherence have the potential to greatly assist in improving the interpretation of findings of future clinical trials and should be vigorously pursued.
Acknowledgments
This trial was supported by the National Cancer Institute Division of Cancer Prevention Grant U10 CA81851 to the Wake Forest CCOP Research Base; National Clinical Trials Registration No. NCT00096356. We would like to thank the following research base staff (Robin Rosdhal, RN; June Fletcher-Steede, BS, RT; Rhonda Kimball; Cissy Yates, MT), and laboratory technician (Mark Morris).
Disclosure
The authors report no conflicts of interest in this work.
References
Dunbar-Jacob JM, Schlenk EA, Burke LE, Matthews JT. Predictors of patient adherence: patient characteristics. In Schumaker SA, Schron EB, Ockene JK, McBee WL, editors. The Handbook of Health Behavior Change. 2nd ed. New York, NY: Springer; 1998:491–511. | ||
Friedman LM, Furberg CD, DeMets DL. Fundamentals of Clinical Trials. 4th ed. New York, NY: SpringerVerlag; 2010. | ||
Lasagna L, Hutt PB. Health care, research and regulatory impact of noncompliance. In: Cramer JA, Spilker B, editors. Patient Compliance in Medical Practice and Clinical Trials. New York, NY: Raven Press; 1991:393–403. | ||
Burney KD, Krishnan K, Ruffin MT, Zhan D, Brenner DE. Adherence to single daily dose of aspirin in a chemoprevention trial: an evaluation of self-report and micro-electronic monitory. Arch Fam Med. 2009;5(5):297–300. | ||
Cramer JA. Patient compliance in medical practice and clinical trials. In: Cramer JA, Spilker B, editors. Patient Compliance in Medical Practice and Clinical Trials. New York, NY, USA: Raven Press; 1991:3–10. | ||
Urquhart J. Role of patient compliance in clinical pharmacokinetics. A review of recent research. Clin Pharmacokinet. 1994;27(3):202–215. | ||
Waterhouse DM, Calzone KA, Mele C, Brenner DE. Adherence to oral tamoxifen: a comparison of patient self-report, pill counts, and microelectronic monitoring. J Clin Oncol. 1993;11(6):1189–1197. | ||
Farmer KC. Methods for measuring and monitoring medication regimen adherence in clinical trials and clinical practice. Clin Ther. 1999;21(6):1074–1090. | ||
Shiovitz TM, Bain EE, McCann DJ, et al. Mitigating the effects of nonadherence in clinical trials. J Clin Pharmacol. 2016;56(9):1151–1164. | ||
Lesser GL, Case D, Stark N, et al. A Randomized double-blind, placebo-controlled study of oral coenzyme q10 to relieve self-reported treatment related fatigue in newly diagnosed patients with breast cancer. J Support Oncol. 2013;11(1):31–42. | ||
Kaikkonen J, Nyyssönen K, Salonen JT. Measurement and stability of plasma reduced, oxidized and total coenzyme Q10 in humans. Scand J Clin Lab Invest. 1999;5:457–466. | ||
Hess D, Keller HE, Oberlin B, Bonfanti R, Schüep W. Simultaneous determination of retinol, tocopherols, carotenes and lycopene in plasma by means of high-performance liquid chromatography on reversed phase. Int J Vitam Nutr Res. 1991;61(3):232–238. | ||
Bhagavan HN, Chopra RK. Coenzyme Q10: absorption, tissue uptake, metabolism and pharmacokinetics. Free Radic Res. 2006;40(5):445–453. | ||
Pepping J. Coenzyme Q10. Am J Health Syst Pharm. 1999;56(6):519–521. | ||
Cohn W. Bioavailability of vitamin E. Eur J Clin Nutr. 1997;51:S80–S85. | ||
Kayden HJ, Traber MG. Absorption, lipoprotein transport, and regulation of plasma concentrations of vitamin E in humans. J Lipid Res. 1993;34(3):343–358. | ||
Hodson L, Eyles HC, McLachlan KJ, Bell ML, Green TJ, Skeaff CM. Plasma and erythrocyte fatty acids reflect intakes of saturated and n–6 PUFA within a similar time frame. J Nutr. 2014;144(1):33–41. | ||
King IB, Lemaitre RN, Kestin M. Effect of a low-fat diet on fatty acid composition in red cells, plasma phospholipids, and cholesterol esters: investigation of a biomarker of total fat intake. Am J Clin Nutr. 2006;83(2):227–236. | ||
Garber MC, Nau DP, Erickson SR, Aikens JE, Lawrence JB. The concordance of self-report with other measures of medication adherence: a summary of the literature. Med Care. 2004;42:649–652. | ||
Kaikkonen J, Tuomainen T, Nyyssönen K, Salonen JT. Coenzyme Q10: absorption, antioxidative properties, determinants, and plasma levels. Free Radic Res. 2002;36(4):389–397. |
 © 2018 The Author(s). This work is published and licensed by Dove Medical Press Limited. The full terms of this license are available at https://www.dovepress.com/terms.php and incorporate the Creative Commons Attribution - Non Commercial (unported, v3.0) License.
By accessing the work you hereby accept the Terms. Non-commercial uses of the work are permitted without any further permission from Dove Medical Press Limited, provided the work is properly attributed. For permission for commercial use of this work, please see paragraphs 4.2 and 5 of our Terms.
© 2018 The Author(s). This work is published and licensed by Dove Medical Press Limited. The full terms of this license are available at https://www.dovepress.com/terms.php and incorporate the Creative Commons Attribution - Non Commercial (unported, v3.0) License.
By accessing the work you hereby accept the Terms. Non-commercial uses of the work are permitted without any further permission from Dove Medical Press Limited, provided the work is properly attributed. For permission for commercial use of this work, please see paragraphs 4.2 and 5 of our Terms.