Back to Journals » International Journal of Nanomedicine » Volume 18
Self-Assembled nanoparticles Combining Berberine and Sodium Taurocholate for Enhanced Anti-Hyperuricemia Effect
Authors Qin Z, Li M, Cheng J, Huang Z, Ai G, Qu C, Xie Y, Li Y, Liao H, Xie J, Su Z
Received 10 March 2023
Accepted for publication 19 July 2023
Published 26 July 2023 Volume 2023:18 Pages 4101—4120
DOI https://doi.org/10.2147/IJN.S409513
Checked for plagiarism Yes
Review by Single anonymous peer review
Peer reviewer comments 2
Editor who approved publication: Dr Mian Wang
Zehui Qin,1 Minhua Li,1,2 Juanjuan Cheng,1,2 Ziwei Huang,1,2 Gaoxiang Ai,1,2 Chang Qu,3 Youliang Xie,1 Yucui Li,1 Huijun Liao,4 Jianhui Xie,5– 7 Ziren Su1,2
1School of Pharmaceutical Sciences, Guangzhou University of Chinese Medicine, Guangzhou, 510006, People’s Republic of China; 2Dongguan Institute of Guangzhou University of Chinese Medicine, Dongguan, 523808, People’s Republic of China; 3College of Forestry and Landscape Architecture, South China Agricultural University, Guangzhou, 510006, People’s Republic of China; 4Department of Clinical Pharmacy and Pharmaceutical Services, Huazhong University of Science and Technology Union Shenzhen Hospital (the 6th affiliated Hospital of Shenzhen University), Shenzhen, People’s Republic of China; 5The Second Affiliated Hospital of Guangzhou University of Chinese Medicine, Guangzhou, People’s Republic of China; 6State Key Laboratory of Dampness Syndrome of Chinese Medicine, The Second Affiliated Hospital of Guangzhou University of Chinese Medicine, Guangzhou, People’s Republic of China; 7Guangdong Provincial Key Laboratory of Clinical Research on Traditional Chinese Medicine Syndrome, Guangzhou, People’s Republic of China
Correspondence: Ziren Su, School of Pharmaceutical Sciences, Guangzhou University of Chinese Medicine, Guangzhou, 510006, PR China, Dongguan Institute of Guangzhou University of Chinese Medicine, Dongguan, 523808, People’s Republic of China, Email [email protected] Huijun Liao, Department of Clinical Pharmacy and Pharmaceutical Services, Huazhong University of Science and Technology Union Shenzhen Hospital (the 6th affiliated hospital of Shenzhen University), Shenzhen, People’s Republic of China, Email [email protected]
Propose: Berberine (BBR) is extensively studied as an outstanding anti-hyperuricemia drug. However, the clinical application of BBR was limited due to its poor absorption and low bioavailability. Therefore, there is an urgent necessity to find a novel drug formulation to address the issues of BBR in clinical application.
Methods: Herein, we conducted the solubility, characterization experiments to verify whether BBR and sodium taurocholate (STC) self-assembled nanoparticles (STC@BBR-SANPs) could form. Furthermore, we proceeded the release experiment in vitro and in vivo to investigate the drug release effect. Finally, we explored the therapeutic effect of STC@BBR-SANPs on hyperuricemia (HUA) through morphological observation of organs and measurement of related indicators.
Results: The solubility, particle size, scanning electron microscopy (SEM), and stability studies showed that the stable STC@BBR-SANPs could be formed in the BBR-STC system at ratio of 1:4. Meanwhile, the tissue distribution experiments revealed that the STC@BBR-SANPs could accelerate the absorption and distribution of BBR. In addition, the pharmacology study demonstrated that both BBR and STC@BBR-SANPs exhibited favorable anti-HUA effects and nephroprotective effects, while STC@BBR-SANPs showed better therapeutic action than that of BBR.
Conclusion: This work indicated that STC@BBR-SANPs can be self-assembly formed, and exerts excellent uric acid-lowering effect. STC@BBR-SANPs can help to solve the problems of poor solubility and low absorption rate of BBR in clinical use, and provide a new perspective for the future development of BBR.
Keywords: berberine, sodium taurocholate, intermolecular interactions, self-assembled, nanoparticles, hyperuricemia
Graphical Abstract:

Introduction
Berberine (BBR, Figure 1A) is an eminent component of traditional Chinese and Ayurvedic medicine for more than 2000 years.1 It has been broadly investigated in recent years because of its wide clinical application, multiple therapeutic effects2 (including anti-inflammatory, anti-cancer, anti-cardiovascular disease, hypo-uric acid, etc.) as well as low toxicity.3 However, the efficacy of BBR is largely affected by its poor solubility, low intestinal absorption and rapid first-pass metabolism, and its oral bioavailability is even less than 1%.3 Therefore, researchers have been devoted to develop formulations using various excipients to increase the bioavailability of BBR by complexation, encapsulation and emulsification, such as chitosan, PEG/PLGA, sodium deoxycholate.4
 |
Figure 1 The chemical structure of (A) BBR and (B) STC. (C) Schematic diagram of self-assembled structure of BBR and STC. |
Synthetic bile acids (including primary bile acids and secondary bile acids) are the products of cholesterol synthesis in the liver. 95% of the bile acids secreted into the small intestine are effectively reabsorbed in the distal ileum and returned to the liver via the portal vein, a circulatory system known as the “enterohepatic circulation”.5 The remaining 5% is secondary bile acids, which undergo complex metabolic reactions and are absorbed into the hepatic and intestinal circulation or excreted in the feces.6 Importantly, sodium taurocholate (STC) is a major component of primary bile acid metabolites, and it is an endogenous product of taurine and bile acids.7,8 As shown in Figure 1B, STC is an amphiphilic molecule with a hydrophobic side (β-surface) and a hydrophilic side (α-surface).9 This amphiphilic structure contributes to its emulsifier property. It is crucial for solubilizing lipids in micelles, promoting of emulsification and absorption of dietary lipids and fat-soluble vitamins.
Self-assembly refers to the process of forming multiple ordered aggregates of building blocks (eg, molecules, ions, etc.) under certain conditions through interactions such as electrostatic gravity, hydrogen bonding, ligand bonding, and molecular recognition.10 Self-assembly behavior is extensively found by nature, which means that using natural biomass as reactants or constructions could build functional nanostructures.11 The self-assembled nanomedicines just required simple synthesis and possessed high drug-loading contents as they could achieve highly stable delivery of drugs without any carrier.12 It has been shown that the positive charge of BBR tends to bind to negatively charged substances in a stable state,13 and that bile acid salts can self-assemble with organic amine molecules to form stable nanotube-like structures.14 These studies have inspired our hypothesis of self-assembly of alkaloids and human bile acid compounds.
Hyperuricemia (HUA) is a common metabolic disease in Europe and the United States, affecting more than 20% of the general population. In 2020, the prevalence of HUA in mainland China was 17.4%.15 It is a disease in which serum uric acid (SUA) levels are abnormally high (>7.0 mg/dL) caused by excessive uric acid (UA) production or impaired UA excretion.16–19 UA is produced in the liver by the key enzyme xanthine oxidase (XOD) and excreted through the kidney and intestines.20,21 Meanwhile, adenosine deaminase (ADA) produces hypoxanthine (HX) and xanthine in UA metabolism.22 HUA can lead to kidney damage, such as apparent morphological changes in the kidney or microscopic morphological changes after H&E staining.23,24 HUA also results in an inflammatory response and triggers the secretion of associated inflammatory cytokines, of which TNF-α, IL-1β, and IL-6 are most frequently of concern.25 The first-line XOD inhibitor febuxostat (Feb) is commonly used as a routine therapeutic agent for HUA, but patients treated with Feb face higher risk of cardiovascular disease death in a chronic drug accumulation.26 It has become a huge challenge of public health concern worldwide and there is an urgent need to develop safer and more effective drugs for HUA treatment.
This study aimed to investigate the self-assembly behavior of BBR and a biogenic endogenous substance STC and further investigated the ameliorative effect of the substances they formed on HUA. Briefly, the solubility of BBR and STC with different ratios were firstly observed. Subsequently, the 1:4 BBR-STC system was determined to form self-assembled nanoparticles (STC@BBR-SANPs) by evaluating the particle size, flocculation and redispersion experiments and their characterization. Then, STC@BBR-SANPs was characterized by particle size, polydispersity index (PDI), zeta potential (ZP), morphology, and stability. Furthermore, we found that STC@BBR-SANPs had high tissue distribution concentration in vivo and there was reabsorption in liver and intestine. The effective therapeutic property of STC@BBR-SANPs is also observed. Accordingly, this study proposes the hypothesis of self-assembly behavior of BBR and STC and investigates the uric acid-lowering effect of self-assembled substances, which provides a new direction for the development of future uric acid-lowering drugs.
Materials and Methods
Chemical and Reagents
Deionized water (DW) was obtained from a Millipore Milli-Q Academic water purification system (Millipore, Bedford, MA, USA). BBR (purity ≥98%) was obtained from Meilun Biotechnology Co., Ltd. (Dalian, China). STC (purity ≥98%), potassium oxonate (PO, purity ≥98%) and HX (purity ≥98%) were purchased from Macklin Biochemical Technology Co., Ltd. (Shanghai, China). Feb (purity ≥98%) and piperine (purity ≥98%) were supplied by Yuan-Ye Biotechnology Co., Ltd. (Shanghai, China). HPLC-grade acetonitrile and methanol were purchased from Guangzhou Lubex Biological Technology Co., Ltd. (Guangzhou, China). All other ingredients, reagents, and solvents were of analytical grade.
The assay kits for uric acid (UA), blood urea nitrogen (BUN), creatinine (CRE), XOD and ADA were purchased from Nanjing Jiancheng Biotechnology Institute (Nanjing, China). Enzyme-linked immunosorbent commercial cytokine assay kits for TNF-α, IL-1β and IL-6 in mice were acquired from Shanghai Chengshao Biotech Co., Ltd. (Shanghai, China). Desktop micro high-speed frozen centrifuge was supplied from Hunan Xiangli Scientific Instruments Co. (Hunan, China). High-speed tissue grinder was purchased from Wuhan Servicebio technology Co. Ltd. (Wuhan, China) and HPLC with Alltech C18 column (250 mm × 4.6 mm, 5 μm) was supplied from Shimadzu (Kyoto, Japan).
Animals
Eight-week-old KM mice (male, 18–20 g) were obtained from the Laboratory Animal Center of Guangzhou University of Chinese Medicine (Guangzhou, China). All the mice were kept 7 days in the animal house under standard laboratory conditions with temperature of 25–28°C and humidity of 60–65%, with an artificial lighting of 12 h light/dark cycle for acclimatization. Animals were fasted for 12 h before execution. The study was approved by the Ethics Review Committee for Experimental Animal Center of Guangzhou University of Chinese Medicine (Ethic No. 20220705004). All experimental proceedings were conducted in compliance with the principles of Guangzhou University of Chinese Medicine guidelines and regulations.
Preparation of BBR-STC Systems
The BBR-STC system sample preparation was performed using a modified hydrothermal method.27 Briefly, STC was put into a high-pressure vessel containing 20 mL DW and stirred (300 rpm, 25°C) with a laboratory stirrer (Corning, USA.) for 30 min until dissolved entirely. Then, 5 mg/mL BBR was added to STC solution and stirred (500 rpm, 25°C) for 2 h. The mixture was further stirred (500 rpm, 60°C) for 2 h until yellow clear solution was obtained. The rotary evaporator (Eyela, Japan) was applied for 30 min to evaporate solvent under reduced pressure and to collect solid subsequently.
To determine the optimal ratio of BBR and STC, the solutions at 1:0, 1:1, 1:2, 1:4, 1:6 and 1:8 mole ratios were prepared. The dosages of BBR and STC are shown in Table 1.
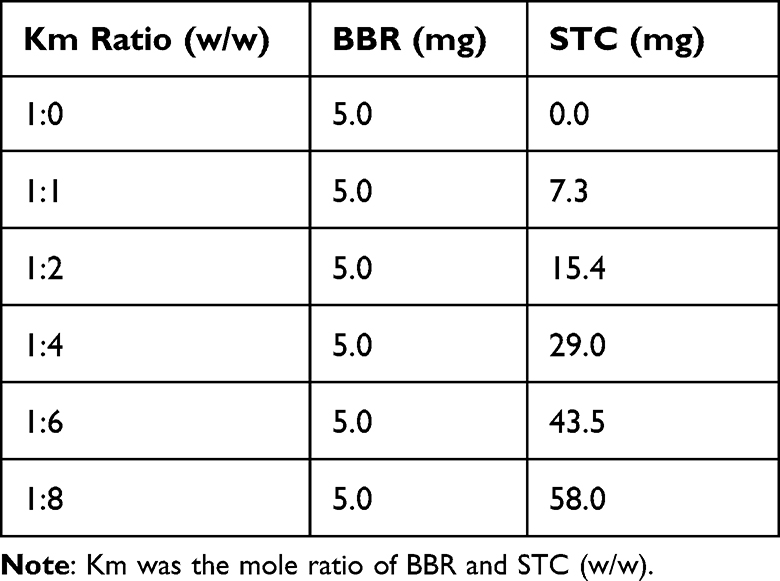 |
Table 1 Dosages of Different Km Ratio in BBR-STC Systems |
Determination of BBR-STC Systems Solubility and Characterization
To determine the solubility of STC@BBR-SANPs in water, 1 mL DW was added to excessive STC@BBR-SANPs in 5 mL Eppendorf tubes to prepare an over-saturated solution. Then, the over-saturated solution was shaken on a Horizontal Shaking Table (Servicebio Co., Ltd., DS-H 200, China) at 90 r/min for 24 h. After that, the over-saturated solution was diluted with DW by 100 times and analyzed by HPLC (Shimadzu HPLC system, Kyoto, Japan) with Alltech C18 column.
In addition, dynamic light scattering reported the particle size and particle size distribution (PSD), PDI, ZP of BBR-STC systems solution by Zetasizer Nano ZS (Malvern Instruments, Malvern, UK) at 25°C.
Determination of the Flocculation and Re-Dispersion of BBR-STC Systems
The modified hydrothermal method was used to prepare different ratios of BBR-STC samples, and the appearance of the freshly prepared samples was photographed and observed. Afterwards, resting for 24 h and 48 h, the samples were photographed and observed again. Finally, the samples were heated at 37°C for 5 min, gently shaken and then photographed and observed.
Characterization of STC@BBR-SANPs
Optimal ratio of BBR-STC system were selected for STC@BBR-SANPs and BBR-STC physical mixture prepared by grinding and blending. The morphology of STC@BBR-SANPs was analyzed by HITACHI SU8010 Scanning Electron Microscope (SEM, Hitachi-Technologies Corp., Tokyo, Japan). The results of X-ray powder diffraction (XRPD) were obtained using XRD diffractometer (Shimadzu XRD-6100, Kyoto, Japan). The Synchrotron radiation-based Fourier transform-infrared spectroscopy (FT-IR) detection spectra were measured by Thermo (Thermo Fisher scientific, Nicolet iS5, USA).
Determination of STC@BBR-SANPs Stability
The stability of STC@BBR-SANPs under extreme conditions including thermodynamic stability, and gravitational stability. To evaluate the gravitational stability, the samples were centrifuged at 6000 and 12,000 rpm for 30 min, respectively. The thermodynamic stability was assessed by exposure to heating and cooling cycles from 20°C to −20°C three times, and then heated at 50°C and cooled at 4°C for 30 min, respectively. Then, particle size and ZP were measured.
To test the pH stability of STC@BBR-SANPs, simulating gastric fluid (SGF, pH 1.2) and simulating intestinal fluid (SIF, pH 6.8) were prepared (according to United States Pharmacopeia, but without the corresponding proteases). Briefly, for SGF, 4.1 mL HCl (9.5%~10.5%) and 2.5 g pepsin were added to 200 mL DW, then the final volume was filled to 250 mL with DW. Also, SIF was prepared by mixing 13.6 mg/mL KH2PO4 solution (pH 6.8) and 5 mg/mL trypsin solution. STC@BBR-SANPs were dissolved in SGF and SIF, respectively, and the particle size and ZP were measured.
Drug Release
Drug release experiment was conducted based on the dynamic dialysis bag method.28 Briefly, 3.8 mg/mL BBR solution, STC@BBR-SANPs solution were loaded in dialysis bag. Then the drug-loaded dialysis bag was disposed in a conical flask, separately. STC@BBR-SANPs solution keeps the same concentration with BBR solution. Afterwards, 20 mL SIF or SGF was added into the above three conical flasks, respectively. The solution in the conical flask was aspirated at 0, 0.083, 0.167, 0.25, 0.5, 1, 2, 4, 6, 8, 12 and 24 h as the drug release assay samples and replenished with the same volume of SIF or SGF into the conical flask to ensure consistency of the assay. Finally, the samples were monitored by HPLC system and time-cumulative release curves under different conditions were drawn.
Acute Toxicity Test
Acute toxicity test according to the acute oral toxicity Chemical-Test method of the National Standard of the People’s Republic of China (GB/T21603-2008) to assess the acute toxicity of the drug after a single oral dose. Briefly, male KM mice and female KM mice were randomly divided into four groups according to sex and body weight: control males (CM, n = 5), control females (CF, n = 5), STC@BBR-SANPs administration males (AM, 2720 mg/kg, n = 5), and STC@BBR-SANPs administration females (AF, 2720 mg/kg, n = 5). After 12 h of fasting, all mice except control mice were orally administered 2720 mg/kg STC@BBR-SANPs. Mice were then observed for symptoms and their mortality was recorded for 14 days. After 14 days, animals were executed and their heart, liver and kidney tissues were collected for toxicological assessment.
Pharmacodynamics Study
According to the preliminary experiment, KM mice were randomly divided into 7 groups (10 mice per group) as follows: control group (normal mice), HUA group (HUA mice), Feb group (5 mg/kg febuxostat; positive control), STC group (290 mg/kg STC; negative control), BBR group (50 mg/kg BBR), STC@BBR-SANPs-L group (preparation of 25 mg/kg BBR and 145 mg/kg STC) and STC@BBR-SANPs-H group (preparation of 50 mg/kg BBR and 290 mg/kg STC). All drugs were suspended in 0.5% sodium carboxymethylcellulose (CMC-Na). PO and HX were given to all groups to induce HAU model as previously reported.20 As shown in Figure 2A and B, the HUA model was modified according to the preliminary experiment.29 Briefly, all mice except control group were treated intraperitoneally (i.p.) with 500 mg/kg PO and orally (P.O.) administrated with 300 mg/kg HX 1 h before drug administration, while mice in control group were administrated with 0.9% physiological saline (i.p.) and 0.5% CMC-Na (P.O.). During the duration of treatment, mice in drug group orally received febuxostat, BBR or STC@BBR-SANPS once daily for 10 days, respectively.
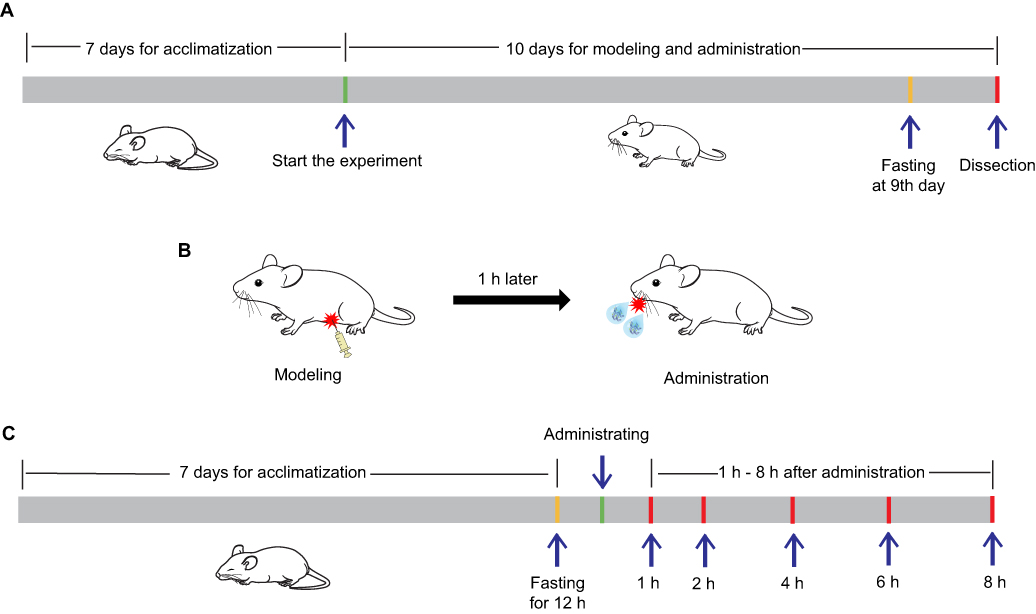 |
Figure 2 (A) Schematic diagram of experimental process of pharmacodynamics study. (B) Mice modeling procedures. (C) Experimental procedures for tissue distribution experiments. |
On day 9, all the mice were fasted overnight. On day 10, mice were anesthetized 1 h after supplemental drug administration. Then, blood samples were collected. After quiescence for 2 h, the blood samples were centrifuged at 3000 rpm for 10 min at 4°C. Then, serum was separated and stored at −80°C for further biochemical assays. Livers and kidneys were excised, rinsed, and weighed promptly. Afterwards, livers were cut into small pieces and mixed with volume of 0.9% physiological saline solution, and homogenized on ice for subsequent assays. Kidney tissues were photographed for the evaluation histopathological morphology and sections were subjected to H&E staining. The kidney histopathology score was evaluated according to previous report.30
Tissue Distribution Study
To investigate the tissue distribution of BBR in vivo, KM mice were randomly and equally divided into two groups: (A) 50 mg/kg BBR group and (B) 340 mg/kg STC@BBR-SANPs group. Blood was collected at 1, 2, 4, 6 and 8 h after drug administration, as depicted in Figure 2C. Then, mice were executed. The heart, liver, spleen, lung, kidney, intestine tissues of the mice were collected, and the tissues were crushed and homogenized. The proteins were subsequently precipitated by acetonitrile protein precipitation, and the BBR content in the tissues was detected by HPLC system.
Biochemical Assays
The level of SUA, CRE, BUN, XOD, ADA, TNF-α, IL-1β and IL-6 were measured by standard kits according to the manufacturer’s directions. To assess toxicity in general, body weights were recorded daily, and organ weights were measured, organ indices were calculated.
Statistical Analysis
Statistical significance was assessed by the SPSS and the Origin Pro 2021 software. All data were expressed as mean ± SD. Differences between multiple groups were compared by one-way analysis of variance (ANOVA) and least significant difference (LSD). P < 0.05 was considered statistically significant.
Results
Effects of STC on the Solubility of BBR Water Dispersions
As shown in Table 2 and Figure 3A, the BBR content in BBR-STC system at different ratios Km (1:0, 1:1, 1:2, 1:4, 1:6, 1:8 for BBR and STC) was analyzed. The dissolution capacity of BBR-STC system was higher than that of BBR in all cases at the same BBR concentration, and the solubility tended to increase with the increase of STC. More specifically, the optimal solubility occurs at Km at 1:4.
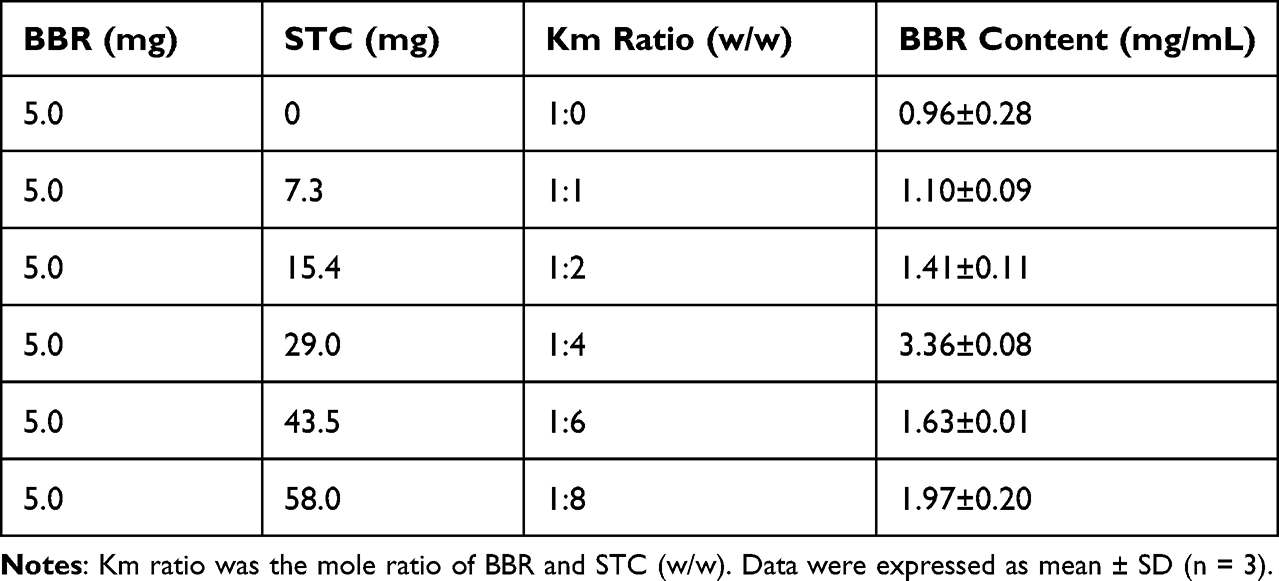 |
Table 2 Effects of STC on the Solubility of BBR Water Dispersions |
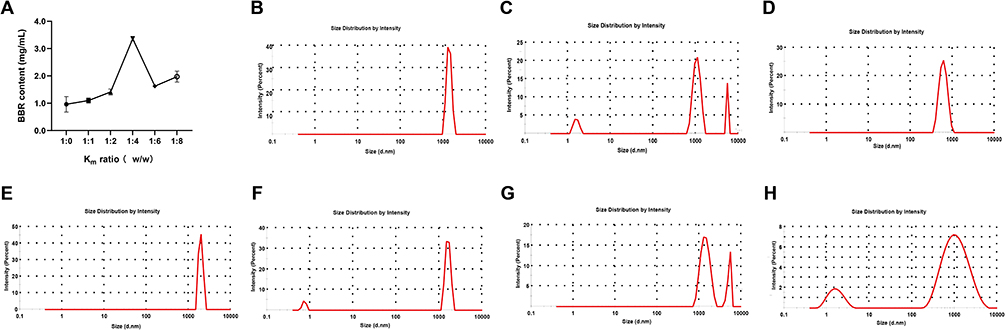 |
Figure 3 (A) Effects of STC on the solubility of BBR water dispersion. Particle size distribution by intensity in Km value of (B) 1:1, (C) 1:2, (D) 1:4, (E) 1:6, (F) 1:8, (G) BBR and (H) STC. |
Effect of STC on the Particle Size of BBR Water Dispersions
In order to explore the solubility of the BBR-STC system at different mole ratio of STC and BBR particle size was examined subsequently. The Z-average, PSD and particle size distribution curves of Km with different mole ratios are presented in Table 3 and Figure 3B–H. When the PDI <0.5, particle size can be assessed by Z-average. When the PDI >0.5, the particle size should be evaluated by highest intensity PSD (PSDm). As shown in Table 3, when Km ratio at 1:4, the PDI was 0.461 and Z-average was 729.7nm. It was also the smallest particle size among all Km ratios and had a more concentrated PDI distribution, which met the condition of nanoparticle formation. Moreover, the particle size was also smaller than the over-saturated solutions of BBR and STC, respectively.
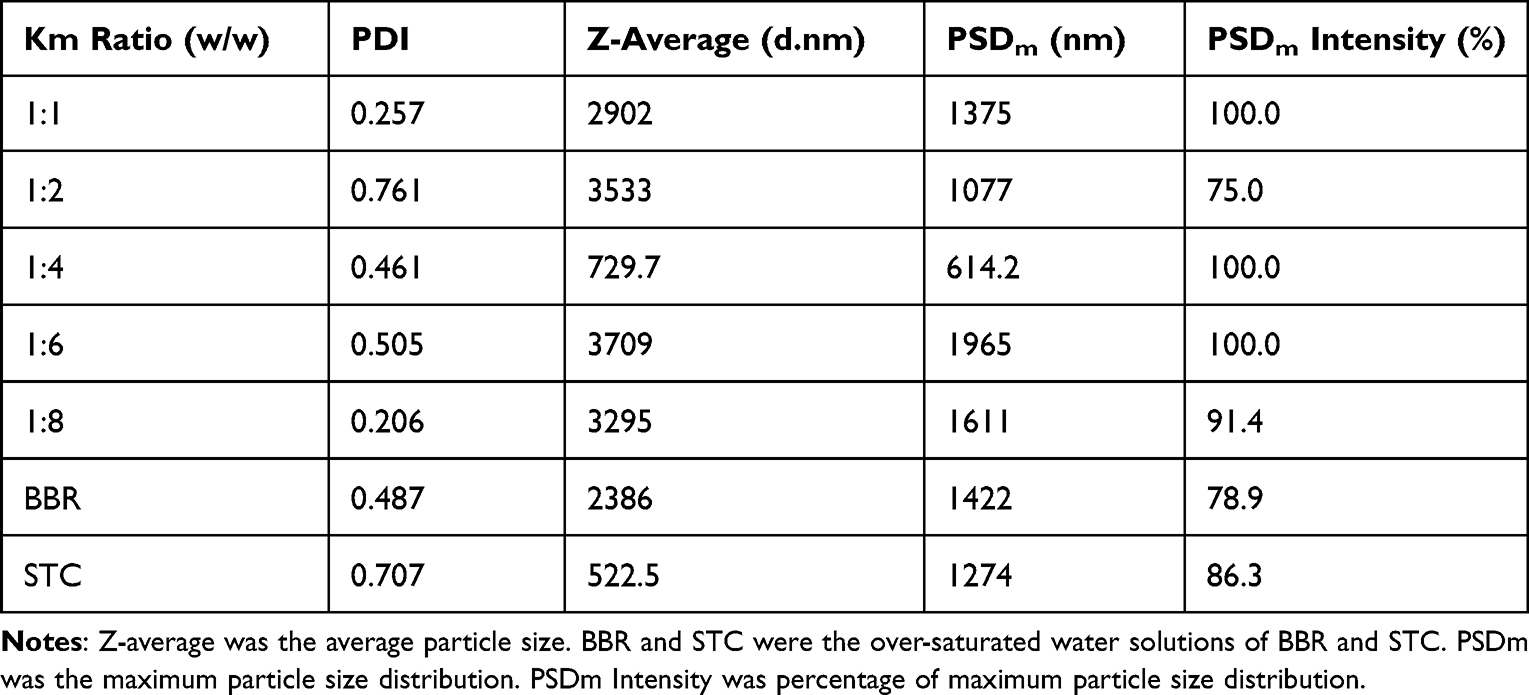 |
Table 3 Effects of STC on the Particle Size of BBR Water Dispersions |
Effect of STC on the Flocculation and Re-Dispersion of BBR-STC Systems
After an investigation on the particle size, the stability of the BBR-STC system under each proportion was studied. As depicted in the Figure 4A, when different proportions of STC were mixed with the same concentration of BBR water dispersion, the samples were prepared as dark yellow solutions. And after 24 h, only BBR-STC system at ratio 1:4 remained clarified state, while the other four ratios showed solid precipitation or turbidity on different degree. After stilling for 48 h, precipitation or crystallization occurred in all groups. White flocculent precipitate appeared in the solution or the bottom at the ratio of 1:4 sample. However, after heating at 37°C for 5 min, the BBR-STC system at ratio 1:4 was completely dissolved, which was more clear than the other ratios. Therefore, it can be concluded that the BBR-STC system at the ratio of 1:4 was optimal, and a follow-up examination of the self-assembled nanoparticles was formed by Km ratio at 1:4 (STC@BBR-SANPs).
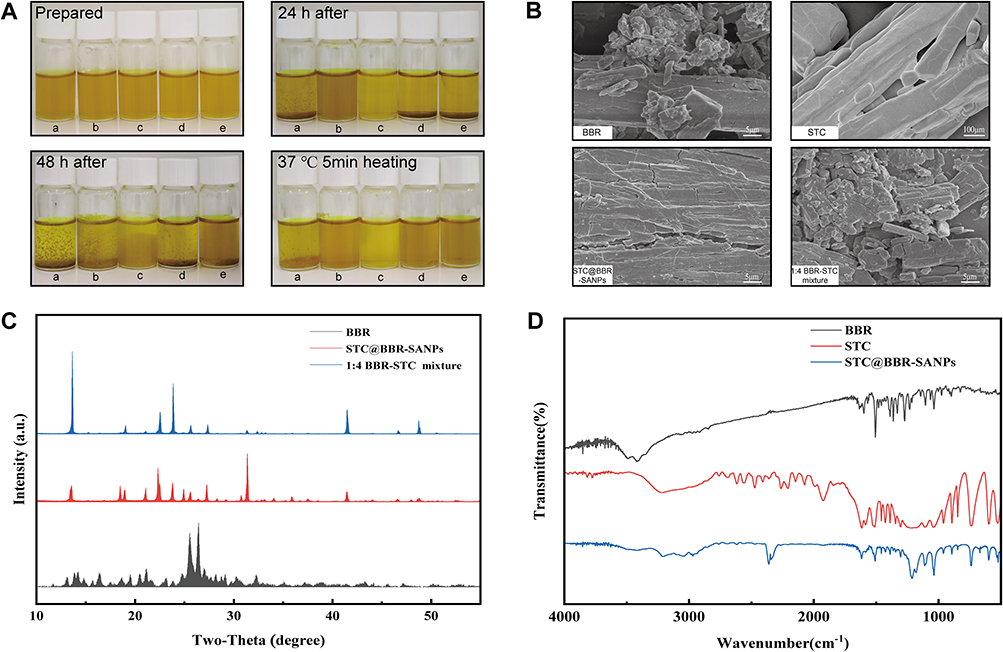 |
Figure 4 (A) Effects of different ratios of BBR-STC systems on flocculation and re-disperse. (a)-(e) represented the 1:1,1:2,1:4,1:6 and 1:8 BBR-STC system, respectively. (B) SEM analysis of BBR, STC, STC@BBR-SANPs and 1:4 BBR-STC physical mixture. (C) XRPD comparison of BBR, STC@BBR-SANPs and 1:4 BBR-STC physical mixture. (D) FT-IR pattern of BBR, STC and STC@BBR-SANPs. |
Characterization of STC@BBR-SANPs
BBR, STC, STC@BBR-SANPs and 1:4 BBR-STC physical mixture morphologies were observed by SEM. As depicted in Figure 4B, the morphology of BBR was mostly powdery and broken flakes occasionally, and STC was crystalline. It can be observed that the morphology of 1:4 BBR-STC physical mixture was mainly incomplete and fragmented. STC@BBR-SANPs exhibited a complete lamellar structure. It can also be observed from the XRPD pattern that the characteristic peak of BBR has decreased in the STC@BBR-SANPs pattern, and it was also different from 1:4 BBR-STC physical mixture and STC patterns (Figure 4C). Moreover, the FT-IR spectrum of STC@BBR-SANPs was considerably different from those of BBR or STC spectrum, proving an extensive interaction between BBR and STC (Figure 4D).
Stability of STC@BBR-SANPs
The screened STC@BBR-SANPs was examined for stability evaluation. As shown in Table 4, the PDI of STC@BBR-SANPs <0.5 and the Z-average is kept below 1000 nm under all conditions. These indicated that the nanostate of STC@BBR-SANPs was stable. The variation of ZP closely reflects the degree of stability of the nanoparticles. Generally, ZP values of nanoparticles above ± 30 mV represent a relatively better stability. Thus, no treatment group kept the most stable status, and STC@BBR-SANPs remained homogeneous after centrifugation, heating, cooling, and freeze-thaw cycles, which indicated a comparatively stable status. In addition, STC@BBR-SANPs remained stable in SGF, but the stability of STC@BBR-SANPs decreased in SIF. It could be suggested that STC@BBR-SANPs may tend to be unstable at pH = 6.8.
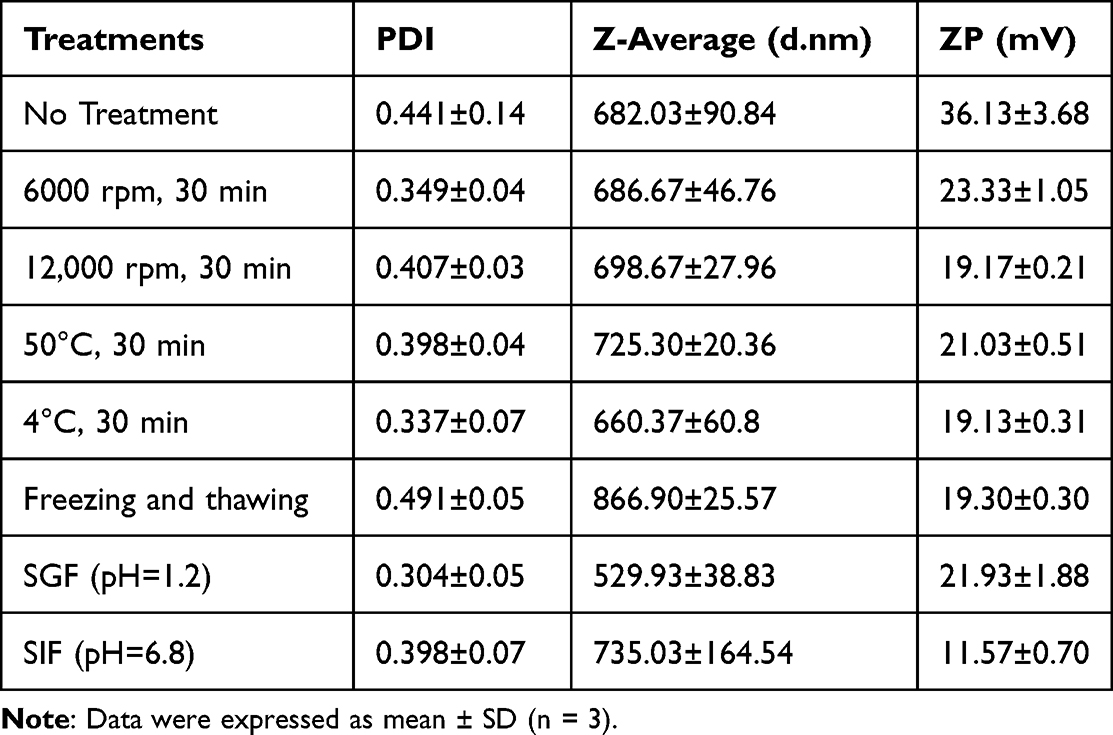 |
Table 4 Stability of STC@BBR-SANPs |
Drug Release
Drug release assay experiments for BBR and STC@BBR-SANPs were performed under both SGF (pH = 1.2) and SIF (pH = 6.8) conditions. As demonstrated in Figure 5A, BBR was completely released in SGF and SIF after 4 h, and the release in SGF was superior to SIF. STC@BBR-SANPs also had the above properties, but it is noteworthy that the drug release from STC@BBR-SANPs was higher than that from BBR in both release media.
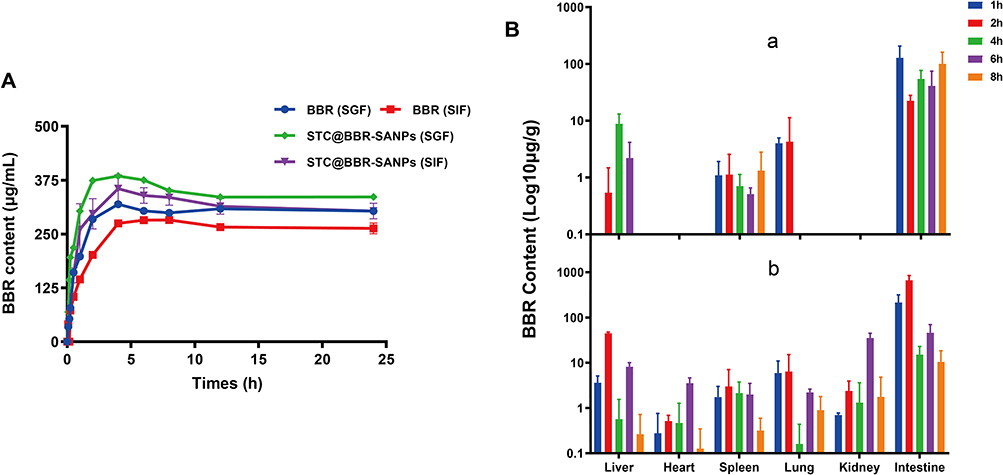 |
Figure 5 (A) Drug release curve of BBR and STC@BBR-SANPs in SGF and SIF. (B) BBR content of liver, heart, spleen, lung, kidney and intestinal tissues in mice administered with (a) BBR and (b) STC@BBR-SANPs for 1, 2, 4, 6 and 8 h (n = 3). |
Tissue Distribution Study
As displayed in Figure 5B and Table 5, the BBR in the liver, heart, lung and kidney cannot be completely detected at five time points of BBR group. Conversely, after administration of STC@BBR-SANPs, BBR was detected in all organs and the intestine had the highest content of BBR among the organs in these five time points. Furthermore, the administration of STC@BBR-SANPs increased the BBR content in each tissue.
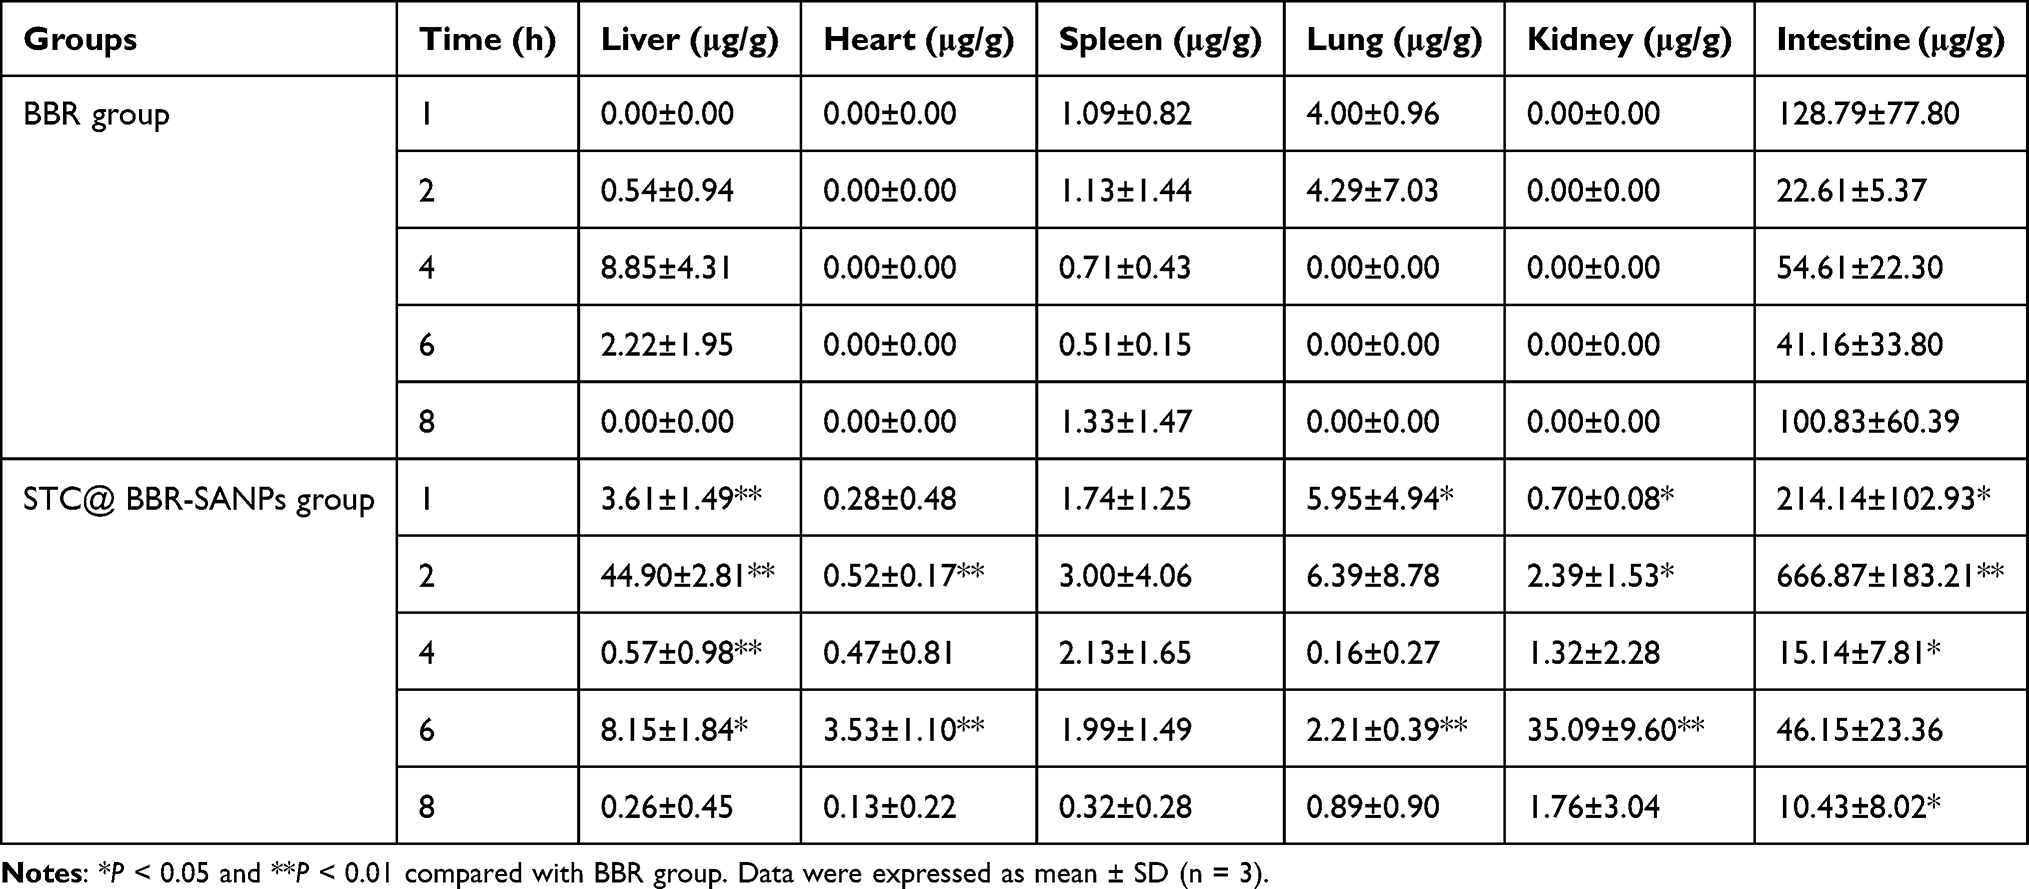 |
Table 5 Tissue Distribution of BBR Group and STC@BBR-SANPs Group |
Acute Toxicity Test
As shown in Figure 6A, after oral administration of STC@BBR-SANPs (2720 mg/kg), no mice died in 14 days, and there was no significant difference in body weight between the control group and STC@BBR-SANPs administered group. There were no morphological differences in H&E sections of liver, kidney and heart between the control and STC@BBR-SANPs treated groups (Figure 6B), which indicated that STC@BBR-SANPs was not acutely toxic to kidney, heart and liver. Therefore, STC@BBR-SANPs median lethal dose (LD50) was greater than 2720 mg/kg, revealing that STC@BBR-SANPs showed a favorable safety profile.
 |
Figure 6 Toxicology effects of STC@BBR-SANPs. (A) Body weight change of mice during 14 days. (B) Histopathological changes of liver, kidney and hearts. (n = 5). |
Pharmacological Effects of STC@BBR-SANPs
Effects of STC@BBR-SANPs on Body Weight and Organ Coefficient
The body weight, organ weight (liver, spleen and kidney), and organ coefficients (liver, spleen and kidney) are shown in Table 6 and Figure 7A–I. The body weight of mice in all groups was increased with the greatest fluctuation in HUA. No significant differences in body weight (P > 0.05 for all) or mortality were observed among all the groups throughout the experiment. In comparison with the control group, organ weight and organ coefficients of liver, spleen and kidney in the HUA group were dramatically higher after PO/HX administration (P < 0.01 for all). After STC@BBR-SANPs administration, the weight of kidney was decreased from 0.47 g (HUA group) to 0.31 g (STC@BBR-SANPs-L group, P < 0.01) and 0.31 g (STC@BBR-SANPs-H, P < 0.01), respectively. Similarly, Feb, BBR and STC@BBR-SANPs-L treatments significantly inhibited the increase in kidney index (for all P < 0.01). However, after STC@BBR-SANPs-L treatment, the kidney index decreased from 1.99 to 1.29, which was the optimal result. Besides, Feb (P < 0.01) and STC@BBR-SANPs-L (P < 0.05) also inhibited the increased liver index. In addition, there were significant differences between HUA group and Feb (P < 0.01) group in spleen index (P < 0.01).
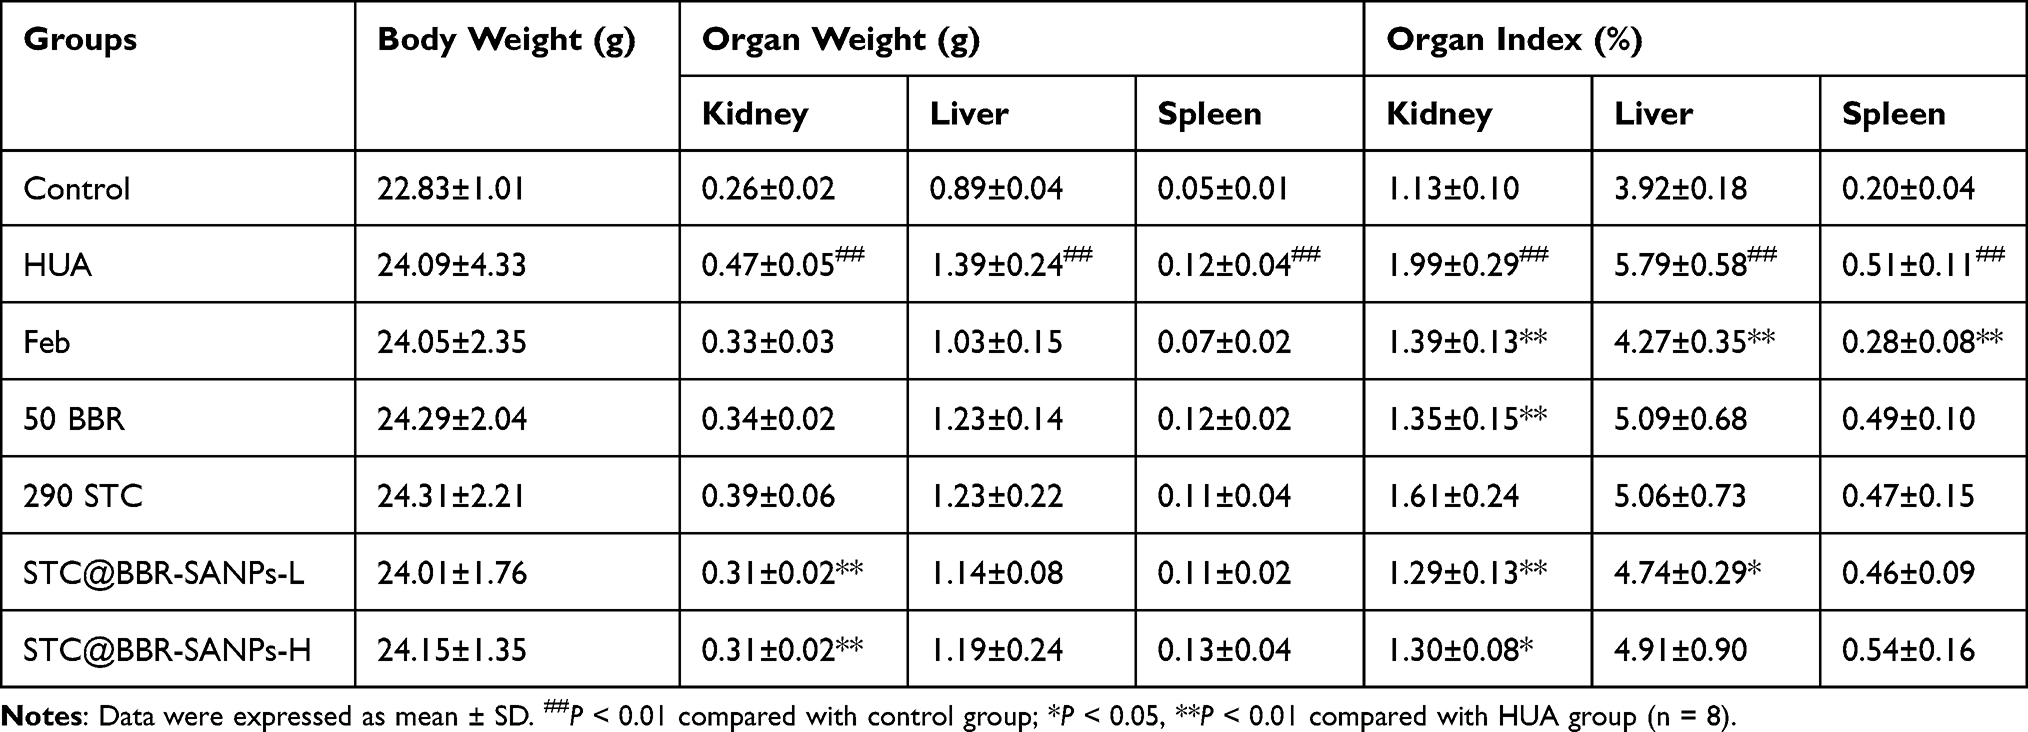 |
Table 6 Effects of STC@BBR-SANPs on Body Weight and Organ Coefficient |
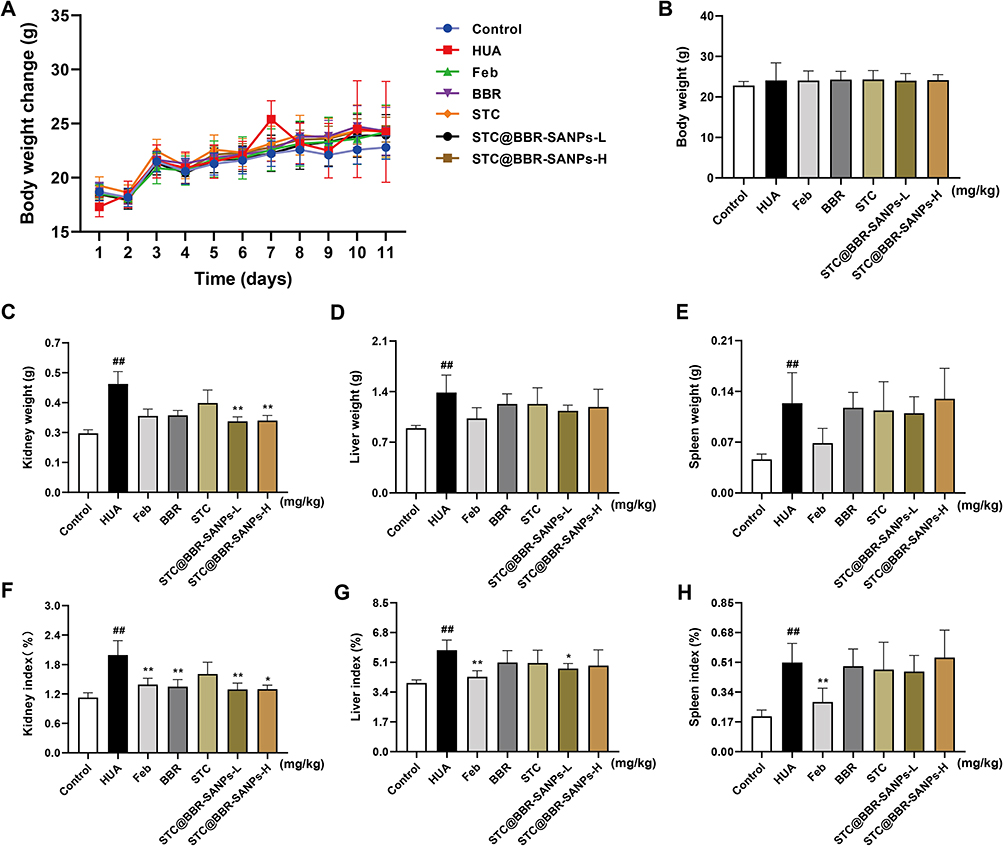 |
Figure 7 Effects of STC@BBR-SANPs on (A) body weight change, (B) body weight, (C) kidney weight, (D) liver weight, (E) spleen weight, (F) kidney index, (G) liver index and (H) spleen index in PO/HX-induced HUA mice. ##P < 0.01 compared with control group; *P < 0.05, **P < 0.01 compared with HUA group (n = 8). |
Effects of STC@BBR-SANPs on the Contents of Serum UA, CRE, and BUN
SUA concentration has been extensively considered as the foremost clinical indicator for the diagnosis of HUA. As illustrated in Figure 8A, the concentration of SUA was significantly elevated in mice after PO/HX administration compared to the control group (P < 0.01), which indicated that the HUA model was successfully established. Whereas, Feb (P < 0.01), BBR (P < 0.05) and STC@BBR-SANPs L or H groups (P < 0.01 for both) all significantly reduced the level of SUA in the HUA mice. Notably, statistical differences were observed between BBR group and STC@BBR-SANPs (P < 0.01), suggesting that STC@BBR-SANPs was more effective than BBR in suppressing SUA elevation.
 |
Figure 8 Effects of STC@BBR-SANPs on (A) uric acid, (B) BUN and (C) creatinine in PO/HX-induced HUA mice. ##P < 0.01 compared with control group; *P < 0.05 and **P < 0.01 compared with HUA group; &&P < 0.01 compared with BBR group (n = 8). |
CRE and BUN levels are two parameters intimately associated with kidney insufficiency. As shown in Figure 8B and C, the BUN and CRE levels in the HUA group were significantly higher than that of the control group (P < 0.01 for both), which indicated that the kidney function of mice was severely impaired after PO/HX modeling. However, all administration groups effectively reversed the elevation of BUN (P < 0.01 for all). And there was a tendency for the treatment groups to reduce CRE in HUA mice.
Effects of STC@BBR-SANPs on Histopathological Features
The appearance changes of the liver, spleen and kidney are presented in Figure 9A and B(a). In contrast to the dark red normal kidney tissues, the kidney tissues of the HUA mice were edematous and unevenly colored, and the color was pale in severe cases. After treatment with BBR and STC@BBR-SANPs, kidney morphology and color were improved. The mice in the STC@BBR-SANPs groups showed better reversal of renal injury compared with the BBR group.
 |
Figure 9 Effects of STC@BBR-SANPs on (A) liver and spleen general status. (B) Effects of STC@BBR-SANPs on (a) kidney histopathological changes in PO/HX-induced HUA mice and (b) the H&E staining of each group respectively. Black arrows indicated glomeruli, yellow arrows denoted renal tubules, red arrows signified epithelial cell detachment, and green arrows represented inflammatory cell infiltration. (C) Kidney histological scores of all groups. ##P < 0.01 compared with control group; **P < 0.01 compared with HUA group (n = 8). |
Moreover, the nephroprotective effect of STC@BBR-SANPs was proven by histopathology. As displayed in Figure 9B(b) and C, histopathological features of the control mice were neatly arranged renal tubular epithelial cells, glomeruli of normal shape and size, and without indications of inflammation. Whereas HUA mice exhibited infiltration of inflammatory cells, tubular dilatation and hyaline phenotype. Nevertheless, after STC@BBR-SANPs treatments, the kidney injury caused by PO/HX-induced HUA in mice was significantly attenuated. Especially in the STC@BBR-SANPs-H group, kidney injury improved most dramatically and maintained almost normal histological characteristics. Together, these results demonstrated that STC@BBR-SANPs alleviated renal injury in HUA mice and had a nephroprotection activity.
Effects of STC@BBR-SANPs on the Activity of XOD and ADA in Liver
In order to assess the inhibitory effect of STC@BBR-SANPs on UA, the levels of liver XOD and ADA were measured. As illustrated in Figure 10A and B, the levels of liver XOD and ADA in the HUA group were significantly increased compared to the control group (P < 0.01 for all). However, Feb, BBR, STC, STC@BBR-SANPs groups administration significantly relieved the elevated levels of XOD (P < 0.05 for all). Notably, STC@BBR-SANPs treatments (STC@BBR-SANPs-L and H groups) significantly reversed the elevated XOD and ADA (P < 0.01 for both). The results suggested that STC@BBR-SANPs can suppress UA production by inhibiting the activity of XOD and ADA, and the effect was superior to BBR.
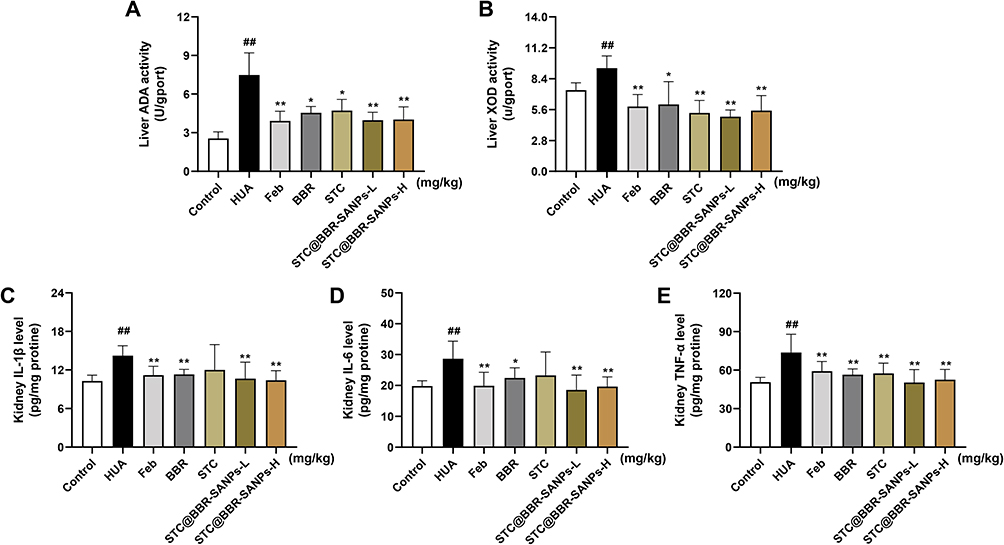 |
Figure 10 Effects of STC@BBR-SANPs on liver-related indexes and inflammatory cytokines in PO/HX-induced HUA mice. (A) liver ADA activity, (B) liver XOD activity, (C) kidney IL-1β, (D) kidney IL-6 and (E) kidney TNF-α. ##P < 0.01 compared with control group; *P < 0.05, **P < 0.01 compared with HUA group (n = 8). |
Effects of STC@ BBR-SANPs on Kidney Inflammatory Cytokines
To estimate the nephroprotective effect of STC@BBR-SANPs against HUA in mice, inflammatory cytokines including TNF-α, IL-1β and IL-6 in kidney tissues were measured. As shown in Figure 10C–E, compared to the control group, the levels of IL-1β, IL-6 and TNF-α were statistically elevated in the HUA group (P < 0.01 for all). Meanwhile, the Feb, BBR and STC@BBR-SANPs groups significantly attenuated the PO/HX-induced elevation of IL-1β, IL-6 and TNF-α (P < 0.05 for all). The effect of STC@BBR-SANPs in alleviating IL-6 was superior to BBR.
Discussion
BBR is an essential traditional Chinese medicine that has been used for many diseases over 2000 years. However, it is structurally poorly water soluble that leads to an extremely low oral bioavailability. In our previous study, BBR exerted prominent effects in HUA.31 The excellent treatment effect seems to be contradictory with its low bioavailability. Numerous studies have attempted to explain the relationship between its pharmacokinetics and therapeutic effects in different ways. It has been documented that BBR can remain in the intestinal tract for a longer period of time.32 Therefore, it is extremely interesting whether BBR could bind to certain substances in the intestine to achieve better efficacy.
Previous reports have extensively investigated that STC as a major component of primary bile acids and constitutes 30% of bile acid pool.7,33 STC was produced in the liver and then used in the intestine.34 Since it can be reabsorbed by the small intestine into the liver, STC exists enterohepatic circulation phenomenon.5 However, little attention has been paid to the interaction between STC and the drug itself.
Self-assembly has been defined as the combination of some molecules, macromolecules or composites themselves to create three-dimensional networks or other structures with novel and unique properties.10 It has been pointed out that bile salts have supramolecular self-assembly ability and can self-assemble into special nanostructures.14 However, studies on the self-assembly of STC and BBR are rarely available.
Therefore, we went further to hypothesize and validate the self-assembly process of BBR and STC, which provides a new idea for the mechanism of action of BBR. In the present study, we found that BBR and STC formed nanoparticles under certain conditions. These nanoparticles increased the solubility of BBR and enhanced their pharmacological effects. There was an explanation for the formation of such nanoparticles: BBR could constitute nanoparticles by self-assembly with STC in vivo. As shown in Figure 11, the β-surface of STCs and the groups on both sides of them were close to each other and form STC complexes. Then, two molecular STC complexes were in close proximity to each other, and form a large cavity on the α-surface of both STCs. Meanwhile, the BBR was firmly embedded within STC complexes through hydrogen bonds. Therefore, one molecule of BBR and four molecules of STCs could constitute a nanoparticle of stable BBR-STC units under intermolecular interactions. At the same time, there was a tendency to electrically neutralize in the units, which could bring them close to each other. A multiple of nanostructures interacted with each other and could extend in planar phase to form nanoribbons structure or extend in space to form nanotubes. Then they were self-assembled by van der Waals forces or electrostatic forces and formed a laminar structure. This conjecture was consistent with the previous literature and was demonstrated by our study.12–14
 |
Figure 11 Schematic diagram of self-assembly processes; drug delivery protocol and mechanism of drug action. |
Firstly, we comparatively explored the solubility of BBR and STC at different ratios and their characterizations to find if STC had an influence on BBR. The Z-average represents the average particle size and the PDI is an indicator to estimate the dispersion of the particle size distribution. These are two essential parameters to evaluate whether nanoparticles are formed.35,36 However, when PDI was 0.5 or higher, it is inaccurate to use Z-average as a reference and that the particle size needs to be re-evaluated by PSD. In common, PSDm value is often used as a meaningful reference result.37 In our study, STC system increased the solubility of BBR in water for the same BBR concentration, and the solubility tended to increase with the increase of STC. It was worth noting that the optimum solubility occurred at 1:4, which was more than three times the solubility of BBR water solution (Table 2). Meanwhile, the smallest particle size was also observed at 1:4 BBR-STC system and the PDI was 0.461 (PDI <0.5, Table 3). These results showed that 1:4 BBR-STC system could constitute nanometer particles with superior solubility to BBR.
To investigate whether the 1:4 BBR-STC system was stable enough to constitute STC@BBR-SANPs, then the flocculation and re-disperse features of BBR-STC system at each ratio were explored. Generally, the flocculation phenomenon occurs when the liquid dispersion is unstable. Flocculation can lead to the loss of active ingredients. Moreover, since the stability of the flocculated nanoparticle solution is higher than that of the unflocculated, it will be more difficult to re-disperse the nanoparticle solution of the flocculation.38 The present study showed that the 1:4 BBR-STC system flocculated more slowly than the others and re-dispersed at body temperature more easily compared to other ratios (Figure 4A). The results implied that the 1:4 BBR-STC system could maintain a steady state in vivo. Furthermore, SEM more visually represented that the STC@BBR-SANPs exhibited lamellae under SEM, while the STC was in the form of bulky crystals. The BBR and 1:4 BBR-STC physical mixture showed a disordered and broken morphology (Figure 4B). These observations proved our above hypothesis STC@BBR-SANPs could extend in a straight line or in space under the interaction between STC and BBR, and self-assembled into nanoribbons. On the other hand, the structural properties of each substance were demonstrated by XRPD and FT-IR (Figure 4C and D). The outcomes revealed extensive interactions between BBR and STC in STC@BBR-SANPs. These results further indicated that incorporation of STC in BBR greatly changed the crystal structure, which could lead to their different size and morphology profile.
Generally, particles of nanometer size implied a tremendous surface space and surface energy, which could cause both physical and chemical instability across diverse pH, thermal variations or gravitational conditions.39,40 Therefore, it is crucial to evaluate the stability of STC@BBR-SANPs. Being an essential stability parameter, ZP is the electric potential of the slip/shear surface of a nanoparticle that is moving with an electric field.41–43 Nanosystem with higher ZP suggested more stability to prevent from degradation and aggregation. Our results indicated that the STC@BBR-SANPs was in a stable state under various environments except for unstable at pH = 6.8 (Table 4). Possible reason for this is mainly STC@BBR-SANPs in high negative/positive charges could show higher stability in water, while settling or flocculation may occur under neutral conditions.
The drug release of STC@BBR-SANPs in both SGF and SIF was higher than that of BBR (Figure 5A). There were several possible reasons for this phenomenon: 1) Nanometer size of STC@BBR-SANPs provided a larger contact area for drug-water contact. 2) The particle size of STC@BBR-SANPs was smaller than the pore size of the dialysis bag when dissolved in water. 3) Hydrophilic groups exposed to the exterior of STC@BBR-SANPs form hydrogen bonds with water to increase solubility. From another aspect, the release of STC@BBR-SANPs and BBR was higher in SGF than those in SIF (Figure 5A). The cause of this phenomenon was probably the aggregation of particles due to instability of the ZP in pH = 6.8, which resulted in the appearance of larger particles and hindered the release of the drug.
Based on the findings above, the tissue distribution of STC@BBR-SANPs and BBR was further investigated (Figure 5B and Table 5). After BBR administration, the BBR content in the liver, heart, lung, and kidney were too low to be detected completely by HPLC. However, the BBR content in all organs can be detected when binding with STC@BBR-SANPs. It was indicated that the absorption of STC@BBR-SANPs in vivo was superior to that of BBR. In particular, we found that the apparently improvement of BBR content in the kidney tissue after STC@BBR-SANPs treatment, which revealed that STC@BBR-SANPs could accumulate for a longer period of time in kidney tissue. Therefore, we also focused on the kidney changes in our subsequent experiments.
From the acute toxicity test (Figure 6), the results indicated that the LD50 of STC@BBR-SANPs is more than 2720 mg/kg, and the dose selected for our subsequent experiments is in the safe range. Based on previous studies and literatures,22,31,44 a mouse model of acute HUA was established successfully in this study. The present study demonstrated that no mice mortality was observed among any of the groups throughout the experiment. Significant differences in organ weight and organ index between control group and model group (Table 6 and Figure 7). More convincingly, detection of SUA was the most intuitive evaluation criterion to observe whether the blood uric acid was elevated. The findings showed that SUA level was considerably elevated in the HUA group in comparison to the control group. However, BBR and STC@BBR-SANPs treatments could markedly reverse these abnormalities. Notably, STC@BBR-SANPs treatment group had lower SUA level than BBR group (Figure 8A). Additionally, HUA may cause damage to the liver, kidney, spleen and other organs in the body and kidney damage is inextricably linked to high uric acid.19,23,45 Our H&E staining results showed that Feb attenuated UA with excellent effect, but unsatisfactory improvement in the appearance of the kidney. On the contrary, STC@BBR-SANPs were almost indistinguishable from the normal pattern and had a reversal effect superior to BBR (Figure 9). These results were consistent with the previous results that STC@BBR-SANPs could accumulate in the kidney for a long period and played a key role in the treatment of kidney injury.
It has been proved that purines were synthesized in the liver and converted to UA via XOD.44,46,47 High XOD levels led to the overproduction of UA. Meanwhile, ADA plays a critical role in UA metabolism, ultimately producing hypoxanthine and xanthine.25 Consequently, it was critical to investigate the liver XOD and ADA activity to detect whether UA was produced. The results displayed that STC@BBR-SANPs were more effective than BBR in inhibiting liver XOD (BBR group was 6.02 ± 2.06, STC@BBR-SANPs-L group was 4.95 ± 0.61 and STC@BBR-SANPs-H group was 5.40 ± 1.29) and ADA (BBR group was 4.55 ± 0.49, STC@BBR-SANPs-L group was 3.96 ± 0.63 and STC@BBR-SANPs-H group was 4.03 ± 0.98) activities. Surprisingly, STC also inhibited the elevation of liver XOD and ADA activity (Figure 10A and B). It was reasonable to speculate that XOD, the key enzyme of uric acid, had high activity in the liver, and STC was also synthesized in the liver. These evidences suggest that STC may enhance the UA reduction effect of BBR by inhibiting XOD and ADA.
In addition, HUA leads to an inflammatory response and triggers the secretion of related inflammatory cytokines, including TNF-α, IL-1β and IL-6.20,46 Our results showed that BBR and STC@BBR-SANPs significantly decreased the elevation of IL-1β, IL-6 and TNF-α (Figure 10C–E). Meanwhile, STC@BBR-SANPs (P < 0.01) tended to be superior to BBR (P < 0.05) in IL-6. IL-6 is an important pro-inflammatory cytokine that exerts an enormous impact on gout pathogenesis. Studies have shown that synoviocytes and monocytes exposed to UA significantly increased the production of IL-6. Therefore, ameliorating inflammation through STC@BBR-SANPs was a possibly potential treatment strategy against HUA, which provides a relevant direction for our subsequent work.
However, the study still needs to be further investigated in terms of formulation stability and mechanism of uric acid-lowering effect, which will be the direction of our subsequent research.
Conclusions
In summary, solubility, particle size, flocculation and re-dispersion and characterization studies demonstrated that BBR mixed with STC at ratio of 1:4 could self-assemble to form STC@BBR-SANPs. Furthermore, we investigated the stability of STC@BBR-SANPs. The results showed that STC@BBR-SANPs can remain comparatively stable after centrifugation, heating, cooling, and freeze-thaw cycles, which indicated that STC@BBR-SANPs conformed to the characteristics of nanoparticles in stability experiment. After that, we explore the drug release in vitro and tissue distribution properties of STC@BBR-SANPs. The drug release results showed that STC@BBR-SANPs were superior than those of BBR and the preferred results are found in SGF. Compared to the tissue distribution results after BBR treatment, the BBR content kept superior in each tissue after STC@BBR-SANPs treatment, and may remain a longer period in kidney. Moreover, the alleviation of kidney weight and kidney histopathological features, UA, BUN, XOD, ADA and inflammatory cytokines in HUA mice after STC@BBR-SANPs treatment showed that STC can strengthen the uric acid lowering and nephroprotective effects activity of BBR (Figure 11). In particular, the STC@BBR-SANPs is more effective than BBR in reducing kidney weight, kidney index, kidney histopathology evaluation, the level of UA, BUN, ADA, XOD and IL-6. In a word, STC@BBR-SANPs overcome the poor solubility and low absorption of BBR in clinical use and may provide a new investigation possibility for the future development of BBR.
Abbreviations
ADA, adenosine deaminase; ANOVA, one-way analysis of variance; BBR, Berberine; BUN, blood urea nitrogen; CMC-Na, carboxymethylcellulose; CRE, creatinine; DW, Deionized water; Feb, febuxostat; H&E, hematoxylin-eosin; HPLC, High-performance liquid chromatography; HUA, hyperuricemia; HX, hypoxanthine; IL-1β, Interleukin-1β; IL-6, Interleukin-6; i.p., intraperitoneally; Km, the mole ratio of BBR and STC (w/w); LSD, least significant difference; PDI, polydispersity index; P.O., orally; PO, potassium oxonate; PSD, particle size distribution; PSDm maximum particle size distribution; PSDm intensity, percentage of maximum particle size distribution; SD, Standard deviation; SEM, Scanning Electron Microscope; SGF, simulating gastric fluid; SIF, simulating intestinal fluid; SR-FTIR, Fourier transform-infrared spectroscopy; STC, Sodium taurocholate; STC@BBR-SANPs, Nanoparticles formed by self-assembly of BBR and STC; STC@BBR-SANPs-L, 170 mg/kg STC@BBR-SANPs, consisting of 25 mg/kg BBR and 145 STC mg/kg; STC@BBR-SANPs-H, 340 mg/kg STC@BBR-SANPs, consisting of 50 mg/kg BBR and 290 STC mg/kg; SUA, Serum uric acid; TNF-α, Tumor necrosis factor-α; UA, uric acid; XOD, xanthine oxidase; XRPD, X-ray powder diffraction; Z-average, average particle size; ZP, zeta potential.
Acknowledgments
We acknowledge the support of the Guangdong Basic and Applied Basic Research Foundation (Grant Nos. 2021B1515140003, 2022A1515011706, 2021A1515011490, 2023A1515030157 and 2022A1515110954), Shenzhen Science and Technology Innovation Commission On-site Project (Grant No. JCYJ20220530141617039), Guangdong Hospital Association Pharmaceutical Research Special Fund (Hengrui) Pharmaceutical Research Youth Project (Grant No. 2021YXQN11), Wu Jieping Medical Foundation Clinical Research Special Project (Grant No. 320.6750.2022-20-20), Guangzhou University of Chinese Medicine Foundation, and Key Project of State Key Laboratory of Dampness Syndrome of Chinese Medicine (Grant No. SZ2021ZZ0303).
Disclosure
The authors report no conflicts of interest in this work.
References
1. Feng X, Sureda A, Jafari S, et al. Berberine in cardiovascular and metabolic diseases: from mechanisms to therapeutics. Theranostics. 2019;9(7):1923–1951. doi:10.7150/thno.30787
2. Wang K, Feng X, Chai L, Cao S, Qiu F. The metabolism of berberine and its contribution to the pharmacological effects. Drug Metab Rev. 2017;49(2):139–157. doi:10.1080/03602532.2017.1306544
3. Yu Q, Li M, Chen H, et al. The discovery of berberine erythrocyte-hemoglobin self-assembly delivery system: a neglected carrier underlying its pharmacokinetics. Drug Deliv. 2022;29(1):856–870. doi:10.1080/10717544.2022.2036870
4. Panda DS, Eid HM, Elkomy MH, et al. Berberine encapsulated lecithin-chitosan nanoparticles as innovative wound healing agent in type II diabetes. Pharmaceutics. 2021;13(8):1197. doi:10.3390/pharmaceutics13081197
5. Dawson PA, Hubbert ML, Rao A. Getting the mOST from OST: role of organic solute transporter, OSTalpha-OSTbeta, in bile acid and steroid metabolism. Biochim Biophys Acta. 2010;1801(9):994–1004. doi:10.1016/j.bbalip.2010.06.002
6. Brufau G, Groen AK, Kuipers F. Reverse cholesterol transport revisited: contribution of biliary versus intestinal cholesterol excretion. Arterioscler Thromb Vasc Biol. 2011;31(8):1726–1733. doi:10.1161/ATVBAHA.108.181206
7. Mathavan S, Mikov M, Golocorbin-Kon S, Al-Salami H. Diabetes development increased concentrations of the conjugated bile acid, taurocholic acid in serum, while treatment with microencapsulated-taurocholic acid exerted no hypoglycaemic effects. Eur J Pharm Sci. 2017;106:1–9. doi:10.1016/j.ejps.2017.05.041
8. Ridlon JM, Wolf PG, Gaskins HR. Taurocholic acid metabolism by gut microbes and colon cancer. Gut Microbes. 2016;7(3):201–215. doi:10.1080/19490976.2016.1150414
9. Biagioli M, Marchiano S, Carino A, et al. Bile acids activated receptors in inflammatory bowel disease. Cells. 2021;10(6):1281. doi:10.3390/cells10061281
10. Quinones JP, Peniche H, Peniche C. Chitosan based self-assembled nanoparticles in drug delivery. Polymers. 2018;10(3):235. doi:10.3390/polym10030235
11. Fei J, Zhao J, Du C, et al. One-pot ultrafast self-assembly of autofluorescent polyphenol-based core@shell nanostructures and their selective antibacterial applications. ACS Nano. 2014;8(8):8529–8536. doi:10.1021/nn504077c
12. Wang D, Yu C, Xu L, et al. Nucleoside analogue-based supramolecular nanodrugs driven by molecular recognition for synergistic cancer therapy. J Am Chem Soc. 2018;140(28):8797–8806. doi:10.1021/jacs.8b04556
13. Li T, Wang P, Guo W, et al. Natural berberine-based Chinese herb medicine assembled nanostructures with modified antibacterial application. ACS Nano. 2019;13(6):6770–6781. doi:10.1021/acsnano.9b01346
14. Jiao JM, Xu GY, Xin X. Effect of bile salts on self-assembly and construction of micro-/nanomaterials. Acta Phys Chim Sin. 2019;35(7):684–696. doi:10.3866/PKU.WHXB201806056
15. Huang J, Ma ZF, Zhang Y, et al. Geographical distribution of hyperuricemia in mainland China: a comprehensive systematic review and meta-analysis. Glob Health Res Policy. 2020;5(1):52. doi:10.1186/s41256-020-00178-9
16. Komori H, Yamada K, Tamai I. Hyperuricemia enhances intracellular urate accumulation via down-regulation of cell-surface BCRP/ABCG2 expression in vascular endothelial cells. Biochim Biophys Acta Biomembr. 2018;1860(5):973–980. doi:10.1016/j.bbamem.2018.01.006
17. Liu C, Zhou HN, Zhang RR, et al. Anti-hyperuricemic and nephroprotective effect of geniposide in chronic hyperuricemia mice. J Funct Foods. 2019;2019:61.
18. Su HY, Yang C, Liang D, Liu HF. Research advances in the mechanisms of hyperuricemia-induced renal injury. Biomed Res Int. 2020;2020:5817348. doi:10.1155/2020/5817348
19. Zhang C, Li L, Zhang Y, Zeng C. Recent advances in fructose intake and risk of hyperuricemia. Biomed Pharmacother. 2020;131:110795. doi:10.1016/j.biopha.2020.110795
20. Xu L, Lu LL, Gao JD. Traditional Chinese herbal medicine plays a role in the liver, kidney, and intestine to ameliorate hyperuricemia according to experimental studies. Evid Based Complement Alternat Med. 2021;2021:4618352. doi:10.1155/2021/4618352
21. Yanai H, Adachi H, Hakoshima M, Katsuyama H. Molecular biological and clinical understanding of the pathophysiology and treatments of hyperuricemia and its association with metabolic syndrome, cardiovascular diseases and chronic kidney disease. Int J Mol Sci. 2021;22(17):9221. doi:10.3390/ijms22179221
22. Xu L, Lin G, Yu Q, et al. Anti-hyperuricemic and nephroprotective effects of dihydroberberine in potassium oxonate- and hypoxanthine-induced hyperuricemic mice. Front Pharmacol. 2021;12:645879. doi:10.3389/fphar.2021.645879
23. Braga TT, Foresto-Neto O, Camara NOS. The role of uric acid in inflammasome-mediated kidney injury. Curr Opin Nephrol Hypertens. 2020;29(4):423–431. doi:10.1097/MNH.0000000000000619
24. Wang XJ, Qi YD, Guan HC, et al. Gegen Qinlian decoction ameliorates hyperuricemia-induced renal tubular injury via blocking the inflammatory signaling pathway. Front Pharmacol. 2021;12:665398. doi:10.3389/fphar.2021.665398
25. Jiang L, Wu Y, Qu C, et al. Hypouricemic effect of gallic acid, a bioactive compound from Sonneratia apetala leaves and branches, on hyperuricemic mice. Food Funct. 2022;13(19):10275–10290. doi:10.1039/D2FO02068H
26. Zhang M, Solomon DH, Desai RJ, et al. Assessment of cardiovascular risk in older patients with gout initiating febuxostat versus allopurinol: population-based cohort study. Circulation. 2018;138(11):1116–1126. doi:10.1161/CIRCULATIONAHA.118.033992
27. Azadi R, Mousavi SE, Kazemi NM, Yousefi-Manesh H, Rezayat SM, Jaafari MR. Anti-inflammatory efficacy of Berberine nanomicelle for improvement of cerebral ischemia: formulation, characterization and evaluation in bilateral common carotid artery occlusion rat model. BMC Pharmacol Toxicol. 2021;22(1):54. doi:10.1186/s40360-021-00525-7
28. Du J, Zong L, Li M, et al. Two-pronged anti-tumor therapy by a new polymer-paclitaxel conjugate micelle with an anti-multidrug resistance effect. Int J Nanomedicine. 2022;17:1323–1341. doi:10.2147/IJN.S348598
29. Chau YT, Chen HY, Lin PH, Hsia SM. Preventive effects of fucoidan and fucoxanthin on hyperuricemic rats induced by potassium oxonate. Mar Drugs. 2019;17(6). doi:10.3390/md17060343
30. Chen J, Xu L, Jiang L, et al. Sonneratia apetala seed oil attenuates potassium oxonate/hypoxanthine-induced hyperuricemia and renal injury in mice. Food Funct. 2021;12(19):9416–9431. doi:10.1039/D1FO01830B
31. Li Q, Huang Z, Liu D, et al. Effect of berberine on hyperuricemia and kidney injury: a network pharmacology analysis and experimental validation in a mouse model. Drug Des Devel Ther. 2021;15:3241–3254. doi:10.2147/DDDT.S317776
32. Song D, Hao J, Fan D. Biological properties and clinical applications of berberine. Front Med. 2020;14(5):564–582. doi:10.1007/s11684-019-0724-6
33. Xiang X, Han Y, Neuvonen M, Laitila J, Neuvonen PJ, Niemi M. High performance liquid chromatography-tandem mass spectrometry for the determination of bile acid concentrations in human plasma. J Chromatogr B Analyt Technol Biomed Life Sci. 2010;878(1):51–60. doi:10.1016/j.jchromb.2009.11.019
34. Yang Y, He J, Suo Y, et al. Anti-inflammatory effect of taurocholate on TNBS-induced ulcerative colitis in mice. Biomed Pharmacother. 2016;81:424–430. doi:10.1016/j.biopha.2016.04.037
35. Rane SS, Choi P. Polydispersity index: how accurately does it measure the breadth of the molecular weight distribution? Chem Mater. 2005;17(4):926. doi:10.1021/cm048594i
36. Tantra R, Schulze P, Quincey P. Effect of nanoparticle concentration on zeta-potential measurement results and reproducibility. Particuology. 2010;8(3):279–285. doi:10.1016/j.partic.2010.01.003
37. Kakran M, Shegokar R, Sahoo NG, Shaal LA, Li L, Muller RH. Fabrication of quercetin nanocrystals: comparison of different methods. Eur J Pharm Biopharm. 2012;80(1):113–121. doi:10.1016/j.ejpb.2011.08.006
38. Manabe N, Hanada S, Aoki N, Futamura Y, Yamamoto K, Adschiri T. Flocculation and re-dispersion of colloidal quantum dots. J Chem Eng Jpn. 2012;45(11):917–923. doi:10.1252/jcej.12we114
39. Dou YX, Zhou JT, Wang TT, et al. Self-nanoemulsifying drug delivery system of bruceine D: a new approach for anti-ulcerative colitis. Int J Nanomedicine. 2018;13:5887–5907. doi:10.2147/IJN.S174146
40. Trenkenschuh E, Friess W. Freeze-thaw stability of aluminum oxide nanoparticles. Int J Pharm. 2021;606:120932. doi:10.1016/j.ijpharm.2021.120932
41. Almalik A, Alradwan I, Kalam MA, Alshamsan A. Effect of cryoprotection on particle size stability and preservation of chitosan nanoparticles with and without hyaluronate or alginate coating. Saudi Pharm J. 2017;25(6):861–867. doi:10.1016/j.jsps.2016.12.008
42. Kaszuba M, Corbett J, Watson FM, Jones A. High-concentration zeta potential measurements using light-scattering techniques. Philos Trans a Math Phys Eng Sci. 2010;368(1927):4439–4451. doi:10.1098/rsta.2010.0175
43. Sultana S, Alzahrani N, Alzahrani R, et al. Stability issues and approaches to stabilised nanoparticles based drug delivery system. J Drug Target. 2020;28(5):468–486. doi:10.1080/1061186X.2020.1722137
44. Lin G, Yu Q, Xu L, et al. Berberrubine attenuates potassium oxonate- and hypoxanthine-induced hyperuricemia by regulating urate transporters and JAK2/STAT3 signaling pathway. Eur J Pharmacol. 2021;912:174592. doi:10.1016/j.ejphar.2021.174592
45. Guo Y, Yu Y, Li H, et al. Inulin supplementation ameliorates hyperuricemia and modulates gut microbiota in Uox-knockout mice. Eur J Nutr. 2021;60(4):2217–2230. doi:10.1007/s00394-020-02414-x
46. Wu YL, Chen JF, Jiang LY, et al. The extract of sonneratia apetala leaves and branches ameliorates hyperuricemia in mice by regulating renal uric acid transporters and suppressing the activation of the JAK/STAT Signaling Pathway. Front Pharmacol. 2021;12:698219. doi:10.3389/fphar.2021.698219
47. Yong T, Chen S, Xie Y, et al. Hypouricemic effects of ganoderma applanatum in hyperuricemia mice through OAT1 and GLUT9. Front Pharmacol. 2017;8:996. doi:10.3389/fphar.2017.00996
 © 2023 The Author(s). This work is published and licensed by Dove Medical Press Limited. The
full terms of this license are available at https://www.dovepress.com/terms
and incorporate the Creative Commons Attribution
- Non Commercial (unported, 3.0) License.
By accessing the work you hereby accept the Terms. Non-commercial uses of the work are permitted
without any further permission from Dove Medical Press Limited, provided the work is properly
attributed. For permission for commercial use of this work, please see paragraphs 4.2 and 5 of our Terms.
© 2023 The Author(s). This work is published and licensed by Dove Medical Press Limited. The
full terms of this license are available at https://www.dovepress.com/terms
and incorporate the Creative Commons Attribution
- Non Commercial (unported, 3.0) License.
By accessing the work you hereby accept the Terms. Non-commercial uses of the work are permitted
without any further permission from Dove Medical Press Limited, provided the work is properly
attributed. For permission for commercial use of this work, please see paragraphs 4.2 and 5 of our Terms.