")
Back to Journals » International Journal of Nanomedicine » Volume 14
Self-assembled insulin and nanogels polyelectrolyte complex (Ins/NGs-PEC) for oral insulin delivery: characterization, lyophilization and in-vivo evaluation
Authors Mudassir J, Darwis Y, Muhamad S, Khan AA
Received 25 December 2018
Accepted for publication 11 April 2019
Published 5 July 2019 Volume 2019:14 Pages 4895—4909
DOI https://doi.org/10.2147/IJN.S199507
Checked for plagiarism Yes
Review by Single anonymous peer review
Peer reviewer comments 4
Editor who approved publication: Dr Thomas Webster
Jahanzeb Mudassir1,2, Yusrida Darwis,1 Suriani Muhamad,1 Arshad Ali Khan1,3
1Discipline of Pharmaceutical Technology, School of Pharmaceutical Sciences, Universiti Sains, Malaysia, 11800, Penang Malaysia; 2Department of Pharmaceutics, Faculty of Pharmacy, Bahanuddin Zakariya, Multan, Pakistan; 3Faculty of Engineering Technology, Universiti Malaysia Pahang, Kuantan, Pahang, Malaysia
Introduction: Insulin is given by injection, because when administered orally, it would be destroyed by enzymes in the digestive system, hence only about 0.1% reaches blood circulation. The purpose of the present study was to use pH sensitive polyelectrolyte methyl methacrylate (MMA)/itaconic acid (IA) nanogels as carriers in an attempt to improve absorption of insulin administered orally.
Methods: Insulin (Ins) was incorporated into the MMA/IA nanogels (NGs) using the polyelectrolyte complexation (PEC) method to form Ins/NGs-PEC. Several parameters, including Ins:NGs ratio, pH, incubation time and stirring rate were optimized during preparation of InsNGs-PEC. The prepared formulations were characterized in terms of particle size (PS), polydispersity index (PdI), zeta potential (ZP) and percent entrapment efficiency (% EE).
Results: The optimized InF12 nanogels had a PS, PdI, ZP and %EE of 190.43 nm, 0.186, −16.70 mV and 85.20%, respectively. The InF12 nanogels were lyophilized in the presence of different concentrations of trehalose as cryoprotectant. The lyophilized InF12 containing 2%w/v trahalose (InF12-Tre2 nanogels) was chosen as final formulation which had a PS, PdI, ZP and %EE of 430.50 nm, 0.588, −16.50 mv and 82.10, respectively. The in vitro release of insulin from InF12-Tre2 nanogels in the SGF and SIF were 28.71% and 96.53%, respectively. The stability study conducted at 5±3°C for 3 months showed that lnF12-Tre2 nanogels were stable. The SDS-PAGE assay indicated that the primary structure of insulin in the lnF12-Tre2 nanogels was intact. The in-vivo study in the diabetic rats following oral administration of InF12-Tre2 nanogels at a dose of 100 IU/kg body weight reduced blood glucose level significantly to 51.10% after 6 hours compared to the control groups.
Conclusions: The pH sensitive MMA/IA nanogels are potential carriers for oral delivery of insulin as they enhanced the absorption of the drug.
Keywords: acrylic monomers, peptides self assembly, lyophilization, hypoglycemic effect, polymeric nanogels
Introduction
Oral insulin delivery is still a dream of formulation scientists and the hope of diabetic patients. Numerous attempts have been made, but with limited success and until now there is no oral insulin formulation available on the market. The harsh conditions of the stomach destroy orally administered insulin and only less than 0.1% reaches the blood circulation intact.1 Nano-formulations are generally used to encapsulate drugs to limit their adverse effects and improve bioavailability. However, in the case of encapsulating peptides and proteins, the objectives are to retain the stability of loaded peptides and proteins until delivered to the target organ. Therefore, the nanocarriers with efficient loading capability and preserving structural integrity of loaded peptides and proteins are the key component of future research.2,3 In this context, the oral peptide and protein deliveries via self-assembled polyelectrolye nanocomplexes have shown great potential in improving uptake of peptides and proteins, and also retaining their biological activity.2,4–6 Oral administrations of insulin encounter numerous barriers. The greatest oral barriers include harsh environmental conditions of the stomach due to acid, proteolytic enzymes and transport barriers due to intestinal tight junctions. The encapsulation of peptides and proteins such as insulin in carriers, namely polyacrylic acid (PAA)/polymethacrylic acid (PMAA) and other carriers containing carboxylic acid functional groups are promising strategy for oral peptides and proteins deliveries. These materials are reported as having absorption enhancement/proteolytic enzyme inhibition capabilities.7,8
In the present study, pH sensitive polyelectrolyte methyl methacrylate (MMA)/itaconic acid (IA) nanogels (MMA/IA nanogels) were used to incorporate insulin (Ins) because of the following reasons: 1) The compounds have pH sensitive property, they show swelling at basic pH and remained collapsed at acidic pH; 2) Nanogels show an isoelectric point similar to peptides and proteins; 3) Nanogels possess positive zeta potential at pH below its isoelectric point and negative zeta potential above its isoelectric point. Thus, the MMA/IA nanogels are excellent candidates for the polyelectrolyte complexation. The Insulin (Ins) was incorporated into MMA/IA nanogels (NGs) using the polyelectrolyte complexation (PEC) method to form a Ins/NGs-PEC formulation. Thirteen Ins/NGs-PEC formulations were prepared and several parameters were optimized including 1) Ins:NGs ratios, 2) pH of the complex-forming medium; 3) Incubation time for complexation; and 4) Stirring rate of the complex-forming medium. The effects of these parameters on the properties of formulations such as the particle size (PS), polydispersity index (PdI), zeta potential (ZP) and percent entrapment efficiency (% EE) were evaluated. The optimized formulation was subjected to in-vitro release study in the simulated gastric fluid (SGF) and simulated intestinal fluid (SIF). The optimized formulations were then lyophilized using 0.5, 1, 2 and 3% w/v trehalose and were evaluated for PS, PdI, ZP, %EE and in-vitro release study. The morphology of Ins/NGs-PEC and lyophilized lns/NGs-PEC formulations were analyzed by transmission electron microscope (TEM). The structural integrity of insulin in the lyophilized Ins/NGs-PEC was assayed using SDS-PAGE. The stability of lyophilized lns/NGs-PEC formulations stored at temperatures of 5±3°C and 25±2°C (75±15%RH) were investigated. Finally, an in-vivo study in diabetic rats was conducted to measure the glucose levels in the animal model.
Materials
Methyl methacrylate (MMA), itaconic acid (IA), ethylene glycol dimethacrylate (EGDMA), and benzoyl peroxide (BPO), were purchased from Sigma Aldrich (St Louis, MO, USA). Tween 80 was purchased from Euro Chemo-Pharma Sdn Bhd (Penang, Malaysia). The spectra pore regenerated cellulose dialysis membrane having MWCO 1000 Da was purchased from Nano Life Quest Sdn Bhd (Selangor, Malaysia). Insulin aspart solution (NovoRapid® 100 IU: 3.5 mg/Ml (Novo Nordisk, Bagsvaerd, Denmark) was purchased from the Pharmacy of Universiti Sains, Malaysia. Trehalose and streptozotocin (STZ) were purchased from Sigma Aldrich. A fast ultrafiltration kit (Amicon Micropartition system MPS-1 Starter kit) was obtained from W.R. Grace & Co. Danvers, MA, USA. The Glucometer and strip used were the AccuChek Performa (Hoffman-La Roche, Basel, Switzerland).
Methods
Preparation of MMA/IA nanogels
The pH-sensitive nanogels were prepared through free radical polymerization according to the procedure described by Mudassir et al 2017.9 Briefly the pH sensitive polyelectrolyte was synthesized using methyl methacrylate (MMA), Itaconic acid (IA) and crosslinker ethylene glycol dimethacrylate (EGDMA), benzoyl benzoate and Tween 80 to form MMA/IA nanogels. EGDMA (1.5 mol%) was added to MMA (70 mol%), while IA (30 mol%) was dissolved in ethanol. Both solutions were mixed, then benzoyl peroxide (BPO) 1% w/w) and Tween 80 (0.1%w/v) were added. The mixture was heated to initiate polymerization and diluted with ethanol/water. The nanogels dispersion was obtained by precipitating the mixture with water.
Determination of the isoelectric point (PI) of insulin, nanogels and Ins/NGs-PEC using aqueous electrophoresis (auto-titration)
The PI of insulin, nanogels and Ins/NGs-PEC was determined using aqueous electrophoresis at pH range from 3.5 to 7.0. Auto-titration was performed using a Malvern Zetasizer Nano ZS instrument (Malvern Instruments Ltd, Malvern, UK) connected to a MPT-1 auto-titrator (Malvern Instruments Ltd) as accessory and operating via zetasizer nano software. Insulin was dissolved in 10 ml distilled water at a concentration of 3 mg/ml. The pH of the insulin solution was automatically adjusted by the titration unit through the addition of either 0.25 N, 0.025 N HCl or 0.25 N NaOH solution.
Preparation of Ins/NGs-PEC
The required amount of nanogel suspension was mixed with an insulin solution in a universal glass bottle with gentle magnetic stirring. Then, the pH of the mixture was adjusted to 4.0 by adding either 0.2 N NaOH or 0.025 N HCl. Under these conditions, insulin and nanogels possessed positive and negative charge, respectively, which led to the formation of Ins/NGs-PEC formulation by electrostatic interaction between insulin and nanogel. Thereafter, the Ins/NGs-PEC was incubated in an ice bath with continuous magnetic stirring. Then, the Ins/NGs-PEC was separated from free insulin using a fast ultrafiltration method. Briefly, 1 ml of prepared Ins/NGs-PEC was placed in a centrifugal filter tube (Amicon Micropartition System) and centrifuged at 4,000 rpm for 20 minutes to separate free and entrapped insulin in Ins/NGs-PEC. The filtrate was collected and the amount of insulin in the filtrate was quantified by the RP-HPLC method.
The HPLC analysis was carried out using a Shimadzu chromatic system with LC 20AD delivery pump (Kyoto, Japan) and a phnomenex C18 column (150x4.6 mm). The mobile phase consisted of 0.2 M sodium sulphate anhydrous (adjusted to pH 2.3 with ortho phosphoric acid) and acetonitrile (74:26 v/v) with a flow rate of 1.2 ml/min. The injection volume was 20 µl and detection wavelength was set at 214 nm.
The amount of insulin associated with nanogels was determined indirectly by measuring the difference between the initial weight of insulin used in the formulation and the amount of insulin recovered in the supernatant. The amount of insulin in the supernatant was quantified using HPLC. The percent entrapment efficiency (% EE) was calculated using the following equation:
(1)
Measurement of particle size, polydispersity index and zeta potential
Photon correlation spectroscopy (PCS) was used to determine particle size (PS) and polydispersity index (PdI) of prepared Ins/NGs-PEC. Measurements were performed using Zetasizer 1000HSA (Malvern Instruments). The samples were diluted with filtered-distilled water pH 4 (0.45 μm membrane filter) to produce an appropriate scattering intensity within 100–150 kilocounts per second (kcps). The filtered-distilled water at pH 4 was used for dilution to prevent the swelling of nanogels during measurement. The samples were measured in triplicate.
Zeta potential (ZP) was measured using a Zetasizer Nano series ZS from Malvern Instruments. The samples were diluted with filtered-distilled water pH 4.0 (0.45 μm membrane filter) prior to the measurement to get sample quality more than 1. Each sample was measured in triplicate at 25°C with a minimum of 20 runs for each sub-run.
Optimization of Ins/NGs-PEC parameters
The four parameters ratios of Ins:nanogel, pH, incubation time and stirring rate were optimized during preparation of Ins/NGs-PEC formulations. The optimization study was carried out by preparing 13 formulations (InF1–InF13) as shown in Table 1. During optimization only one parameter was varied at a time, while the other three parameters were kept constant. The evaluated responses were PS, PdI, ZP and%EE.
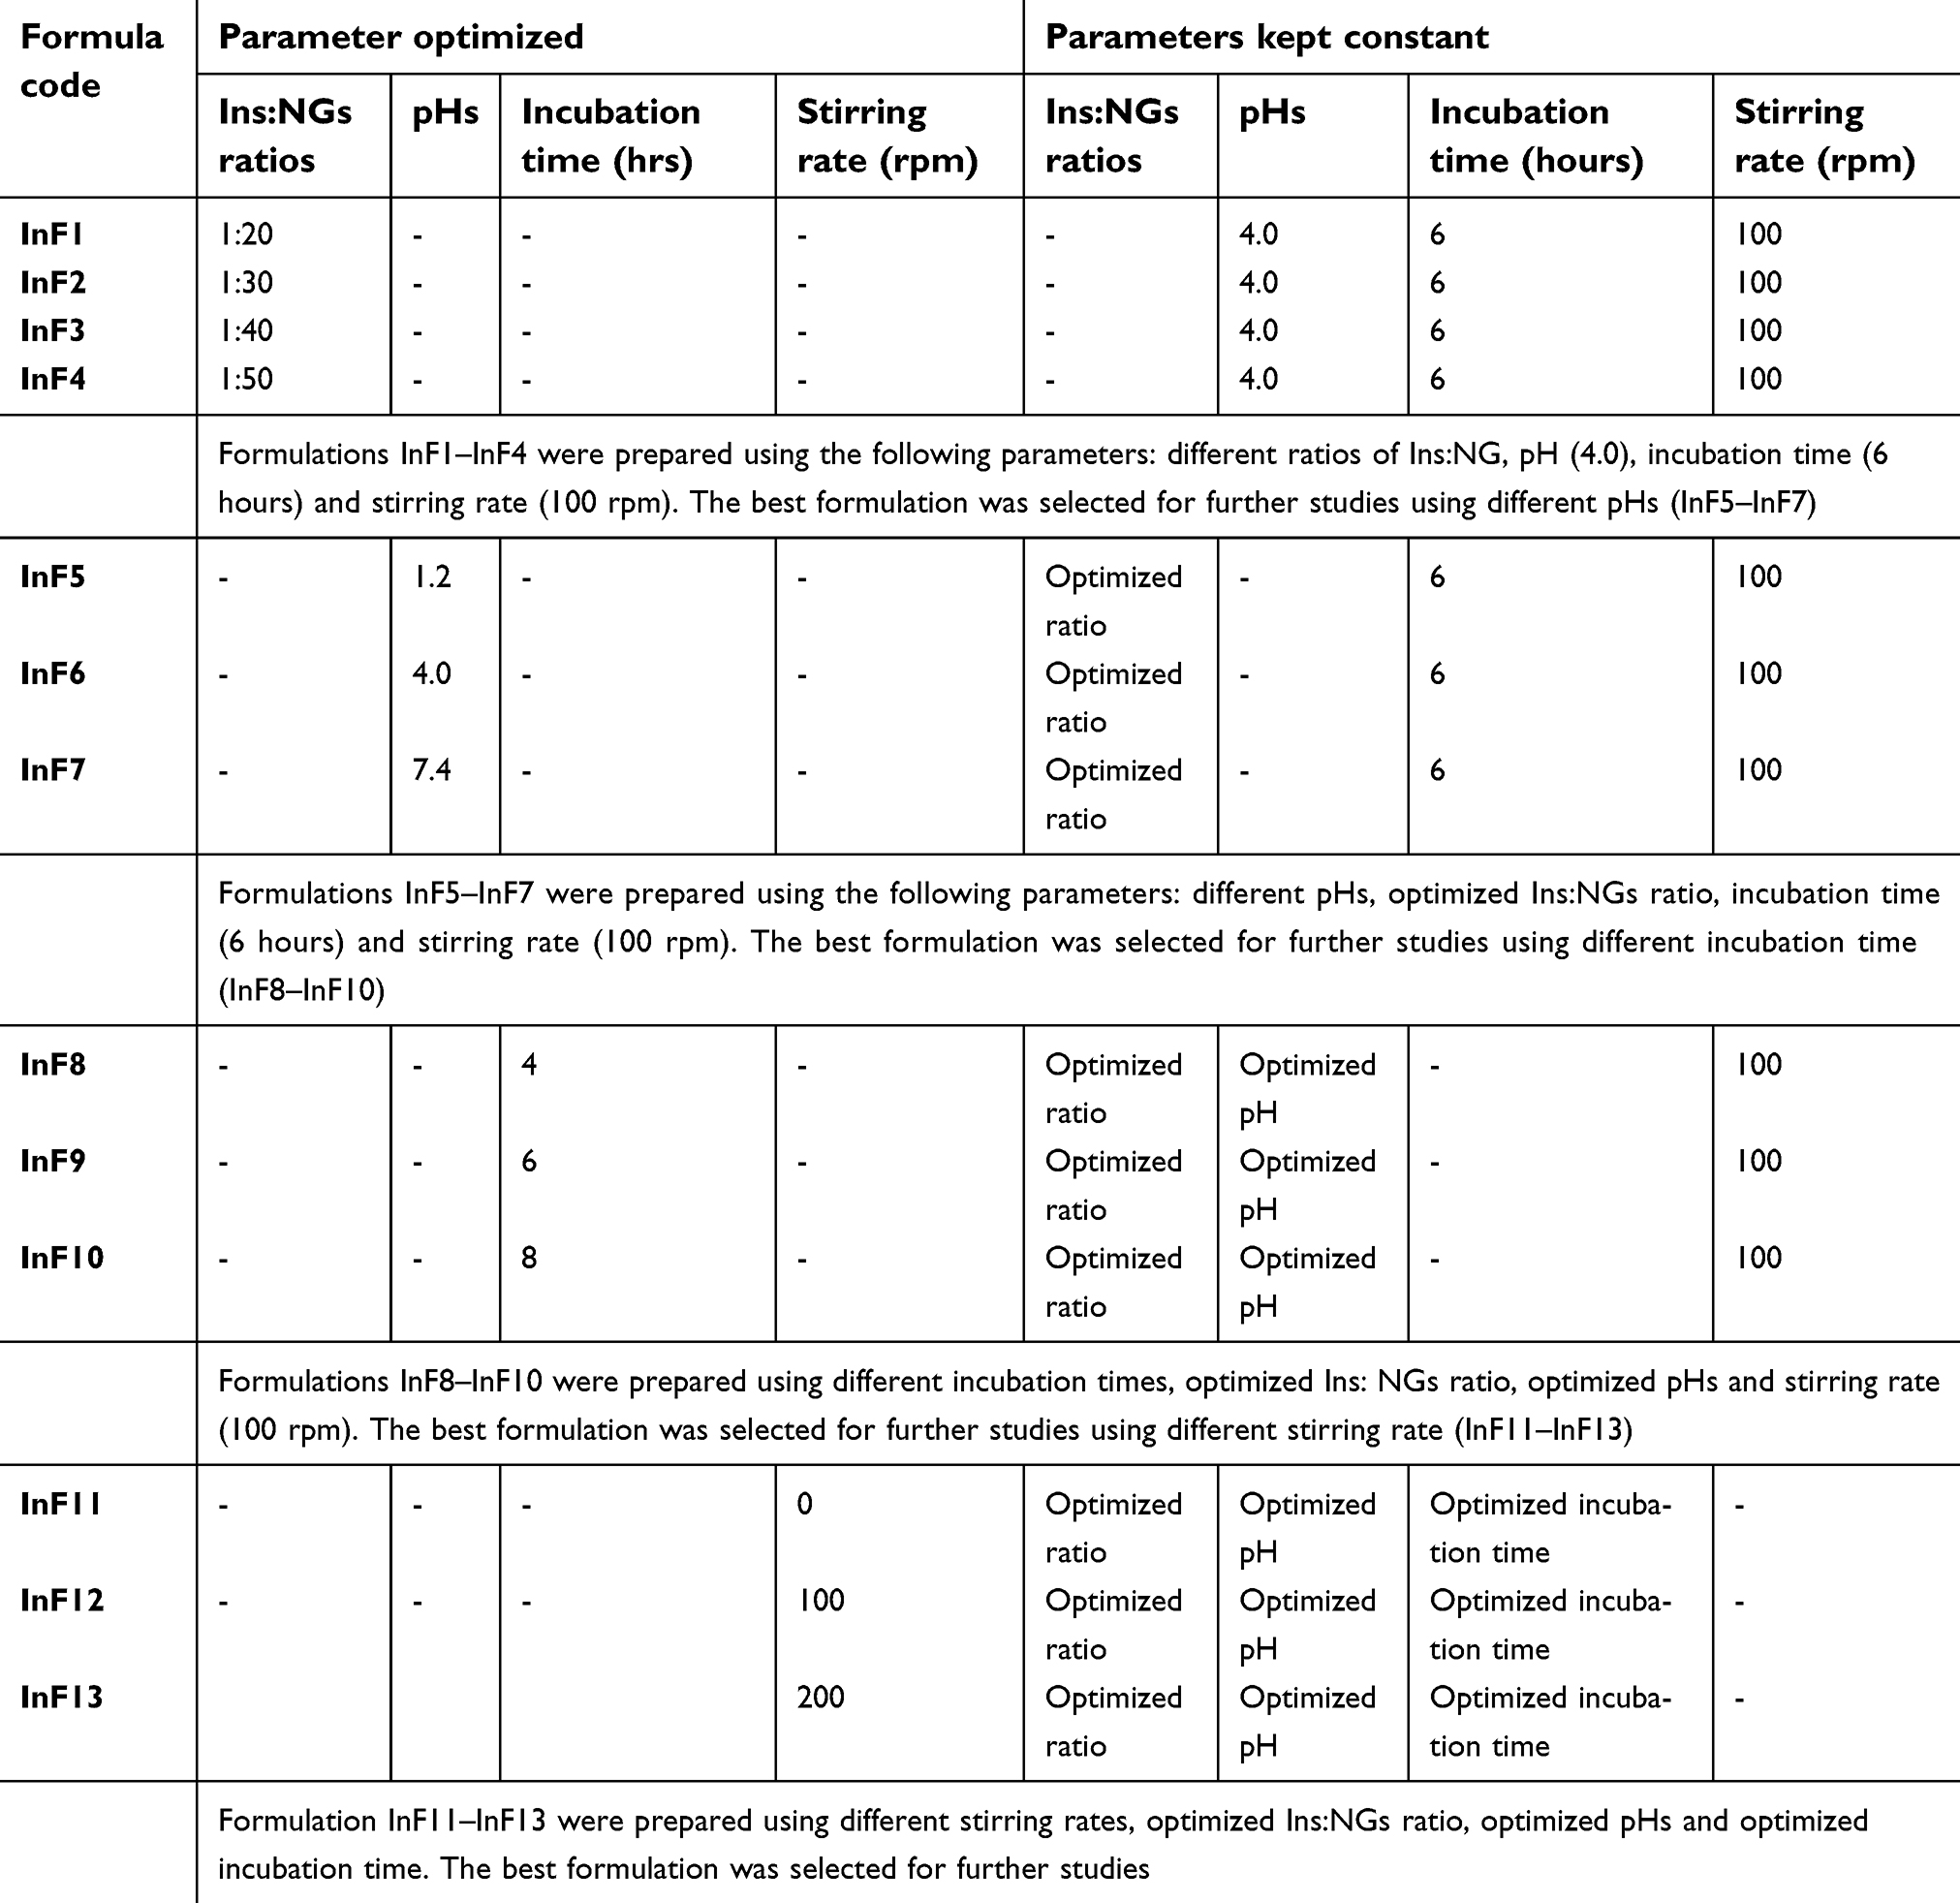 |
Table 1 Optimization of Ins/NGs-PEC parameters |
Lyophilization of optimized Ins/NGs-PEC
The optimized Ins/NGs-PEC formulations were lyophilized in the presence of 0.5, 1, 2 and 3% w/v trehalose. The required amount of Ins/NGs-PEC formulation was mixed with trehalose and then frozen overnight at −20°C prior to lyophilization. The frozen sample was lyophilized using a freeze drying system (Labconco Corporation, Kansas City, MO, USA) for 24 hours to allow complete drying of samples.
In-vitro release profiles of insulin from optimized liquid and lyophilized Ins/NGs-PEC formulations
The in vitro release studies were performed according to USP specifications on the optimized liquid and lyophilized Ins/NGs-PEC formulations. Simulated gastric fluid (SGF) and simulated intestinal fluid (SIF) media without enzymes were used. The Ins/NG-PEC formulation was dispersed in 5 ml SGF (pH 1.2) and in 5 ml SIF (pH 6.8) media at 37±2°C and stirring rate of 100 rpm.
At predetermined time intervals (15, 30, 45 minutes, 1, 1.5, 2, 4, 6 and 8 hours), 300 µl of aliquots were withdrawn and replaced with an equal volume of the same fresh release media. The solution was centrifuged at 10,000 rpm for 10 minutes. The supernatant was collected and subsequently filtered using a PTFE syringe filter (Titan2®, Thermo Fisher Scientific, Waltham, MA, USA), with 0.2 µm pore size. The amount of insulin released from the Ins/NG-PEC was quantified by HPLC.
Fourier transform infrared (FTIR) spectra
The FTIR spectra of various samples, including insulin, nanogels, trehalose, blank formulation lyophilized using trehalose and optimized lyophilized Ins/NGs-PEC formulation were recorded using a FTIR spectrometer (Nicolet Nexus 470, Thermo Electron corporation, USA).
Evaluation of insulin primary structural integrity in the lyophilized Ins/NGs-PEC by SDS-polyacrylamide gel electrophoresis (SDS-PAGE) assay
The primary structural integrity of insulin in optimized lyophilized Ins/NGs-PEC formulation was evaluated using SDS-PAGE and was compared to the standard insulin (Novorapid®) and protein marker. For this purpose, the insulin, which was released from the optimized formulation at pH 6.8 was used for the assay. The resolving and stacking gels were prepared using electrophoresis assembly (Mini-PROTEIN 3 cell: Bio-Rad Laboratories Inc.,Hercules, CA, USA). The 12% Tricine SDS-PAGE resolving gel and 5% Tricine stacking gels were prepared. The 10 μL of insulin sample was loaded on SDS-PAGE gel and run at a constant voltage of 200 V (Power Pac; Bio-Rad) in running buffer for 1 hour. The staining and de-staining procedure were performed to visualize the separated bands.
Transmission electron microscope (TEM)
The shape and morphology of the optimized liquid Ins/NGs-PEC formulation and reconstituted lyophilized Ins/NGs-PEC formulation were examined using a TEM (CM12, FEI, Eindhoven, Netherland).
Stability study of lyophilized Ins/NGs-PEC formulation
The stability study was performed on the optimized lyophilized Ins/NGs-PEC formulation at two storage conditions (5±3°C and 25±2°C) for 3 months. Stability of the formulation was determined by evaluating PS, PdI, ZP and % drug content and in vitro release of the stable formulation.
In-vivo evaluations
Animals
The in-vivo study was conducted using adult male SD rats. The study was approved by the Animal Ethics Committee, Universiti Sains Malaysia (USM/Animal Ethics Approval/2014/(94) (585)) based on the USM’s guidelines for the welfare of the animals “USM Guidelines for the Care and Use of Animals for Scientific Purposes (2012).” The rats were kept for 5 days in an animal transit room under the photo-period schedule of 12 hours light/12 hours dark prior to treatment to allow for acclimatization to the environment condition. Food and water were available ad libitum. The study was conducted as follows:
Induction of diabetes using streptozotocin (STZ)
Diabetes was induced by intra-peritoneal injection of STZ. On experimental day one, the rats were kept fasting overnight, but had free access to drinking water. STZ was dissolved in normal saline to a final concentration of 45 mg/ml and was injected at the dose 45 mg/kg body weight. Rats were returned to their cages, and given food and water for the next 3–4 days till the induction of diabetes. The blood glucose level was monitored using a blood glucose monitoring system (AccuChek Performa, Hoffman-La Roche) by taking samples from a rat tail vein. The rats showing fasting blood glucose level ≥250 mg/dL (13.7 mmol/L) were considered as diabetic and were selected for the studies.
Study design
Diabetic rats weighing 180–220 g were randomly divided into seven groups of six rats in each (n=6) (Table 2). The rats were fasted overnight before starting the treatment. Blood glucose level was measured at a pre-determined time. The lyophilized lnsF12-Tre2 formulation was dispersed in the distilled water (pH 4) and administered orally using a bulb tipped gavage needle. At the end of 8 hours (T8) of the study period, the rats from control and the treated groups were euthanized using pentobarbitone.
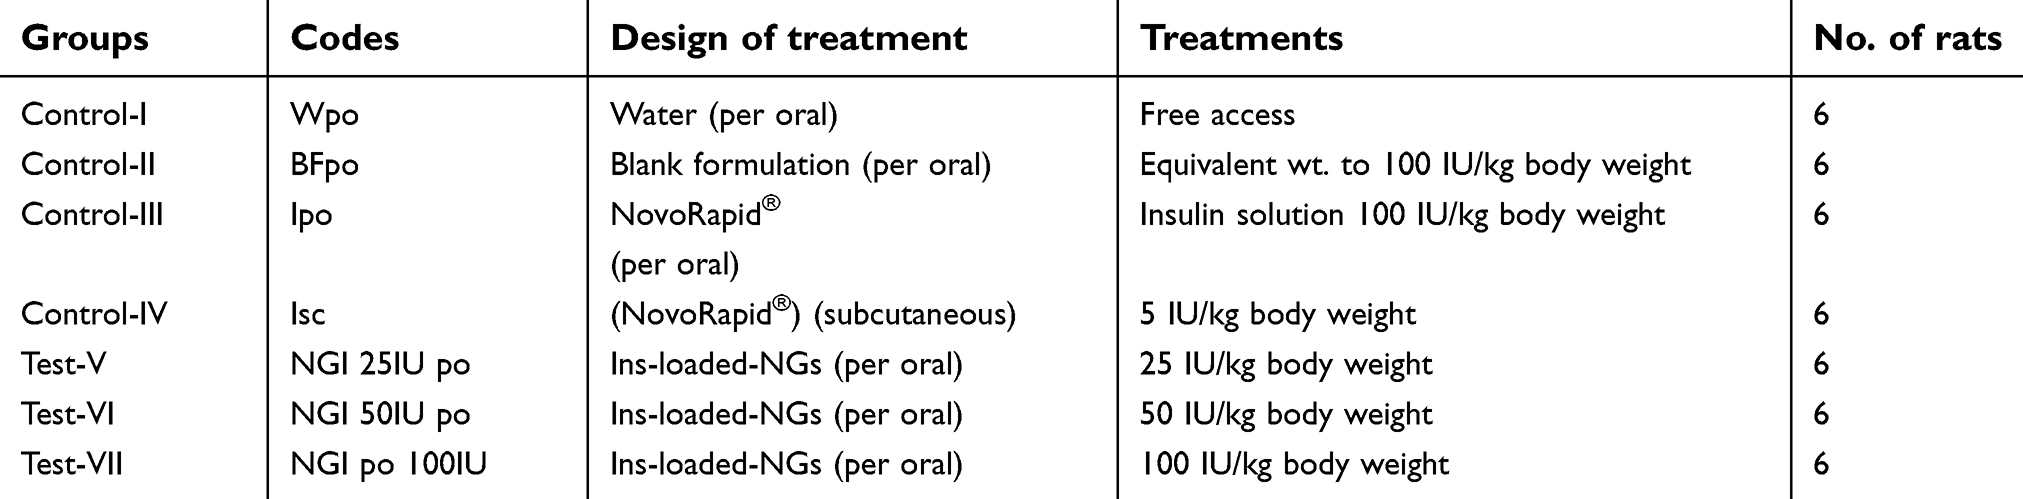 |
Table 2 Treatments received by diabetic rat groups for determination of blood glucose level |
Measurement of blood glucose level
A single drop of blood sample was collected from rat tail by a glucometer strip (AccuChek Performa, Hoffman-La Roche) and blood glucose level was measured at predetermined time intervals of 0 (immediately before receiving treatment), 2, 4, 6 and 8 hours from the start of treatment. The baseline level for each experimental group was the mean value of blood glucose measured immediately before treatment and was considered as 100%. Following the treatments, the percentage glucose reduction at subsequent time intervals was calculated from the baseline level.
Statistical analysis
The Statistical Analysis was performed by one-way ANOVA. For a significant difference, a post hoc Tukey’s HSD test was performed. All data are presented as mean values with standard deviations (mean ± SD). The differences were considered statistically significant when p≤0.05. The analysis was done using a statistical software IBM, SPSS version 22.
Results and discussion
Physical appearance and behavior of insulin at different pHs
Visual appearance of insulin solutions at different pHs was observed. Insulin solution was turbid between pH4.6 and 6.0, but clear below pH4.6 and above pH6.0 (Plate 1). This behavior was due to the proteinacious nature of insulin (ie presence of amino acid units). Amino acids possessed both acidic and basic ionizable groups which could be charged and uncharged depending upon the pH of the medium. However, at particular pH values the protein possessed no charge, which is referred to as the isoelectric point (PI). At pH near its PI, proteins tend to aggregate and show minimum solubility.10
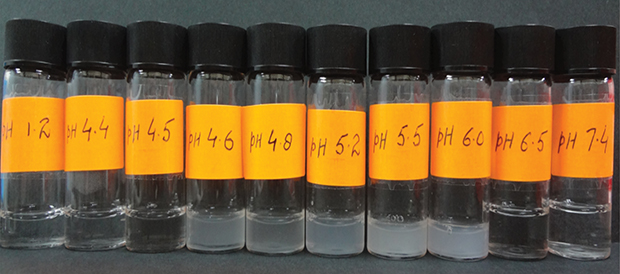 |
Plate 1 Physical appearance of insulin solution at different pH values. |
Formation of Ins/NGs-PEC
The polyelectrolyte complexation phenomenon was adopted to develop Ins/NGs-PEC in order to avoid damage to insulin. The interactions between insulin and polyelectrolyte nanogels are predominantly of electrostatic nature. This characteristic allows insulin to bind to polyanions at pH below PI (pH<PI) and polycations at pH above PI (pH>PI). The PI of insulin and nanogels were investigated using aqueous electrophoresis and the results are presented in Figure 1A and B. The curve of aqueous electrophoresis for insulin showed that the ZP of insulin changed from positive to negative as the pH was increased from 3.5 to 7 with the point of net zero charge (PI) observed around pH 4.8. Similarly, the curve of aqueous electrophoresis for nanogels also showed that the ZP of nanogels changed from positive to negative as the pH was increased from 1.5 to 7 with point of net zero charge (PI) observed around pH 2.78.
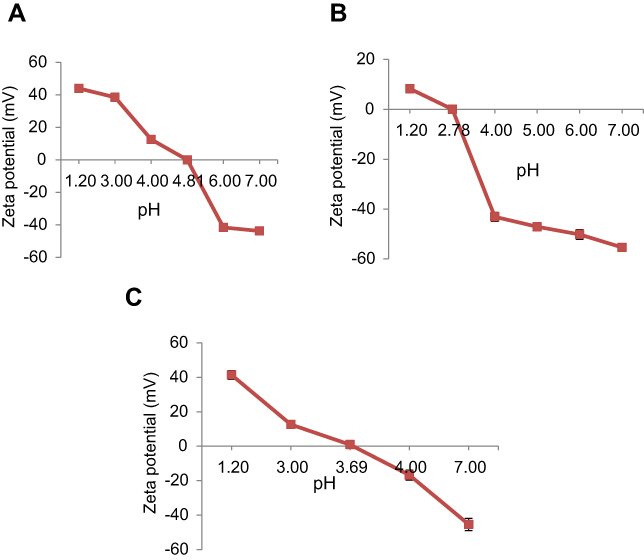 |
Figure 1 Determination of the isoelectric point in (A) Insulin, (B) Nanogels, and (C) Ins/NGs-PEC. Mean ± SD, n=3. |
The PEC formation (Ins/NGs-PEC) was confirmed using the following two techniques, by measuring 1) The PI of lns/NGs-PEC; and 2) The ZP of lns/NGs-PEC. In the first technique, PI of Ins/NGs-PEC was determined using aqueous electrophoresis and compared with PI of free insulin. The PI of Ins/NGs-PEC is presented in Figure 1C. The results show the PI of Ins/NGs-PEC at 3.69 pH, while the PI of free insulin at 4.81pH. Changing of the PI value indicated the formation of PEC between insulin and nanogels. A similar finding was reported by Schmittet al11 whereby the authors observed the PI value was changed following complex formation between β-lactoglobulin and acacia gum. In the second technique, the ZP value of Ins/NGs-PEC was compared with the ZP values of free insulin and free nanogels. The ZP value of free insulin, free nanogels and Ins/NGs-PEC at pH 4 were 12.60±0.62 mV, −43.17±1.81 mv and −16.77±0.50 mV, respectively. Thus, formation of complexation between insulin and nanogels had caused a decrease in the negative charge value of ZP from −43.17±1.81 mV to −16.77±0.50 mV at pH 4.0. This was expected because insulin had the net positive ZP (12.60±0.62 mV) at pH 4.0. Under this condition, the electrostatic attraction between insulin and nanogels would occur. Thus, insulin had offset the negative charge of nanogels, and consequently changed the ZP to less negative value. A similar observation was reported by Luo et al12 in the investigation of α-tocopherol/zein-chitosan (TOC/zein–CS) nanoparticles. In another study, Fan et al,13 indicated the successful layer-by-layer (LbL) deposition of Poly(α-β-L-malic acid) (PMA) and water-soluble chitosan (WSC) on the insulin particles by observing the shifting of ZP from positive to negative.
Optimization of Ins/NGs-PEC
Table 3 Shows the influence of Ins:NGs ratios, pH, incubation time and stirring rate on PS, PdI, ZP and % EE of the Ins/NGs-PEC.
 |
Table 3 Effect of Ins/NG ratios, pH, incubation times and stirring rates on Ins/NGs-PEC properties |
Effect of Ins:NGs ratios
InF1, InF2, InF3 and InF4 formulations were prepared using lns:NGs ratios of 1:20, 1:30, 1:40 and 1:50, respectively. The other parameters were kept constant and set as follows: pH 4, incubation time of 6 hours and stirring rate of 100 rpm. It was observed that PS and PdI were significantly higher (p<0.05), while ZP and %EE were significantly lower (p<0.05) at Ins:NGs ratios of 1:20 (lnF1) than 1:30 (lnF2) and 1:40 (lnF3). The PS was out of nano range and the PdI value was 1. The possible reason for higher PS and PdI of InF1 might be due to its ZP being low (−9.05±0.153 mV), which may cause aggregation of particles. However, there were no significant changes (p>0.05) in PS, PdI, ZP and %EE when the Ins:NGs ratio was further increased from 1:40 (InF3) to 1:50 (InF4). Nam et al14 also reported similar findings in the insulin-loaded nanoparticles through the polyelectrolyte complex formation using low molecular weight water soluble chitosan (LMWSC). They found the particle size increased, according to the amount of insulin incorporated.
The ZP-value of Ins/NGs-PEC can be negative or positive depending upon the dominant component of the polyelectrolyte complex (insulin or nanogels). All the formulations (InF1, InF2, InF3 and InF4) prepared at different Ins:NGs ratios were found to have a negative charge of ZP. This could be due to the contribution of negative charge from nanogels exceeding the positive charge of insulin at the investigated Ins:NGs ratios of 1:20, 1:30, 1:40 and 1:50. A similar finding was reported by Lin et al15 in the investigation of nanoparticles prepared using chitosan/γ-glutamic acid (CS/γ-PGA) at a ratio of 4.5:1.0 (w/w). They observed at the weight ratio used, the formulation had a positive charge of ZP. This is because at this ratio the positively charged CS was significantly higher than the negatively charged γ-PGA.
Therefore, based on the results of PS, PdI, ZP and % EE, the Ins:NGs ratio of 1:40 (InF3) was found to be optimum and this ratio was used for further studies in the optimization of pH.
Effect of pH
InF5, InF6 and InF7 formulations were prepared at different pHs of 1.2, 4.0 and 7.4, respectively. Other parameters such as lns:NGs ratio of 1:40, incubation time of 6 hours, stirring rate of 100 rpm were kept constant. The PS and PdI of lnF5 formulation prepared at pH 1.2 were significantly higher (p<0.05), than InF6 prepared at pH 4.0. While the ZP and % EE were significantly lower compared to lnF6 formulation prepared at pH 4.0. Bigger PS at pH 1.2 could be due to the binding of the aggregated protein onto anionic polymers (nanogels) in the acidic medium.16,17 Another possible explanation for the increase in PS at pH 1.2 is based on aggregation of nanogels at pH below its pKa value. However, further increasing the pH from 4.0 to 7.4 had no significant effect (p>0.05) on PS, but PdI and %EE were decreased significantly (p<0.05), while the negative charge of ZP increased significantly (p<0.05) from −16.70±0.50 mV (InF6) to −48.60±0.50 mV(InF7).
The driving force for the complexation of insulin and nanogel was mainly due to hydrophobic interaction. Lower %EE at pH 1.2 (below PI of insulin and nanogels), could be due to both insulin and nanogel possessing positive charges and repelling each other. While higher %EE at pH 4.0 (below the PI of insulin), could be due to insulin exhibiting a positive charge and interacting with negatively charged carboxyl functional groups of nanogels. At pH 7.4 (above PI of insulin and nanogels), both insulin and nanogel possess negative charges and repel each other, hence they had lower %EE. Among the formulations studied lnF6, which was prepared at pH 4 had the best characteristics of PS, PdI, ZP and %EE. Thus, pH 4.0 was selected for further study in the optimization of the incubation time.
Effect of incubation time
InF8, InF9 and InF10 formulations were prepared at incubation times of 4, 6 and 8 hours, while other parameters, such as lns:NGs ratio of 1:40, pH 4 and stirring rate of 6 hours, were kept constant. There was no significant difference (p>0.05) in the PS, but PdI and %EE were significantly increased, while the negative charge of ZP was significantly decreased (p<0.05) when incubation time was increased from 4 to 6 hours. However, there was no significant change (p>0.05) in PS, ZP and %EE when incubation time was prolonged from 6 to 8 hours. Therefore, based on the results obtained the 6-hour incubation period used to prepare the InF9 formulation was considered optimum and was selected for further studies in the optimization of the stirring rate.
Effect of stirring rate
InF11, InF12 and InF13 formulations were prepared at a stirring rate of 0, 100 and 200 rpm, respectively. Other parameters including ln:NGs ratio of 1:40, pH 4 and incubation time of 6 hours were kept constant. The PS, PdI and ZP were decreased significantly (p<0.05) but the %EE was increased significantly (p<0.05) when the strrring rate was increased from 0 to 100 rpm. Increasing the stirring rate further to 200 rpm did not significantly (p>0.05) reduce the PS, but decreased the PdI and %EE significantly (p<0.05), while the ZP increased significantly (p<0.05). The possible influences of a stirring rate could be explained as follows: Deposition of insulin on nanogel surface was facilitated at a stirring rate of 100 rpm. At this stirring rate, the insulin molecules could reach the absorption surface of nanogels rapidly and interact electrostatically, hence resulting in a higher %EE. However, the % EE was lower when the stirring rate was increased to 200 rpm. This could be due to the faster agitation of the solution causing the loosely bound insulin molecules on the nanogels surface to detach, hence less formation of a complex between insulin and nanogel. A similar finding was observed at a stirring rate of 0 rpm (without stirring), whereby the %EE were also low which could be due to the longer time needed to reach equilibrium for deposition of insulin on the nanogels surface. Thus, based on these findings, the InF12 formulation prepared at a stirring rate of 100 rpm, lns: NGs ratio of 1:40, pH 4 and incubation time of 6 hours were selected for further study.
Lyophilization study
Lyophilization is a commonly used technique to improve stability during storage by converting a colloidal formulation into a solid preparation. However, during the lyophilization process, the preparation encountered various stresses. Therefore, a cryoprotectant such as trehalose is usually used to protect the sample during lyophilization process. The lnF12 formulation was lyophilized in the presence of 0.5, 1, 2 and 3% w/v trehalose and the formulations were given codes InF12-Tre0.5, InF12-Tre1, InF12-Tre2 and InF12-Tre3, respectively. The results of PS , PdI, ZP and % EE are presented in Table 4. Before lyophilization the lnF12 formulation had a PS, PdI, ZP and %EE of 190.4±0.90 nm, 0.186±0.023, −16.70±0.50 mV, and 85.20±2.33, respectively. Lyophilization of the lnF12 formulation without trehalose caused its particles to collapse, aggregate and strongly stick to the wall of the tube and upon reconstitution the formulation (InF-12) could not be redispersed. Similar results were also observed when 0.5% w/v trehalose was used during lyophilization of InF12-Tre0.5. Thus, the PS, PDI, ZP and %EE of the formulations (InF12 and InF12-Tre0.5) could not be measured. However, increasing the trehalose concentration from 0.5 (InF12-Tre0.5) to 1 (InF12-Tre1), 2 (InF12-Tre2) and 3%w/v (InF12-Tre3) had produced free flowing particles, and after reconstituting the formulations were easily redispersed. The PS of the formulations (InF12-Tre1, InF12-Tre2 and InF12-Tre3) were increased significantly (p<0.05) in comparison to PS of lnF12 before lyophilization, but the PS was still in the nano range. Increasing of PS could be due to aggregation of particles during lyophilization process. Among the concentrations of trehalose used during lyophilization, 2 w/v% (InF12-Tre2) was considered the optimum as increasing the concentration to 3 w/v% (InF12-Tre3) did not improve the characteristics of the formulation. Therefore, InF12-Tre2 which had a PS, PDI, ZP and %EE of 430.50±27.61, 0.588±0.094, −16.50±0.60 and 82.10±2.12, respectively was chosen as an optimized formulation for further investigation.
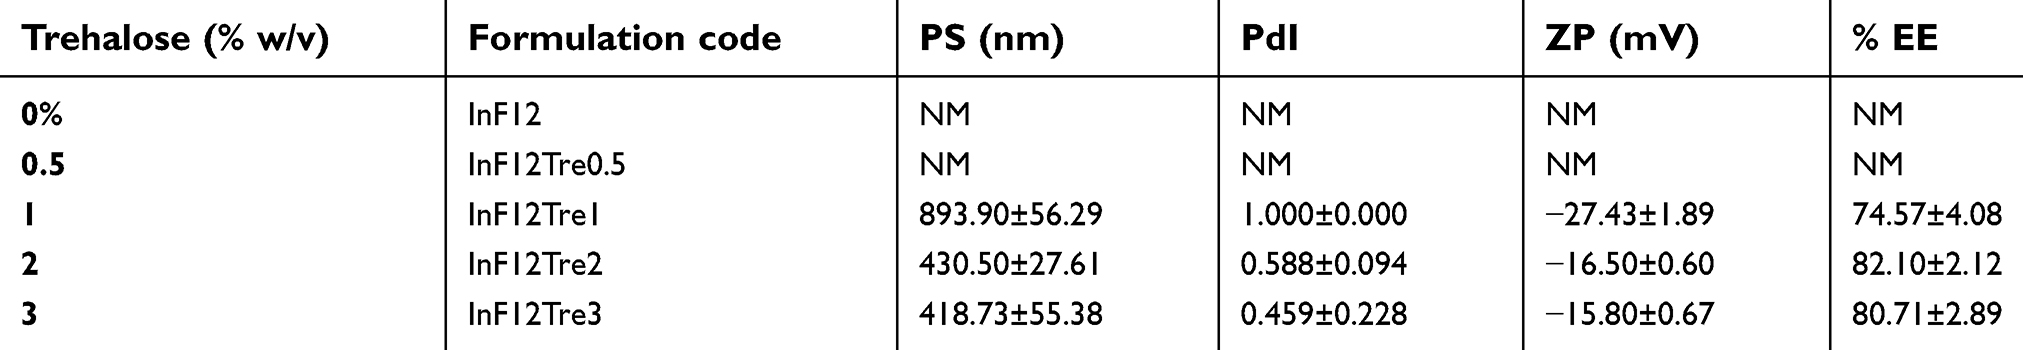 |
Table 4 Lyophilization of InF-12 formulation using trehalose as a cryoprotectant. Mean ± SD, n=3 |
In-vitro release study
The release profiles of insulin from the liquid formulation of InF12 and lyophilized formulation of InF12-Tre2 in the simulating gastric fluid (SGF) at pH 1.2 and intestinal fluid (SIF) at pH 6.8 are presented in Figure 2A and B, respectively. There were no significant differences (p>0.05) in the insulin release from InF12 (32.45±3.88%) and InF12-Tre2 (28.94±3.48%) formulations in the SGF medium up to 8 hours (Figure 2A and B). The retardation of insulin release at pH 1.2 in both formulations might be due to the fact that the nanogel did not swell and formed tight shrunken (un-swollen) nanogel network in highly acidic media. This hindered the diffusion and resulted in lower release of insulin from both formulations in the acidic medium. Another reason could be the involvement of hydrophobic interaction as dominating factor which facilitated strong binding and attachment of insulin and nanogels at acidic pH.18,19 In contrast, the release of insulin from InF12 and InF12-Tre2 formulations in SIF (at pH 6.8) were rapid. In the first 15 mins, InF12 formulation released a significantly higher (p<0.05) percentage of insulin (80.46±5.01%) than the InF12-Tre2 formulation (63.55±5.52%) (Figure 2A and B). However, there were no significant differences (p<0.05) in the total percentage of insulin release from lnF12 (91.43±4.50%) and InF12-Tre2 (96.53±4.95%) formulations at the end of 8 hours. The possible reasons for the rapid insulin release from both formulations in the SIF (pH 6.8) could be due to the swelling, diffusion and erosion process.20 At basic and neutral pH, nanogels showed higher swelling due to ionization of carboxylic groups. As nanogels swelled to the maximum capacity, the erosion of nanogel networks was initiated, which facilitated the release of entrapped drugs.
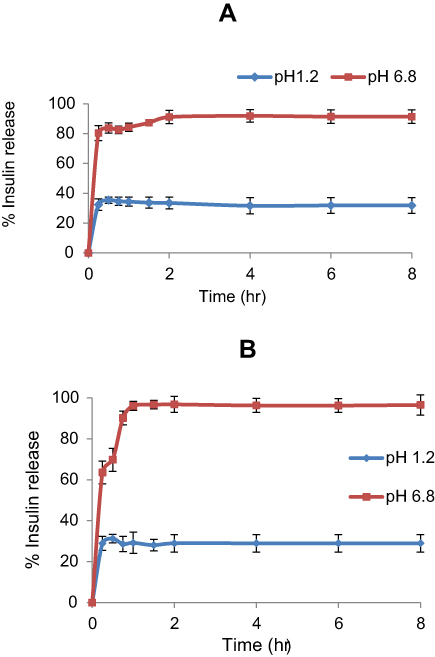 |
Figure 2 In-vitro release of insulin from (A) Liquid formulation of InF-12, and (B) Lyophilized formulation of InF12-Tre2 in SGF (pH 1.2) and SIF (pH 6.8) at 37°C. Mean ± SD, n=3. Abbreviations: SGF, Simulated gastric fluid; SIF, Simulated intestinal fluid. |
Cui et al21 reported similar findings for the in-vitro release of insulin from carboxylated chitosan grafted poly (methyl methacrylate) nanoparticle (CCGN). They observed a slow release rate of insulin at pH 2, but a fast release rate at pH 6.8 and pH 7.4. In another study, Karnoosh-Yamchi et al22 reported the in vitro insulin release from N-iso-propylacrylamide-methacrylic acid-hydroxy ethyl methacrylate (NIPAAm–MAA–HEM) nanohydrogel was lower at pH 1.2 and higher at pH 6.8.
FTIR spectra
The FTIR spectra of A) insulin, B) nanogels, C) trehalose, D) lyophilized blank formulation containing trehalose, and E) InF12-Tre2 formulation is presented in Figure 3. The insulin shows a characteristic broad peak at 1649 cm–1.23 The FTIR spectra of nanogels shows increased peak intensity of the C=O group at 1731.49 cm–1 which was associated with the presence of the additional C=O groups from itaconic acid. Additionally, the spectra also show a broader peak in the range of 3700–3100 cm–1 which suggested the OH stretching vibrations of carboxylic groups of itaconic acid. The FTIR spectrum of InF12-Tre2 formulation showed the characteristic peaks of nanogels and insulin had shifted, which indicated that the insulin was encapsulated in the nanogels network.24
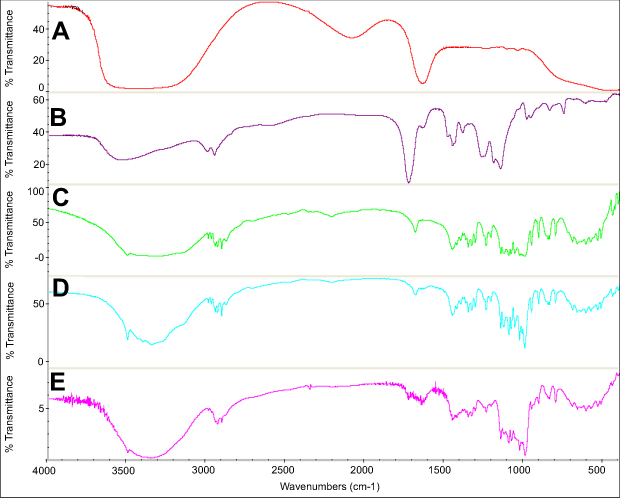 |
Figure 3 FTIR spectra of (A) Insulin, (B) Nanogels, (C) Trehalose, (D) Lyophilized blank formulation, and (E) Lyophilized InF12-Tre2. |
Evaluation of insulin integrity
Insulin may be degraded/or undergo aggregation during encapsulating procedures and within the microenvironment of nanocarriers.25 SDS-PAGE provides information on the primary structural integrity of proteins. Therefore, the structural integrity of insulin in InF12-Tre2 was assayed using SDS-PAGE. Figure 4 shows the SDS-PAGE analysis of a marker (unstained low molecular weight ranges protein ladder) in lane 1, insulin released from InF12-Tre2 (in PBS at pH 6.8) in lane 2 and standard insulin (Novorapid®) in lane 3. The results revealed that standard insulin and insulin released from InF12-Tre2 travelled to the same level of 5.8 kDa, compared to the unstained standard protein ladder. Moreover, no lower or higher band was observed in lane 2, which indicated the absence of degradation product or formation of aggregated product in the SDS-PAGE analysis. These findings suggested that the structural integrity of insulin was preserved in the lyophilized formulation (InF12-Tre2). Similar finding was also reported by Alibolandi et al26 using SDS-PAGE assays to show the structural integrity of loaded insulin. In another study, Hurkat et al27 also used SDS-PAGE to confirm the stability of loaded insulin in the amphiphilic copolymers of dextran (DEX) 5000–poly (lactic-coglycolic acid) (PLGA).
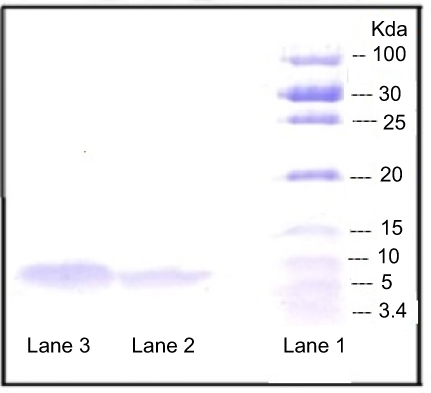 |
Figure 4 SDS-PAGE results. Lane 1: Unstained low range protein ladder; Lane 2: Insulin released from formulation; Lane 3: Standard insulin. |
TEM examination
The TEM images in Figure 5 revealed that the particle of InF12 formulation had spherical shape and the size was <200 nm. However, the reconstituted InF12-Tre2 formulation displayed irregular shape and PS was increased, but it was still in the nano range (<500 nm).
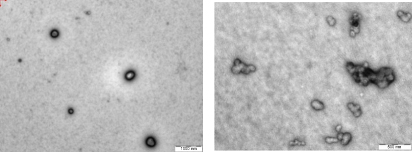 |
Figure 5 TEM of (A) InF12 before lyophilization and (B) Reconstituted lyophilized InF12-Tre2 after lyophilization. |
Stability study
The InF12-Tre2 formulations stored at 5±3°C and 25±2°C/75±15%RH were observed visually. The flow ability as well as the ease of re-dispersion of InF12-Tre2 formulation stored at 5±3°C was preserved up to 3 months of the study period. However, the InF12-Tre2 formulations stored at 25±2°C/75±15%RH became sticky and aggregation of particles was seen after 1 month storage.
The PS, PdI, ZP of InF12-Tre2 formulation stored at 5±3°C and 25±2°C/75±15%RH were measured for 3 months, and the results are presented in Table 5. There was no significant (p>0.05) change in the PS, PdI, ZP and %drug content of the InF12-Tre2 samples stored at 5±3°C during the 3-month study period. However, after 1 month of the stability study the PS and PdI of the InF12-Tre2 samples stored at 25±2°C/75±15%RH were not measured because the samples were sticky and the particles aggregated. The aggregation of particles may be induced by hydrophobic polymer-protein interaction, which occurred during storage at room temperature.28,29 The drug content was reduced and ZP was increased significantly (p>0.05). The decrease in the % insulin content of the InF12-Tre2 formulation stored at room temperature could be due to degradation of insulin by deamidation and dimer formation.30,31
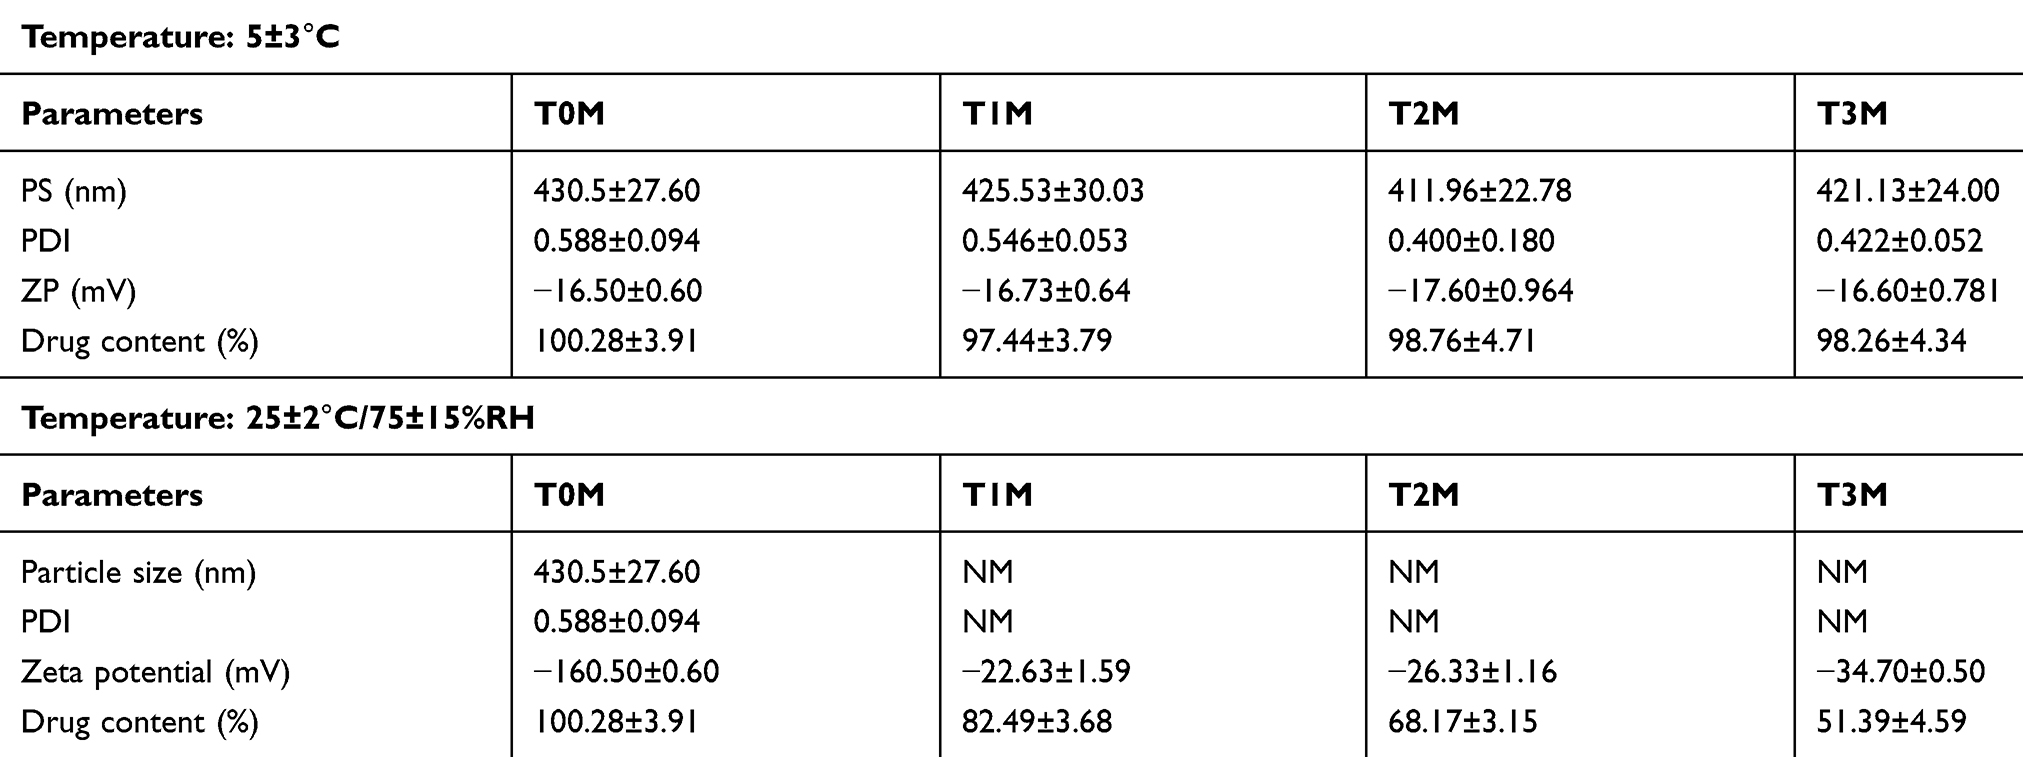 |
Table 5 The stability data of InF12-Tre2 formulation stored at 5±3°C and 25±2°C/75±15%RH. Mean ± SD, n=3 |
In-vitro release study of formulation stored at 5±3°C
The in-vitro release profiles of insulin from the InF12-Tre2 formulation stored at 5±3°C in SGF and SIF at T0M, T1M, T2M and T3M are presented in Figure 6A and B. There was no significant (p>0.05) difference in the % insulin release in SGF and SIF during the 3-month study period. These results suggested that the InsF12-Tre2 formulation stored at 5±3°C was stable throughout the study period.
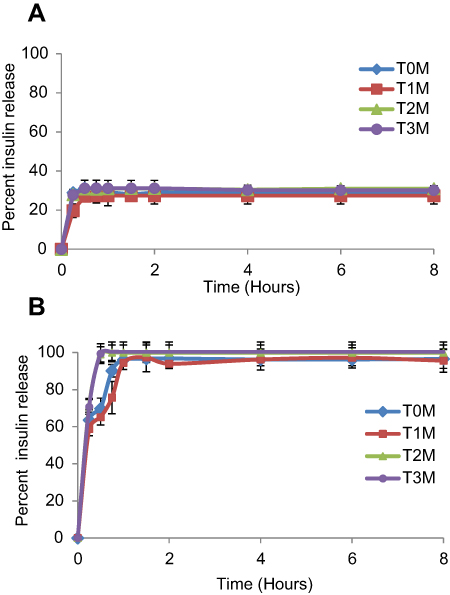 |
Figure 6 In-vitro release profile of lyophilized InF12-Tre2 formulation stored at 5±3°C in (A) SGF, and (B) SIF. Mean ± SD, n=3. Abbreviations: SGF, Simulated gastric fluid; SIF, Simulated intestinal fluid; T0M, Time at zero month (immediately after preparation); T1M, Time at one month; T2M, Time at two months; T3M, Time at three months. |
In-vivo evaluations
Determination of blood glucose level
The effect of InF12-Tre2 formulation on blood glucose level of diabetic rats is summarized in Figure 7. The percentage reduction in blood glucose was considered as evidence of insulin absorption. The response to orally administered InF12-Tre2 formulation was presented by plotting the percentage of blood glucose reduction from initial blood glucose level (100%) vs time. The rat’s blood glucose measured just before starting of the treatment (at time=0) was considered as initial blood glucose level and was taken as 100%. Subsequent percentage of blood glucose reduction was measured at predetermined time intervals of 2, 4, 6 and 8 hours. Control groups were treated with water per oral (Wpo), blank formulation per oral (BFpo) and insulin solution per oral (Ipo) for comparison with the oral doses of InF12-Tre2 formulation. There was no significant difference (p>0.05) in the blood glucose level among the three control groups (Wpo, BFpo and Ipo) up to the end of the 8-hour study period. Therefore, the administration of blank formulation per oral (BFpo) and insulin solution per oral (Ipo) had no effect on blood glucose level and the response was similar to the control group treated with water per oral (Wpo). The details of control and experimental groups are presented in Table 2.
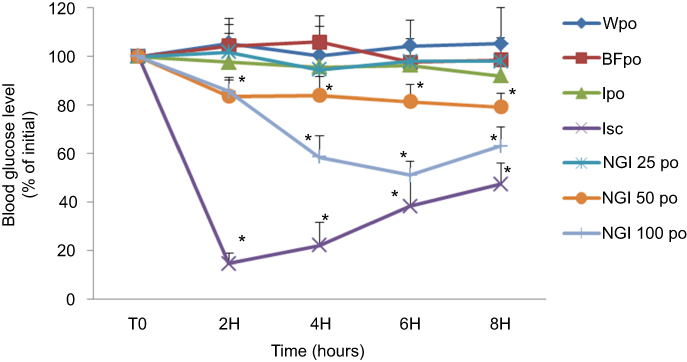 |
Figure 7 Effect of oral administration of the three doses (25, 50 and 100 IU/kg body weight) of lnF12-Tre2 and four control groups on the percentage reductions in blood glucose level in the streptozotocin-induced diabetic rats.*Statistically significant difference to BFpo. Mean ± SD, n=6. Data points represent relative values of the initial blood glucose concentration.Abbreviations: Wpo, water per oral; BFpo, blank formulations per oral; Ipo, insulin per oral; Isc, insulin subcutaneous; NGI 25 po, InF12-Tre2 containing insulin 25 IU per oral; NGI 50 po, InF12-Tre2 containing insulin 50 IU per oral; NGI 100 po, InF12-Tre2 containing insulin 100 IU per oral. |
Subcutaneous insulin injection (Isc) at the dose of 5IU/kg was also administered as control to observe an acute and rapid hypoglycemic effect of insulin. The subcutaneous administration of insulin (Novorapid®) showed the blood glucose level reduced to 14.67±4.24% within 2 hours of administration. At 8 hours after subcutaneous injection, the hypoglycemic effect of insulin was decreased, and hence the blood glucose level returned to 47.50±8.70%. These results suggested that the subcutaneous injection significantly (p<0.05) reduced the blood glucose level of diabetic rats compared to the three control groups (Wpo, BFpo and Ipo) within 2 hours.
Among the three doses of InF12Tre2 nanogels, 50 and 100 IU/kg (NGI 50po and NGI 100po) had the stronger hypoglycemic effect within 6 hours compared to control groups (Wpo, BFpo and Ipo). The blood glucose level was considered 100% at the start of the experiment. The blood glucose level after 6 hours was decreased significantly (p<0.05) to 81.50±6.86% and 51.10±5.50% following oral administration of NGI 50po and NGI 100po, respectively. However, there were no significant differences (p>0.05) in the blood glucose levels of NGI 50 po (79.30±5.41%) and NGI 100po (63.00±8.00%) measured at 8 hours compared to 6 hours. Administration of 25 IU/kg dose (NGI 25po) had not reduced the blood glucose level significantly (p>0.05) over the same study period of 8 hours. These results revealed that the oral InF12-Tre2 nanogels showed a dose-dependent hypoglycemic effect. The reduction of blood glucose level in the diabetic rats suggested the release of insulin from InF12-Tre2 nanogels in the small intestine was in accordance with the finding in the in-vitro release study. The results also reflected appreciably increased in insulin absorption by the lnF12-Tre2 nanogels. Mukhopadhyay et al32 also showed reduction in blood glucose levels following oral administration of chitosan/insulin nanoparticles at doses of 50 and 100 IU/kg body weight. In another study Sarmento et al19 investigated the oral insulin-loaded alginate/chitosan nanoparticles at doses of 25, 50 and 100 IU/kg body weight. The authors reported faster blood glucose level reduction at the dose of 100 as compared to 50 and 25 IU/kg body weight.
The results of blood glucose suggested that the InF12-Tres nanogels had improved insulin absorption administered orally. This was probably through the following mechanisms: 1) pH-responsive behavior of nanogel might have protected insulin from degradation in the acidic environment of GIT; 2) Carboxylic acid functional group in the nanogel might have deactivated the proteolytic enzymes to protect insulin from degradation by digestive enzymes in GIT; and 3) Carboxylic acid functional groups in the nanogels might have opened the intestinal tight junctions to facilitate the paracellular transport of insulin.33
Conclusions
The pH sensitive MMA/IA polyelectrolyte nanogels were used as carriers to deliver insulin orally. Insulin was entrapped in the nanogels by using the PEC method. The final formulation of lyophilized lnF12-Tre2 nanogels was successfully developed and optimized. The particle size of the nanogels was in the nano range. The SDS-PAGE assay revealed that the insulin structure in lnF12-Tre2 nanogels was still intact. The lnF12-Tre2 nanogels were stable at 5±3°C storage condition during the 3-month stability study. The oral administration of InF12-Tre2 nanogels to diabetic rats had reduced the blood glucose significantly. Therefore, it is suggested that the oral ln12-Tres2 nanogels have the potential to be used as an alternative route for delivery of insulin.
Acknowledgments
The authors would like to thank the Ministry of Education Malaysia and Universiti Sains Malaysia for providing Fundamental Research Grant Scheme (203/PFarmasi/6711450 and the Research University Grant (1001/PFarmasi/811285), respectively. The authors (Jahanzeb Mudassir and Arshad Ali Khan) gratefully acknowledge Universiti Sains Malaysia, Penang, Malaysia for the granting of Fellowships.
Disclosure
The authors report no conflicts of interest in this work.
References
1. Lowman A, Morishita M, Kajita M, Nagai T, Peppas N. Oral delivery of insulin using pH‐responsive complexation gels. J Pharm Sci. 1999;88(9):933–937. doi:10.1021/js980337n
2. Márquez-Beltrán C, Castañeda L, Enciso-Aguilar M, et al. Structure and mechanism formation of polyelectrolyte complex obtained from PSS/PAH system: effect of molar mixing ratio, base–acid conditions, and ionic strength. Colloid Polym Sci. 2013;291(3):683–690. doi:10.1007/s00396-012-2775-y
3. Hartig SM, Greene RR, Dikov MM, Prokop A, Davidson JM. Multifunctional nanoparticulate polyelectrolyte complexes. Pharm Res. 2007;24(12):2353–2369. doi:10.1007/s11095-007-9459-1
4. Delair T. Colloidal polyelectrolyte complexes of chitosan and dextran sulfate towards versatile nanocarriers of bioactive molecules. Eur J Pharm Biopharm. 2011;78(1):10–18. doi:10.1016/j.ejpb.2010.12.001
5. Woodley J, Bernkop-Schnürch A. Oral Delivery of Macromolecular Drugs: Barriers, Strategies and Future Trends. Springer 2009.
6. Schatz C, Lucas J-M, Viton C, Domard A, Pichot C, Delair T. Formation and properties of positively charged colloids based on polyelectrolyte complexes of biopolymers. Langmuir. 2004;20(18):7766–7778. doi:10.1021/la049460m
7. Ameye D, Voorspoels J, Foreman P, et al. Trypsin inhibition, calcium and zinc ion binding of starch–g-poly (acrylic acid) copolymers and starch/poly (acrylic acid) mixtures for peroral peptide drug delivery. J Controlled Release. 2001;75(3):357–364.
8. Lueßen HL, Verhoef JC, Borchard G, Lehr C-M, de Boer ABG, Junginger HE. Mucoadhesive polymers in peroral peptide drug delivery. II. Carbomer and polycarbophil are potent inhibitors of the intestinal proteolytic enzyme trypsin. Pharm Res. 1995;12(9):1293–1298.
9. Mudassir J, Darwis Y, Yusof SR. Synthesis, characterization and toxicological evaluation of pH-sensitive polyelectrolyte Nanogels. J Polym Res. 2017;24(10):164. doi:10.1007/s10965-017-1321-5
10. Tanford C, Epstein J. The Physical Chemistry of Insulin. I. Hydrogen ion titration curve of zinc-free insulin1-3. J Am Chem Soc. 1954;76(8):2163–2169. doi:10.1021/ja01637a035
11. Schmitt C, Sanchez C, Thomas F, Hardy J. Complex coacervation between β-lactoglobulin and acacia gum in aqueous medium. Food Hydrocoll. 1999;13(6):483–496. doi:10.1016/S0268-005X(99)00032-6
12. Luo Y, Zhang B, Whent M, Yu LL, Wang Q. Preparation and characterization of zein/chitosan complex for encapsulation of α-tocopherol, and its in vitro controlled release study. Colloids Surf B. 2011;85(2):145–152. doi:10.1016/j.colsurfb.2011.02.020
13. Fan Y, Wang Y, Fan Y, Ma J. Preparation of insulin nanoparticles and their encapsulation with biodegradable polyelectrolytes via the layer-by-layer adsorption. Int J Pharm. 2006;324(2):158–167. doi:10.1016/j.ijpharm.2006.05.062
14. Nam J-P, Choi C, Jang M-K, et al. Insulin-incorporated chitosan nanoparticles based on polyelectrolyte complex formation. Macromol Res. 2010;18(7):630–635. doi:10.1007/s13233-010-0714-7
15. Lin Y-H, Chen C-T, Liang H-F, et al. Novel nanoparticles for oral insulin delivery via the paracellular pathway. Nanotechnology. 2007;18(10):105102. doi:10.1088/0957-4484/18/49/495102
16. Yoshida K, Hashide R, Ishii T, Takahashi S, Sato K, Anzai J-I. Layer-by-layer films composed of poly (allylamine) and insulin for pH-triggered release of insulin. Colloids Surf B. 2012;91:274–279. doi:10.1016/j.colsurfb.2011.11.017
17. Yoshida K, Sato K, Anzai J-I. Layer-by-layer polyelectrolyte films containing insulin for pH-triggered release. J Mater Chem. 2010;20(8):1546–1552. doi:10.1039/B918226H
18. Chen Y, Zheng X, Qian H, Mao Z, Ding D, Jiang X. Hollow core− porous shell structure poly (acrylic acid) nanogels with a superhigh capacity of drug loading. ACS Appl Mater Interfaces. 2010;2(12):3532–3538. doi:10.1021/am100709d
19. Sarmento B, Ribeiro A, Veiga F, Sampaio P, Neufeld R, Ferreira D. Alginate/chitosan nanoparticles are effective for oral insulin delivery. Pharm Res. 2007;24(12):2198–2206. doi:10.1007/s11095-007-9367-4
20. Chen L, Remondetto G, Rouabhia M, Subirade M. Kinetics of the breakdown of cross-linked soy protein films for drug delivery. Biomaterials. 2008;29(27):3750–3756. doi:10.1016/j.biomaterials.2008.05.025
21. Cui F, Qian F, Zhao Z, Yin L, Tang C, Yin C. Preparation, characterization, and oral delivery of insulin loaded carboxylated chitosan grafted poly (methyl methacrylate) nanoparticles. Biomacromolecules. 2009;10(5):1253–1258. doi:10.1021/bm900035u
22. Karnoosh-Yamchi J, Mobasseri M, Akbarzadeh A, et al. Preparation of pH sensitive insulin-loaded Nano hydrogels and evaluation of insulin releasing in different pH conditions. Mol Biol Rep. 2014;41(10):6705–6712. doi:10.1007/s11033-014-3553-3
23. Mauri S, Volk M, Byard S, Berchtold H, Arnolds H. Stabilization of insulin by adsorption on a hydrophobic silane self-assembled monolayer. Langmuir. 2015;31(32):8892–8900. doi:10.1021/acs.langmuir.5b01477
24. Mukhopadhyay P, Chakraborty S, Bhattacharya S, Mishra R, Kundu P. pH-sensitive chitosan/alginate core-shell nanoparticles for efficient and safe oral insulin delivery. Int J Biol Macromol. 2015;72:640–648. doi:10.1016/j.ijbiomac.2014.08.040
25. Chalasani KB, Russell-Jones GJ, Jain AK, Diwan PV, Jain SK. Effective oral delivery of insulin in animal models using vitamin B12-coated dextran nanoparticles. J Controlled Release. 2007;122(2):141–150. doi:10.1016/j.jconrel.2007.05.019
26. Alibolandi M, Alabdollah F, Sadeghi F, et al. Dextran-b-poly (lactide-co-glycolide) polymersome for oral delivery of insulin: in vitro and in vivo evaluation. J Controlled Release. 2016;227:58–70. doi:10.1016/j.jconrel.2016.02.031
27. Hurkat P, Jain A, Jain A, Shilpi S, Gulbake A, Jain SK. Concanavalin A conjugated biodegradable nanoparticles for oral insulin delivery. J Nanopart Res. 2012;14(11):1219. doi:10.1007/s11051-012-1219-4
28. Ibrahim MA, Ismail A, Fetouh MI, Göpferich A. Stability of insulin during the erosion of poly (lactic acid) and poly (lactic-co-glycolic acid) microspheres. J Controlled Release. 2005;106(3):241–252. doi:10.1016/j.jconrel.2005.02.025
29. Péan J-M, Venier-Julienne M-C, Boury F, Menei P, Denizot B, Benoit J-P. NGF release from poly (D, L-lactide-co-glycolide) microspheres. Effect of some formulation parameters on encapsulated NGF stability. J Controlled Release. 1998;56(1):175–187.
30. Shao PG, Bailey LC. Porcine insulin biodegradable polyester microspheres: stability and in vitro release characteristics. Pharm Dev Technol. 2000;5(1):1–9. doi:10.1081/PDT-100100513
31. Shao PG, Bailey LC. Stabilization of pH-induced degradation of porcine insulin in biodegradable polyester microspheres. Pharm Dev Technol. 1999;4(4):633–642. doi:10.1081/PDT-100101402
32. Mukhopadhyay P, Sarkar K, Chakraborty M, Bhattacharya S, Mishra R, Kundu P. Oral insulin delivery by self-assembled chitosan nanoparticles: in vitro and in vivo studies in diabetic animal model. Mater Sci Eng C. 2013;33(1):376–382. doi:10.1016/j.msec.2012.09.001
33. Mudassir J, Darwis Y, Khiang PK. Prerequisite characteristics of nanocarriers favoring oral insulin delivery: nanogels as an opportunity. Int J Polym Mater Polym Biomater. 2015;64(3):155–167. doi:10.1080/00914037.2014.921919
 © 2019 The Author(s). This work is published and licensed by Dove Medical Press Limited. The full terms of this license are available at https://www.dovepress.com/terms.php and incorporate the Creative Commons Attribution - Non Commercial (unported, v3.0) License.
By accessing the work you hereby accept the Terms. Non-commercial uses of the work are permitted without any further permission from Dove Medical Press Limited, provided the work is properly attributed. For permission for commercial use of this work, please see paragraphs 4.2 and 5 of our Terms.
© 2019 The Author(s). This work is published and licensed by Dove Medical Press Limited. The full terms of this license are available at https://www.dovepress.com/terms.php and incorporate the Creative Commons Attribution - Non Commercial (unported, v3.0) License.
By accessing the work you hereby accept the Terms. Non-commercial uses of the work are permitted without any further permission from Dove Medical Press Limited, provided the work is properly attributed. For permission for commercial use of this work, please see paragraphs 4.2 and 5 of our Terms.