Back to Archived Journals » International Journal of Wine Research » Volume 6
Segmentation and drivers of wine liking and consumption in US wine consumers
Authors Pickering G ![]() , Jain A, Bezawada R
, Jain A, Bezawada R
Received 11 July 2014
Accepted for publication 5 August 2014
Published 16 October 2014 Volume 2014:6 Pages 9—19
DOI https://doi.org/10.2147/IJWR.S70958
Checked for plagiarism Yes
Review by Single anonymous peer review
Peer reviewer comments 2
Editor who approved publication: Dr Roger Pinder
Gary J Pickering,1–3 Arun K Jain,4 Ram Bezawada4
1Department of Biological Sciences, Brock University, St Catharines, ON, Canada; 2Cool Climate Oenology and Viticulture Institute, Brock University, St Catharines, ON, Canada; 3Department of Psychology, Brock University, St Catharines, ON, Canada; 4School of Management, University at Buffalo, Buffalo, NY, USA
Abstract: This study examined the influence of selected experiential (wine expertise), psychological (alcoholic beverage adventurousness), and biological (age, sex, 6-n-propylthiouracil [PROP] responsiveness) factors on self-reported liking and consumption of 14 wine styles in a sample of 1,010 US wine consumers. Cluster analysis of wine liking scores revealed three distinct groups, representing plausible market segments, namely red wine lovers, dry table wine likers and sweet dislikers, and sweet wine likers. These clusters differ in key demographic measures, including sex, age, household income, and education, as well as wine expertise and PROP responsiveness. Wines were collapsed into five categories (dry table, sparkling, fortified, sweet, and wine-based beverages) to examine more closely the factors affecting wine liking, total annual intake, and consumption frequency (analysis of variance [ANOVA] followed by Tukey's honest significant difference [HSD] 0.05). Wine expertise was most strongly associated with liking and consumption measures, while PROP responsiveness and alcoholic beverage adventurousness were also important contributors. Neither age nor sex had any large and consistent effects on liking or consumption, although the sex × expertise interaction was significant for some styles. These data provide an example of multifactorial segmentation of a wine market using Northeastern United States as an example, and indicate opportunities for targeted alignment of marketing to cohorts identified here.
Keywords: market segmentation, taste genetics, PROP, wine expertise, wine liking, adventurousness
Introduction
Wine is the most consumed alcoholic beverage in at least 20 countries, including France, Italy, Sweden, and Argentina,1 and is the world’s oldest.2 The US is the largest wine-consuming nation by volume and value, ahead of France and Italy. The US wine market has recorded consecutive growth during the past 19 years,3 and in 2012, sales increased by 2% from 2011 to a record 360.1 million cases, representing 13% of the world’s wine production and a US retail value of $34.6 billion.4 Thirty-five percent of Americans drink wine,5 with an average per capita consumption of 3.1 gallons in 2012.6 Some sex differences have been noted, with 52% of women and 20% of men most often consuming wine.5 Historically, the main occasions for wine consumption in the US have been with meals and religious ceremony. However, Thach6 found that 60% of US consumers drink wine without meals. Her research identified nine occasion categories where wine is consumed (eg, date nights and family get-togethers), and noted that wine is increasingly viewed as a beverage to enhance social occasions and is being consumed during less formal occasions.
Given the rise in consumption, production, and competition, it is increasingly important for US and other new world wine producers and marketers to understand and align with consumer preferences across market segments.7 While a range of intrinsic and extrinsic factors influence consumer preference and behavior, the flavor of foods and beverages (colloquially “taste”) is the foremost driver of purchase decisions,8 including wine choice.9
Flavor and sensory perception in general is highly variable across individuals.10 Given the wide range of wine styles available, the opportunity for segmentation and targeted marketing is high, and taste phenotyping may provide significant insight into identifying and understanding market segments.11 The most studied taste phenotype over the last 20 years relates to the suprathreshold bitterness of 6-n-propylthiouracil (PROP).12 Individuals traditionally are classified as PROP non-tasters (those for whom PROP elicits no or slight bitterness), PROP medium-tasters (those for whom PROP is mildly bitter), or PROP super-tasters (those for whom PROP is intensely bitter). Differences in PROP intensity are associated with variation in the TAS2R38 gene, although these polymorphisms do not adequately explain super-tasting.13 Importantly, heightened responsiveness to PROP (ie, super-tasting) associates with greater responsiveness to sensations elicited by wine, including sourness,14,15 bitterness, astringency,14 heat/irritation,14 and chemesthetic subqualities,14 although Pickering et al16 did not find such relationships. Additionally, recent studies show that those who experience PROP more intensely not only experience greater overall oral sensation but may also be more acute tasters, with the ability to discriminate smaller differences between oral stimuli,17–19 including wine.14 How these differences in orosensory perception are reflected in liking, preference, and intake of wine are largely unexplored in the literature.20
Wine expertise may also influence wine liking, choice, and intake. Sensory ability and wine knowledge may together constitute a measure of wine expertise,21 and wine expertise would be expected to associate with overall liking and intake (presumably high liking is a strong motivator in becoming a wine expert). Wine experts possess better olfactory recognition than novices,22,23 and are more likely to experience PROP more intensely.20,24 While wine experts differ from novices in their valuation of wine choice cues and in the influence of specific wine brand components,25,26 there is surprisingly little information on how wine preferences and consumption associate with expertise. Frost and Noble21 found no significant overall differences in liking of red wines between groups segmented on the basis of wine knowledge or a composite metric combining wine knowledge and sensory expertise. More recently, Johnson and Bastian27 reported that wine style consumption patterns in an Australian cohort varied with expertise.
Willingness to try new foods and beverages can moderate ingestive behaviors, yet this factor is often not investigated in wine consumer or taste phenotype research. This willingness varies across individuals and is typically conceptualized as food “adventurousness” or “neophobia”, and the analog with wine is referred to as “wine adventurousness”.24 Differences in food/wine adventurousness have been suggested as accounting for contradictory findings on the significance of PROP phenotypes to real-world food/beverage preference, liking, and/or intake.28 Hayes and Pickering24 speculated that wine, in contrast with most foods and beverages, is a product with a high level of perceived risk in consumers’ minds, given its social cachet, varied nature, and complexity.29 This may attach greater importance to individual adventurousness in mediating wine consumer preference and purchase behavior.
In this study, we seek to extend the research on factors affecting wine liking and consumption. Specifically, we examine how select biological, psychological, and experiential factors might drive wine market segmentation using New York as an example, and to determine how preference for and consumption of wine vary with taste phenotype and other variables.
Materials and methods
Participants
A mail survey approach – widely used in marketing and some epidemiology studies – was used to collect the data for this study. Five thousand questionnaires and prepaid business reply envelopes were mailed to wine consumers selected at random from the mailing list of a large wine retailing group in New York. Three weeks after mailing the questionnaire, a reminder was sent to the recipients to complete and return it. To encourage completion and return, prize draws worth $500 (first prize), $250 (second prize), $125 (third prize), $50 (fourth prize), and ten $20 prizes were awarded. We received ~1,011 questionnaires within 6 weeks of mailing, representing a response rate of 20%.
Wine liking and consumption
Respondents were requested to rate their liking of a range of 14 wine and wine-based beverages using individual generalized degree of liking (gDOL) scales,30 anchored with three adjectives: “Strongest Disliking of any kind” at the bottom of the scale, “Strongest Liking of any kind” at the top, and “Neutral” in the middle. The products were red wine, dry white wine, dry sparkling wine, dry rosé wine, sweet rosé wine, sweet white wine, dessert wine, fruit wine, flavored fruit wine, wine coolers, hard cider, port wine, dry sherry, and sweet sherry. Alternatively, respondents were able to indicate whether they had never tried/experienced a specific item by checking a corresponding box. We interspersed non-food-and-beverage items among the wine items to reinforce the use of the scale for generalized hedonic experiences.
Wine consumption frequency was measured by participants indicating how many times a month they consumed beverages from the categories white wine, red wine, and other (please specify). Participants checked the appropriate response from the following frequency options: 0, 1, 2, 3, 4, 5, 6, 7, 8, 9, 10, 11, 12, 13, 14, 15–19, 20–24, 25–29, ≥30. In order to estimate total intake, participants responded to “On days you drink (wine), how many do you consume?”, with one drink defined as a 6 oz glass of wine. Separate responses were obtained for the categories white wine, red wine, and other (please specify), which were then multiplied by the respective monthly frequency and summed to obtain a measure of monthly intake. These responses were then multiplied by 12 for both frequency and total intake to obtain an annualized estimate of wine consumption behavior for each participant.
Questionnaires
Demographics
Participants were asked to complete a brief questionnaire that collected basic demographic data, including age, sex, ethnicity, household income, and the key measures detailed below. Age response categories (years) were: under 21, 21–25, 26–30, 31–35, 36–40, 41–45, 46–50, 51–55, 56–60, 61–65, over 65. For data analysis purposes some age categories were collapsed to increase statistical power, and yielded the final measures, <36 years (n=90), 36–45 (n=121), 46–50 (n=115), 51–55 (n=148), 56–60 (n=157), 61–65 (n=124), >65 (n=254). Response options for ethnicity were: White, African-American, Asian or Pacific Islander, Hispanic/Latino, American Indian, Others. Response options for annual household income before taxes were: Under $20,000, $20,000–$29,999, $30,000–$39,999, $40,000–$49,999, $50,000–$74,999, $75,000–$99,999, $100,000–$124,999, $125,000 or more.
Wine expertise and adventurousness
Respondents were asked to rate their level of wine expertise by choosing one of four categories: Novice/Beginner, Intermediate, High, or Expert/Very High. For analysis purposes, we collapsed the latter two categories to increase statistical power due to the low number of respondents in the Expert/Very High category (n=6). Participants were also asked, “how often do you try unfamiliar alcoholic beverages?”, and responded using a 4-point Likert scale: “Never,” “Rarely,” “Some of the time,” or “Most of the time.” As reported by Hayes and Pickering,24 we collapsed across response categories to dichotomize individuals into high or low groups, collapsing the first two categories into “never or rarely” for comparison to “some of the time or most of the time.” Seven hundred and fourteen individuals fell in the low group and 295 in the high group.
6-n-propylthiouracil phenotyping
PROP responsiveness was determined based on the method of Zhao et al31 by single assessments of filter paper disks impregnated with 50 mmol/L PROP (MP Biomedicals, Solon, OH, USA). The disks were included in the envelope sent to the study participants. Self-administered PROP filter paper assessment methods have been used successfully in prior mail surveys (eg, Drewnowski et al;32 Pickering et al20). Respondents administered the disks after completing all other survey questions, and rated the perceived bitterness using the generalized labeled magnitude scale (gLMS).33 Instructions included:
First, take a sip of water and swish it around your mouth to clean it. Take the paper disk and place it on the tip of your tongue for 30 seconds or until it is fully wet (please see the diagram below). Rate the intensity of the taste of the paper disk by drawing a mark on the scale for your answer. You can put a mark on any place on the scale, not just near the words. The top of the scale is the strongest sensation of any kind, including pain, that you can imagine experiencing.
A black-and-white diagram was included in the survey to show the respondents how to correctly place the disk on their tongue. PROP taster status (PTS) was determined using the cut-offs previously employed by Pickering et al20 on the same cohort: non-tasters (NTs), <9 mm; medium-tasters (MTs), 9–50 mm; super-tasters (STs), >50 mm.
Data treatment and analyses
Unless otherwise indicated, all analyses were conducted using XLSTAT (Version 2012.1.01; Addinsoft, Andernach, Germany).
Cluster analysis
An initial cluster analysis (agglomerative hierarchical clustering – dissimilarity proximity, Ward’s method, Euclidean distance) was performed to investigate how the wine products grouped on the basis of liking scores. Following this, agglomerative hierarchical and K-means clustering techniques were used to classify participants according to their preferences for the 14 wine styles. Agglomerative hierarchical clustering (dissimilarity proximity type, Ward’s method, Euclidean distance) revealed three clusters on the basis of the dendrogram plot. K-means clustering (criterion: trace [W]; nearest neighbor estimation for missing data) was then used to classify the participants. Each cluster was then compared for sex, age, ethnicity, years of formal education, annual household income, wine expertise, alcoholic beverage adventurousness, annual wine consumption, PROP intensity, and PTS. Clusters were examined using one-way analysis of variance (ANOVA) for the quantitative variables and χ2 for qualitative variables (Table 1).
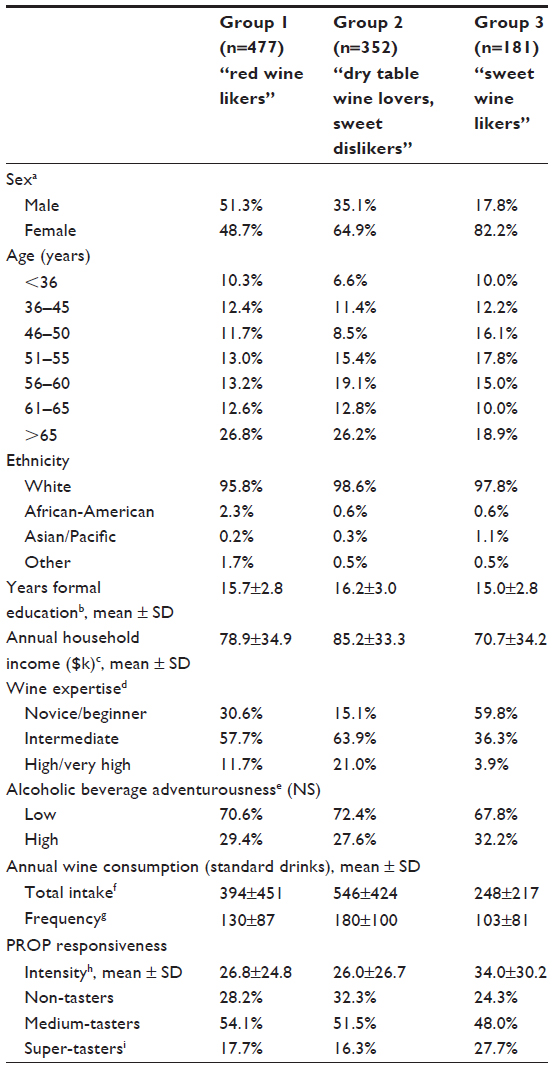 | Table 1 Characteristics of wine liking segments |
Factors influencing wine liking and consumption
Wines were grouped into traditional beverage categories before performing an ANOVA: dry table wines (red wine, dry white wine, dry rosé), sparkling (dry sparkling wine, hard cider), fortified (port, dry sherry, sweet sherry), sweet wines (sweet white wine, dessert wine, sweet rosé), and wine-based beverages (wine coolers, flavored fruit wine, fruit wine). The decision to place fruit wine in the latter category was based on its close grouping with wine coolers and flavored fruit wines in the liking dendrogram (Figure 1). An ANOVA was then completed in which liking scores for each wine category were the dependent variables, and age, sex, wine expertise, alcoholic beverage adventurousness, PTS, and all two-way interaction were independent variables. Annualized total wine intake and consumption frequency were also examined as described above. When two-way interactions were not significant, the ANOVA was repeated without the nonsignificant interaction term(s) to increase statistical power. Tukey’s honest significant difference (HSD) 0.05 was used as the means separation test throughout. Effect size estimates for the independent variables were quantified using the η2 statistic within SPSS 20 (SPSS Inc., Chicago, IL, USA).
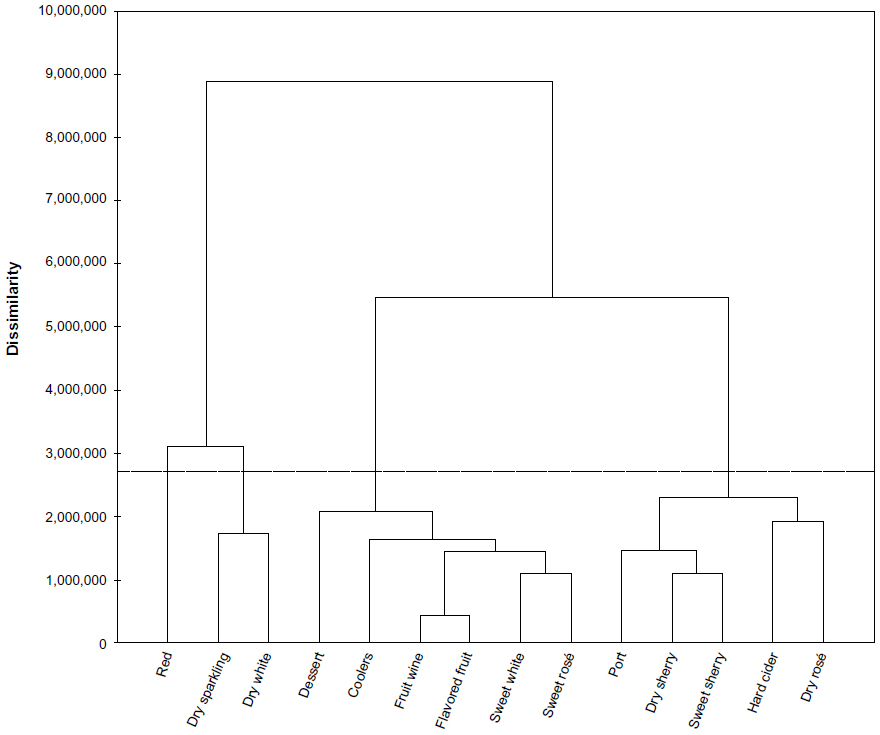 | Figure 1 Dendrogram from cluster analysis of wine liking scores (agglomerative hierarchical clustering – dissimilarity proximity, Ward’s method, Euclidean distance). |
Results
We eliminated respondents who did not complete necessary parts of the survey, leaving a sample size of 1,010, which represents a usable response rate of 20%. The broad characteristics of our sample were: 39.6% males, 60.4% females; Average age: 54.3±11.2 years; Race: 97.1% White, 1.4% African-American, 1.5% Other; Years of formal education: 15.8±2.9; Annual household income: $79,615±$34,775; Wine expertise: novice/beginner 30.4%, intermediate 56.1%, high/very high/expert: 13.6%; Alcoholic beverage adventurousness: low 70.8%, high 29.2%; Annual wine intake, 426±424 drinks; Annual wine consumption frequency: 143±95 occasions; PROP intensity: 27.8±26.6 mm; PTS: NTs 28.9%, MTs 52.1%, STs, 19.0%.
Segmentation
An initial cluster analysis was performed to investigate how the wine products grouped together. As shown in Figure 1, four main clusters were revealed. Interestingly, these groupings appear largely on the basis of orosensory properties: red wine, dry wines, sweet wines, and fortified products. Following cluster analysis of consumers, three distinct groupings can be visualized in Figure 2. Group 1 is characterized by relatively high liking of red wines, and liking scores for most other styles that are intermediate between the other groups. Thus they can be conceived as red wine likers. They are more likely to be males and are intermediate between the other clusters for age, education, income, wine expertise, alcoholic beverage adventurousness, annual wine consumption, and PROP intensity (Table 1).
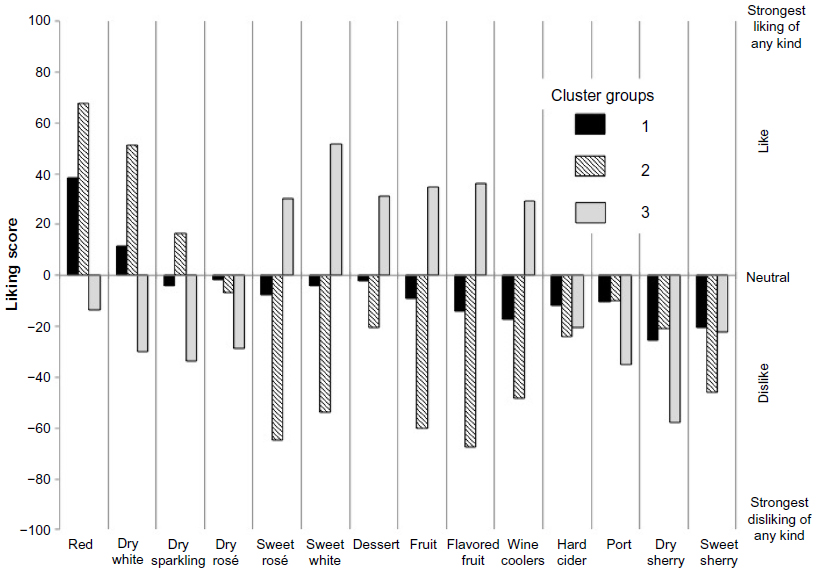 | Figure 2 Consumer profile plot from cluster analysis of wine liking scores (K-means clustering – criterion: trace (W), after agglomerative hierarchical clustering – dissimilarity proximity, Ward’s method, Euclidean distance). |
Group 2 has the highest liking for red and dry white wines, and substantially the lowest liking of sweet wines, and thus can be categorized as dry table wine lovers, sweet dislikers. They are the oldest cluster (mean =55.4±10.5 years), the least ethnically diverse, the most educated, and have the highest household income (Table 1). They are also much more likely to rate themselves as having a high or greater level of wine expertise, are the least adventurous with respect to alcoholic beverages, and consume substantially more wine and more frequently than the other clusters. They also rate PROP intensity the lowest, consistent with the age-related decrease in PROP bitterness reported by Pickering et al.20
Group 3 is the smallest group, and is characterized by high liking responses for sweet wines, and score the “pop” sweet wine products – flavored fruit wine and wine coolers – significantly higher than the other groups. Thus, they can be considered sweet wine likers. This group are much more likely to be female, younger (mean =52.7±10.9), less educated, and with a lower household income (Table 1). They have a much lower level of wine expertise, consume substantially less wine and less frequently, and are more likely to be PROP STs than the other clusters.
Factors influencing wine liking
The association between the independent variables was calculated. Point biserial correlations were used for all comparisons except expertise × age, PROP × age, and PROP × expertise, where Pearson’s correlation was used. Pairwise comparisons were not significant or showed weak associations; coefficients and corresponding probabilities (*= P<0.05, **= P<0.01, ***= P<0.001, not significant [NS]) are: PROP × sex, 0.174***; PROP × age, −0.007 NS; PROP × expertise, 0.021 NS; PROP × adventurousness, 0.039 NS; age × sex, 0.173***; expertise × sex, 0.134***; expertise × age, −0.016 NS; adventurousness × sex, 0.085**; adventurousness × age, −0.192***; adventurousness × expertise, 0.079*.
Table 2 shows the key results from the ANOVA, and Table 4 indicates the relative effect sizes for the independent variables. Overall, age had a modest effect on wine liking, significant only for the fortified wine category. Means for each age category (years; organized by decreasing liking) and the results from Tukey’s HSD for fortified wine are: <36: −10.6 a; >65: −14.5 a; 61–65: −20.9 ab; 46–50: −27.5 ab; 56–60: −29.6 ab; 51–55: −31.8 b; 36–45: −34.4 b. The age × sex interaction for fortified wines (Table 3) revealed that the higher liking of the two extreme age groups was much stronger in females (data not shown). Sex was only significant for the fortified wine category, with males indicating higher liking (−9.2±45.6) than females (−34.7±49.2). Both expertise and adventurousness were significant factors influencing liking scores across all wine categories. As shown in Figure 3A, greater expertise predicted higher liking for dry table, sparkling, and fortified wines, but was inversely associated with liking for sweet wine and wine-based beverages. The expertise × sex interaction was significant or approached significance for sparkling wine, fortified wine, sweet wine, and wine-based beverages. As shown in Table 3, the trend of liking increasing with expertise for sparkling wines is less pronounced for males with the highest expertise. The trend of increasing expertise associating with higher liking for fortified wines does not hold for female novice consumers. Female novices like sweet wines more than male novices, reversing the pattern observed for the other two expertise levels. Finally, while liking of wine-based beverages is greater for female novices and those with the highest expertise, the pattern is reversed for consumers with intermediate levels of expertise.
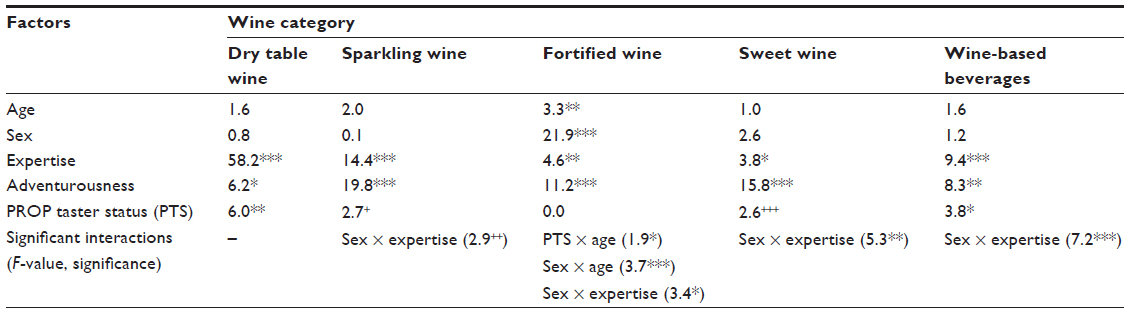 | Table 2 F-values from analysis of variance of wine liking scores for wine categories. |
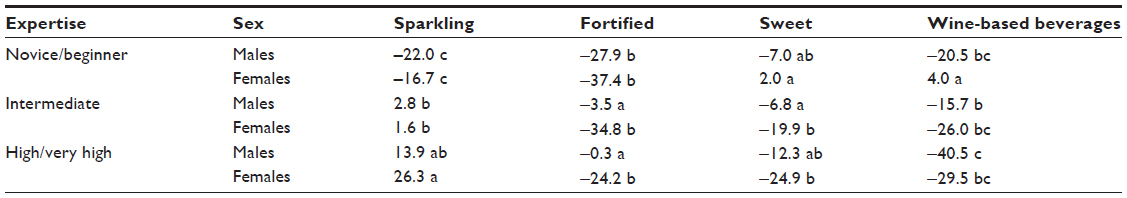 | Table 3 Interaction between wine expertise and sex for wine liking |
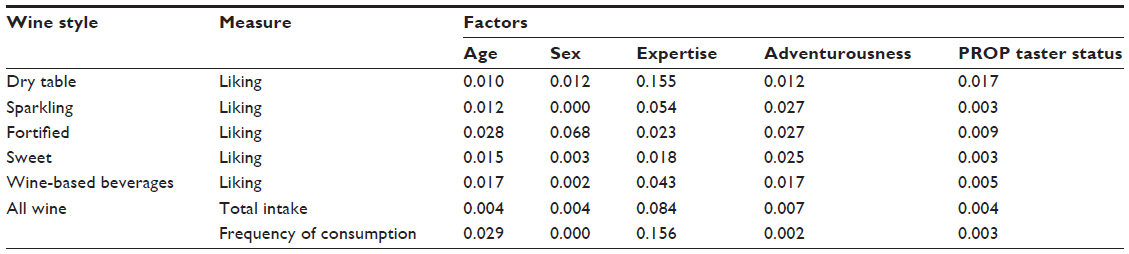 | Table 4 Effect sizes (eta-squared) for factors associated with wine liking and consumption |
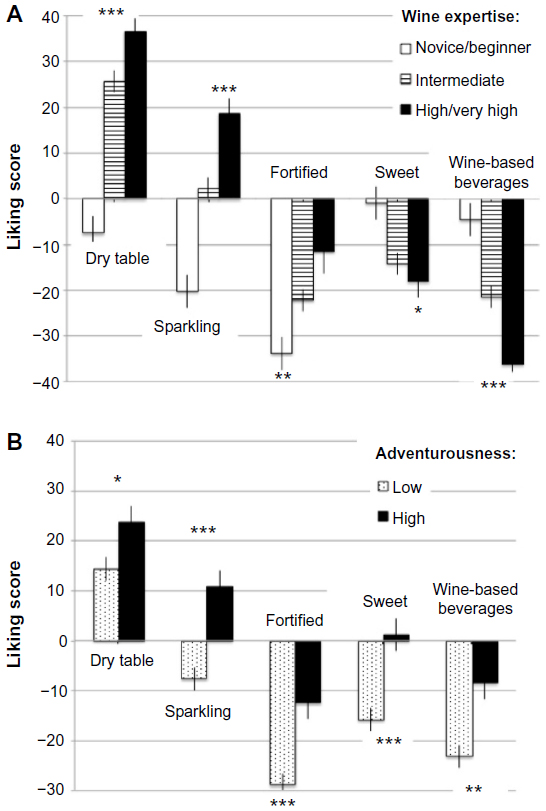 | Figure 3 Influence of self-reported wine expertise (A) and alcoholic beverage adventurousness (B) on wine liking. |
Adventurousness predicted higher liking for all wine types (Figure 3B). PTS was significant or approached significance for dry table wine, sparkling wine, sweet wine, and wine-based beverages (Table 2). As shown in Figure 4, STs tended toward lower liking scores for dry table, sparkling, and fortified wines, while the differences between STs and NTs were reversed for sweet wines and wine-based beverages. PTS × age was significant for fortified wines; however, Tukey’s HSD failed to separate the means. Overall, the effect size for PTS across the five wine categories was of a magnitude similar to that for sex (Table 4).
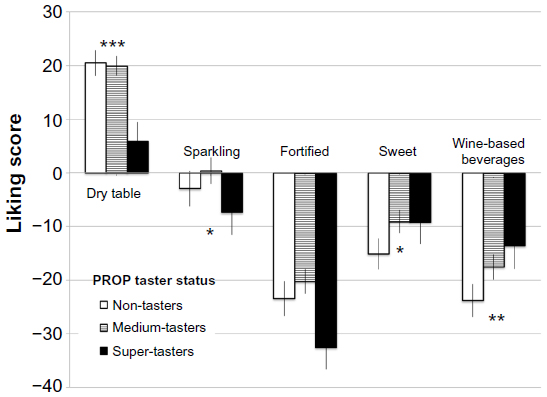 | Figure 4 PROP responsiveness and wine liking. |
Factors influencing wine consumption
Total annual wine intake varied with expertise (F=44.7, P<0.001), adventurousness (F=5.2, P<0.05), and PTS (F=7.1, P<0.001), but not age (F=0.6, P>0.05) or sex (F=0.3, P>0.05). PTS × expertise was the only significant two-way interaction (F=2.6, P<0.05). Annual frequency of consumption varied with age (F=8.0, P<0.001), expertise (F=95.2, P<0.001), and PTS (F=4.3, P<0.05) and approached significance for adventurousness (F=3.2, P=0.07), while sex was not significant (F=0.2, P>0.05). The significant two-way interactions for frequency were PTS × sex (F=3.3, P<0.05) and PTS × expertise (F=2.5, P<0.05). As shown in Figure 5, total wine intake increases with expertise and adventurousness, and frequency of consumption tends to increase with age, expertise, and adventurousness. Both intake and frequency vary inversely with PROP responsiveness. The PTS × expertise interactions for intake and frequency show a similar pattern, with the higher values for PROP NTs compared to STs not holding for consumers of intermediate expertise, for whom the responses are flat across PTS (data not shown). Tukey’s HSD did not separate the means for the PTS × sex interaction for consumption frequency. Female NTs and STs tended to drink wine more frequently than their male counterparts; however, this trend was reversed for MTs (data not shown). Overall, the effect size for PTS across the five wine categories was of a magnitude similar to that for sex and adventurousness (Table 4).
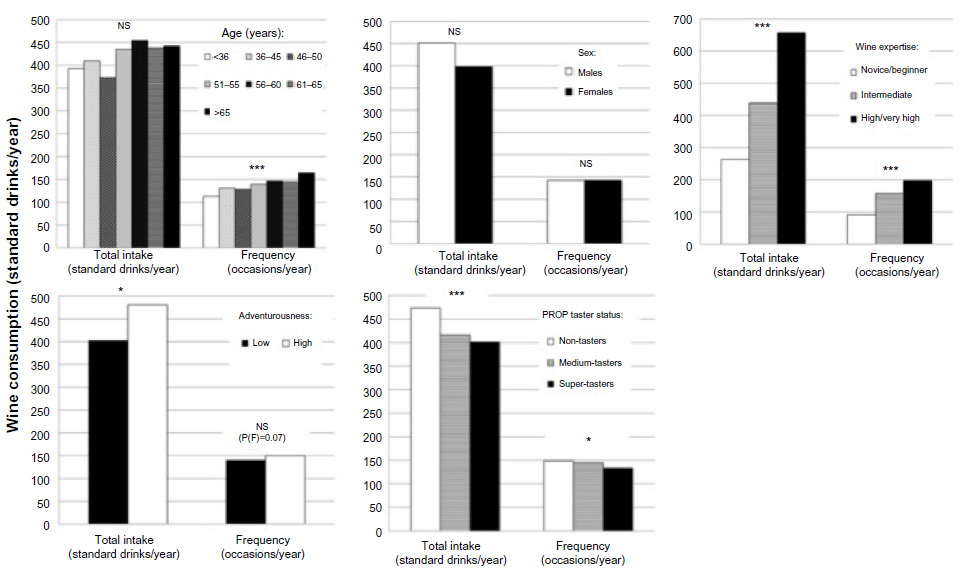 | Figure 5 Influence of select biological, experiential, and psychological factors on wine consumption. |
Food-liking ratings may be a better predictor of consumption than traditional measures of dietary intake,34,35 and it has been suggested that liking scores of alcoholic beverages might serve a similar role as a proxy for actual consumption. Therefore, we examined the relationship between liking scores for white and red wine and self-reported monthly intake and frequency. R-values and the corresponding probabilities for white and red wine intake were 0.29 (P<0.0001) and 0.36 (P<0.0001), respectively. R-values and the corresponding probabilities for white and red wine consumption frequency were 0.39 (P<0.0001) and 0.59 (P<0.0001), respectively. Thus, wine liking scores are better predictors of wine consumption frequency than they are of total wine intake, although, overall, liking is only moderately associated with these consumption measures. This relatively weak association suggests that caution should be applied in using liking data as a proxy for consumption of wine, and perhaps alcoholic beverages in general. Conceivably, disliking may be more tightly coupled with disuse than liking is with use, and this could be explored further in future studies.
Discussion
Market segmentation
New York is the third most populous US state (19.5 million) and consumes over 26 million cases of wine annually, representing 8.2% of total US wine sales in 2011.36 On an adult per capita basis, New Yorkers consume 4.4 gallons of wine. This is mostly comprised of table wines (87%), with relatively small proportions of sparkling wine (5%), and specialty wines, fruit flavored wines, traditional dessert wines, and vermouth (8%). Of the table wine consumed by New Yorkers in 2011, 62% was imported and 38% was domestically produced.
We are not aware of any prior literature on consumer segmentation of the New York wine market. Additionally, much of the international literature on wine segmentation has not examined the variation in liking across the range of available wine styles. Nonetheless, our dry table wine lovers, sweet dislikers, and sweet wine likers clusters share some demographic characteristics with, respectively, the Connoisseur and Beverage Wine Drinker segments, identified in previous studies.37–39 Further information on the characteristics of the three clusters identified here – including values,40 lifestyle characteristics,40 and consumption occasions41 – would enable a fuller comparison with market segments described in other countries/cohorts, and assist with targeted marketing to these consumers.
Factors influencing liking and consumption
Of all the factors examined, expertise generally associates most strongly with wine liking and consumption. Conceivably, expertise may be confounded with income; however, the association between the two in this sample is weak (Pearson’s r=0.176). Instead, the finding may be linked to the assumed greater involvement of consumers with higher levels of expertise. Involvement has previously been linked to wine purchase behavior and intent (eg, Lockshin et al;42 Quester and Smart43), where high and low involvement wine buyers behave differently, including in their response to product cues.7,44 Further, wine involvement has been advocated as an effective segmentation tool, accounting for significant differences in purchase behavior and response to marketing strategies.45
Age was not as important a predictor of wine liking or consumption as we anticipated, given the generational perspective of the wine market observed in the literature over the last decade (eg, Bruwer;46 Thomas and Pickering47). While the differences in liking between the PTS groups were generally modest, they are observed for most wine categories, suggesting a robust effect. Interestingly, STs disliked the three wine styles most associated with potentially aversive orosensory properties more than the other PTS groups: specifically, dry table wine (elicit higher sourness and bitterness), sparkling wines (elicit greater irritation), and fortified wines (elicit higher irritation/bitterness). If the aversive orosensory qualities of alcoholic beverages serve as a deterrent to intake for those who experience PROP more intensely, as has been suggested,48,49 then we might expect lower consumption of these wine styles for these individuals. Unfortunately, we did not collect consumption data for most wine styles, precluding a test of this prediction. Arguing against this hypothesis are the reports that STs are more likely to be wine experts,20,24 with expertise itself a strong predictor of intake (Figure 5). By contrast, STs gave higher liking scores than NTs for the two sweet wine categories (sweet and wine-based beverages).
Other considerations
Our sample was drawn from the mailing list of a large wine-retailing group. It is possible that membership on such a list reflects greater involvement – or at least interest – in wine than is the case for other wine consumers; thus some caution should be applied in generalizing our findings.
The gDOL scale used in this study is yet to be fully assessed for its reliability and validity, and further research is suggested in this regard. However, it has previously been used to measure alcoholic beverage and food liking,20,29,50 with the latter authors reporting that it yielded a wide spread of scores that were normally distributed and reflected expected discrimination across a range of products.
Wine liking response to different product characteristics, including brand and packaging, has been shown to vary with age and wine experience.51 Thus, when considered with adventurousness and PTS, opportunities exist for targeted alignment of marketing to these cohorts, and further study is encouraged in this area.
Conclusion
Wine consumers from New York can be segmented into three distinct and realistic market segments, based on their liking of a full range of commercial wine styles. Experiential, psychological, and biological factors affect wine liking and consumption in complex ways, with wine expertise tending to exert the greatest influence. PROP responsiveness and alcoholic beverage adventurousness are also important components of wine liking and consumption, and their consideration in future studies will contribute to a more comprehensive understanding of wine behavior.
Acknowledgments
Dr John Hayes is thanked for insightful comments on some of the concepts discussed in the paper. Dr Andreea Botezatu and Samantha Morris are thanked for editorial assistance. The anonymous reviewers are thanked for helpful suggestions that have improved the paper. This project was funded by a Natural Sciences and Engineering Research Council grant to GJP. Additional financial support was provided to AKJ and RB through Individual Development Grants awarded to both by United University Professions.
Disclosure
The authors report no conflicts of interest in this work.
References
World Health Organization. Global Status Report on Alcohol and Health. Geneva, Switzerland: WHO Press, World Health Organization; 2011. | |
McGovern PE, Zhang J, Tang J, et al. Fermented beverages of pre- and proto-historic China. Proc Natl Acad Sci U S A. 2004;101:17593–17598. | |
Wine Institute. 2012 Wine Sales in US Reach New Record: Record California Winegrape Crop to Meet Surging Demand; 2013. Available from: http://www.wineinstitute.org/resources/pressroom/04082013. Accessed October 7, 2013. | |
Berry A. The World of Wine: What’s Trending this Spring; 2013. Available from: http://style.time.com/2013/03/07/the-world-of-wine-whats-trending-this-spring/#ixzz2h5S6mDZm. Accessed October 7, 2013. | |
Gallop. Gallup Poll: The US Wine Market-Impact Databank Review and Forecast, 2012 ed; 2012: Table 9-1, p. 530. | |
Thach L. Trends in the US Wine Industry in 2013 – Cautiously Zoptimistic; 2013. Available from: http://lizthach.wordpress.com/2013/01/19/. Accessed October 9, 2013. | |
Hollebeek LD, Sara RJ, Roderick JB, Balemi A. The influence of involvement on purchase intention for new world wine. Food Qual Prefer. 2007;18:1033–1049. | |
IFIC. Food and Health Survey: Consumer Attitudes Towards Food Safety, Nutrition and Health. Cambridge, MA: IFIC; 2011. | |
Thompson KE, Vourvachis A. Social and attitudinal influences on the intention to drink wine. Int J Wine Mark. 1995;7(2):35–45. | |
Hayes JE, Allen AL, Bennett SM. Direct comparison of the generalized visual analog scale (gVAS) and general labeled magnitude scale (gLMS). Food Qual Prefer. 2013;28:36–44. | |
Pickering GJ, Cullen CW. The influence of taste sensitivity and adventurousness Generation Y’s liking scores for sparkling wine. Proceedings of the Fourth International Conference of the Academy of Wine Business Research; July 17–19, 2008; Siena, Italy; 2008. | |
Hayes JE, Keast RSJ. Two decades of supertasting: where do we stand? Physiol Behav. 2011;104(5):1072–1074. | |
Hayes JE, Bartoshuk LM, Kidd JK, Duffy VB. Supertasting and PROP bitterness depends on more than the TAS2R38 gene. Chem Senses. 2008;33:255–265. | |
Pickering GJ, Robert G. Perception of mouthfeel sensations elicited by red wine is associated with sensitivity to 6-n-propylthiouracil (PROP). J Sens Stud. 2006;21:249–265. | |
Pickering GJ, Simunkova K, DiBattista D. Intensity of taste and astringency sensations elicited by red wines is associated with sensitivity to PROP (6-n-propylthiouracil). Food Qual Prefer. 2004;15:147–154. | |
Pickering GJ, Moyes A, Bajec MR, Decourville N. Thermal taster status associates with oral sensations elicited by wine. Aust J Grape Wine Res. 2010;16:361–367. | |
Hayes JE, Sullivan BS, Duffy VB. Explaining variability in sodium intake through oral sensory phenotype, salt sensation and liking. Physiol Behav. 2010;100:369–380. | |
Lee Y-M, Prescott J, Kim KO. PROP taster status and the rejection of foods with added tastants. Food Sci Biotechnol. 2008;17:1066–1073. | |
Prescott J, Soo J, Campbell H, Roberts C. Responses of PROP taster groups to variations in sensory qualities within foods and beverages. Physiol Behav. 2004;82:459–469. | |
Pickering GJ, Jain AK, Bezawada R. Super-tasting gastronomes? Taste phenotype characterization of foodies and wine experts. Food Qual Prefer. 2013;28:85–91. | |
Frost MB, Noble AC. Preliminary study of the effect of knowledge and sensory expertise on liking for red wines. Am J Enol Vitic. 2002;53:275–284. | |
Parr WV, Heatherbell D, White KG. Demystifying wine expertise: olfactory threshold, perceptual skill and semantic memory in expert and novice wine judges. Chem Senses. 2002;27:747–755. | |
Parr WV, White KG, Heatherbell DA. Exploring the nature of wine expertise: what underlies wine experts’ olfactory recognition memory advantage? Food Qual Prefer. 2004;15:411–420. | |
Hayes JE, Pickering GJ. Wine expertise predicts taste phenotype. Am J Enol Vitic. 2012;63:80–84. | |
Perrouty JP, d’Hauteville F, Lockshin L. The influence of wine attributes on region of origin equity: an analysis of the moderating effect of consumer’s perceived expertise. Agribusiness. 2006; 22(3):323–341. | |
D’Alessandro S, Pecotich A. Evaluation of wine by expert and novice consumers in the presence of variations in quality, brand and country of origin cues. Food Qual Prefer. 2013;28:287–303. | |
Johnson TE, Bastian SE. What does Australian wine consumers’ wine expertise reveal about their wine purchasing and consumption behaviour? Aust N Z Wine Ind J. 2008;23:24–30. | |
Ullrich NV, Touger-Decker R, O’Sullivan-Maillet J, Tepper BJ. PROP taster status and self-perceived food adventurousness influence food preferences. J Am Diet Assoc. 2004;104:543–549. | |
Lacey S, Bruwer J, Li E. The role of perceived risk in wine purchase decisions in restaurants. Int J Wine Bus Res. 2009;21:99–117. | |
Byrnes NK, Hayes JE. Personality factors predict spicy food liking and intake. Food Qual Prefer. 2013;28:213–221. | |
Zhao L, Kirkmeyer SV, Tepper BJ. A paper screening test to assess genetic taste sensitivity to 6-n-propylthiouracil. Physiol Behav. 2003;78(4–5):625–633. | |
Drewnowski A, Kristal A, Cohen J. Genetic taste responses to 6-n-propylthiouracil among adults: a screening tool for epidemiological studies. Chem Senses. 2001;26(5):483–489. | |
Bartoshuk LM, Duffy VB, Green BG, et al. Valid across-group comparisons with labeled scales: the gLMS versus magnitude matching. Physiol Behav. 2004;82:109–114. | |
Duffy VB, Lanier SA, Hutchins HL, Pescatello LS, Johnson MK, Bartoshuck LM. Food preference questionnaire as a screening tool for assessing dietary risk of cardiovascular disease within health risk appraisals. J Am Diet Assoc. 2007;107:237–245. | |
Duffy VB, Hayes JE, Sullivan BS, Faghria P. Surveying food and beverage liking a tool for epidemiological studies to connect chemosensation with health outcomes. Ann N Y Acad Sci. 2009;1170:558–568. [International Symposium on Olfaction and Taste]. | |
Impact. The US Wine Market-IMPACT Databank Review and Forecast. New York, NY: M Shanken Communications, Inc.; 2012. | |
Spawton T. Marketing planning for wine. Eur J Mark. 1991;25:6–48. | |
Hall J, Winchester M. What’s really driving wine consumers? Aust N Z Wine J. 2000;20:68–72. | |
Thomas A, Pickering GJ. Behavioural segmentation: a New Zealand wine market application. J Wine Res. 2004;14:127–138. | |
Bruwer J, Lia E, Reid M. Segmentation of the Australian wine market using a wine-related lifestyle approach. J Wine Res. 2002;13:217–242. | |
Thach L. Wine for breakfast: exploring wine occasions for Gen Y. Proceedings of the 6th AWBR International Conference; 2011; Bordeaux Management School, BEM, France. | |
Lockshin L, Spawton A, Macintosh G. Using product, brand, and purchasing involvement for retail segmentation. J Retail Consum Serv. 1997;4(3):171–183. | |
Quester P, Smart JG. The influence of consumption situation and product involvement over consumers use of product attributes. J Consum Mark. 1998;15(3):220–238. | |
Lockshin L, Jarvisa W, d’Hauteville F, Perrouty J-P. Using simulations from discrete choice experiments to measure consumer sensitivity to brand, region, price, and awards in wine choice. Food Qual Prefer. 2006;17(3–4):166–178. | |
Lockshin L, Quester P, Spawton T. Segmentation by involvement or nationality for global retailing: a cross national comparative study of wine shopping behaviours. J Wine Res. 2001;12(3):223–236. | |
Bruwer J. The love affair of generation-X consumers with the winery tasting room. Aust N Z Grapegrow Winemak. 2004;491:19–24. | |
Thomas A, Pickering GJ. X-it: Gen-X and older wine drinker comparisons in New Zealand. Int J Wine Mark. 2005;17(2):30–48. | |
Duffy VB, Davidson AC, Kidd JR, et al. Bitter receptor gene (TAS2R38), 6-n-propylthiouracil (PROP) bitterness and alcohol intake. Alcohol Clin Exp Res. 2004;28(11):1629–1637. | |
Lanier SA, Hayes JE, Duffy VB. Sweet and bitter tastes of alcoholic beverages mediate alcohol intake in of-age undergraduates. Physiol Behav. 2005;83:821–831. | |
Hayes J, Grenga A, Swift R. Possible sex effects in the relationship between alcohol intake and sweet food reward. 8th Pangborn Sensory Symposium; 2009; Florence, Italy. | |
Mueller S, Szolnoki G. The relative influence of packaging, labelling, branding and sensory attributes on liking and purchase intent: consumers differ in their responsiveness. Food Qual Prefer. 2010;21:774–783. |
 © 2014 The Author(s). This work is published and licensed by Dove Medical Press Limited. The
full terms of this license are available at https://www.dovepress.com/terms
and incorporate the Creative Commons Attribution
- Non Commercial (unported, 3.0) License.
By accessing the work you hereby accept the Terms. Non-commercial uses of the work are permitted
without any further permission from Dove Medical Press Limited, provided the work is properly
attributed. For permission for commercial use of this work, please see paragraphs 4.2 and 5 of our Terms.
© 2014 The Author(s). This work is published and licensed by Dove Medical Press Limited. The
full terms of this license are available at https://www.dovepress.com/terms
and incorporate the Creative Commons Attribution
- Non Commercial (unported, 3.0) License.
By accessing the work you hereby accept the Terms. Non-commercial uses of the work are permitted
without any further permission from Dove Medical Press Limited, provided the work is properly
attributed. For permission for commercial use of this work, please see paragraphs 4.2 and 5 of our Terms.