Back to Journals » Cancer Management and Research » Volume 13
SDC2 and TFPI2 Methylation in Stool Samples as an Integrated Biomarker for Early Detection of Colorectal Cancer
Authors Zhang W, Yang C, Wang S, Xiang Z, Dou R ![]() , Lin Z, Zheng J, Xiong B
, Lin Z, Zheng J, Xiong B
Received 13 January 2021
Accepted for publication 7 April 2021
Published 30 April 2021 Volume 2021:13 Pages 3601—3617
DOI https://doi.org/10.2147/CMAR.S300861
Checked for plagiarism Yes
Review by Single anonymous peer review
Peer reviewer comments 3
Editor who approved publication: Professor Yong Teng
Weisong Zhang,* Chaogang Yang,* Shuyi Wang, Zhenxian Xiang, Rongzhang Dou, Zaihuan Lin, Jinsen Zheng, Bin Xiong
Department of Gastrointestinal Surgery, Zhongnan Hospital of Wuhan University, Hubei Key Laboratory of Tumor Biological Behaviors & Hubei Cancer Clinical Study Center, Wuhan, 430071, People’s Republic of China
*These authors contributed equally to this work
Correspondence: Bin Xiong Email [email protected]
Background: Detection of aberrant methylated DNA in the stool is an effective early screening method for colorectal cancer (CRC). Previously, reporters identified that syndecan-2 (SDC2) and tissue factor pathway inhibitor 2 (TFPI2) were aberrantly methylated in most CRC tissues. However, the combined diagnostic role of them remains undefined. Our research aimed at probing the role and efficiency of the methylation status of SDC2 and TFPI2 in CRC early screening by using bioinformatics analysis and clinical stool sample validation.
Methods: The promoter and CpG site methylation levels of SDC2 and TFPI2 and their correlation with clinicopathological characteristics of CRC were analyzed using UALCAN, Methsurv, and Wanderer. UCSC Xena was used to perform survival analyses. LinkedOmics was used to do functional network analysis. DNA was isolated and purified from stool, and quantitative methylation-specific PCR (qMSP) was applied to detect methylatedSDC2 and TFPI2.
Results: The results showed that promoter and most CpG site methylation levels of SDC2 and TFPI2 were significantly higher in CRC than in normal tissues. Moreover, SDC2 and TFPI2 methylation showed a positive correlation. Functional network analysis suggested that both methylated SDC2 and TFPI2 were involved in tumor cells’ metabolic programs. Besides, there was a higher positive integrated detection rate in CRC (n=61) with a sensitivity of 93.4% and in adenoma (Ade) (n=16) with a sensitivity of 81.3% than normal with a specificity of 94.3% in stool samples. What is more, integration of methylated SDC2 and TFPI2 showed a higher sensitivity and Youden index than a single gene in detecting Adeor CRC.
Conclusion: Our data indicate that SDC2 and TFPI2 were hypermethylated in CRC, and integrated detection of methylated SDC2 and TFPI2 in stool has the potential to be an effective and noninvasive tool of CRC early screening.
Keywords: DNA methylation, colorectal cancer, early detection, SDC2, TFPI2, stool
Corrigendum for this paper has been published
Introduction
Colorectal cancer (CRC) is a common malignancy of the digestive system. Risk factors known associated with the incidence of CRC are as follows: smoking, alcohol intake, increased body weight, male sex, inflammatory bowel disease, diabetes, and certain dietary habits along with the ethnicity.1 Globally, CRC is the third most common cause of cancer in both male and female based on the World Health Organization GLOBOCAN database.2 Most CRC patients are diagnosed with advanced cancer at the time of symptoms. There were approximately 147,950 new cases and more than 53,200 deaths in the United States of America in 2020.3 While in China, the incidence of CRC ranks second and the mortality ranks fifth, with over 517,000 new CRC cases and 245,000 CRC deaths counted in 2018.4 The 5-year survival rate for CRC is up to 90% when patients are diagnosed in an early stage, but below 10% when cancer metastases.5,6 Therefore, it is necessary to find out convenient and effective methods for early CRC diagnosis.
In recent years, several screening tools have been exploited to promote CRC early screening such as fecal occult blood testing (FOBT) and colonoscopy, which had been shown to significantly reduce the incidence and mortality of CRC.7–9 However, FOBT has a low sensitivity of 33.3–57.1% that limits its use.10 As for colonoscopy, though it is the gold standard for CRC diagnosis, the high cost, invasiveness, and bothersome bowel preparation bring inconvenience.11 Fecal immunochemical test (FIT) was recommended to be an alternative to FOBT. However, it is a pity that 20–30% of colorectal cancer, 70–80% of advanced colorectal adenoma were missed and nearly 10% of normal controls were misidentified as patients in the overall screening population by FIT.12 Recently, the aberrant methylation of genes is regarded as an important step in the process of tumorigenesis of CRC and other cancers in human.13 It is chemically and biologically stable for methylated DNA which can result in gene silencing of tumor suppressor genes.14,15 Methylated DNA can be rapidly detected in a variety of body fluids, including blood and stool. Thus, methylated specific DNA sites detected in the solid tumors are now being applied as a noninvasive molecular method to the diagnosis for the early cancer detection.16–18
The syndecan-2 protein (SDC2) is a cell surface heparan sulfate proteoglycan that functions through acting as a receptor for extracellular matrix components.19 It has been reported that SDC2 serves as a tumor suppressor in osteosarcoma,20 or an oncogene in breast cancer21 and CRC.22 Tissue factor pathway inhibitor 2(TFPI2) is a Kunitz-type serine proteinase inhibitor that has been identified as a tumor suppressor gene via preventing the extracellular matrix of cancer cells from degradation and tumor invasion.23 The epigenetic inactivation of TFPI2 is a universal mechanism that contributes to the proliferation and invasiveness of tumors such as pancreatic ductal adenocarcinoma24 and hepatocellular carcinoma.25 Based on previous studies, methylated SDC2 and TFPI2 showed relatively high sensitivities and specificities in detecting early CRC in stool samples.26,27 Furthermore, aberrant methylation of SDC2 and TFPI2 has been detected in serum of CRC patients.28,29 However, there is no research focus on integrated detection of these two genes in CRC screening.
In the present study, we explored the role and efficiency of the methylation status of SDC2 and TFPI2 in early screening for CRC by bioinformatics analysis and clinical stool sample validation. The results of bioinformatics analysis indicated that the promoter methylation levels of SDC2 and TFPI2 were highly associated with CRC. Further clinical stool sample detection demonstrated that SDC2 methylation and TFPI2 methylation showed a high sensitivity for CRC and adenoma (Ade). Moreover, integrated detection of these two genes showed better performance than a single methylated gene. These findings indicated that integrated detection of methylated SDC2 and TFPI2 in stool samples has high potential in noninvasive diagnostics for early screening of CRC.
Materials and Methods
Bioinformatic Analyses of Methylated SDC2 and TFPI2 in CRC Tissue Samples
UALCAN (http://ualcan.path.uab.edu) is a user-friendly, comprehensive, and interactive web server for analyzing TCGA tumor gene expression data from 31 cancer types.30 We used UALCAN to analyze the promoter methylation levels of SDC2 and TFPI2 across CRC and normal tissues, as well as in different tumor subsets based on tumor grade, gender, cancer stages and other clinicopathological characteristics. MethSurv (https://biit.cs.ut.ee/methsurv/) is a web portal accessible to use DNA methylation data from TCGA for multivariable survival analysis.31 We used MethSurv to explore different CpG sites scattering of SDC2 and TFPI2. Wanderer (http://maplab.imppc.org/wanderer/) is a genetically entered interactive web browser for TCGA data. It grants access to retrieval and visualization of expression and methylation levels for interesting genes in different tumor types.32 We surveyed the methylation levels of various CpG sites for SDC2 and TFPI2 using Wanderer. UCSC Xena (https://pcawg.xenahubs.net) is an online web available for multi-omic and clinical/phenotype data analysis.33 We evaluated the expression and prognostic value of methylated SDC2 and TFPI2 and in CRC. We divided the samples on the median and used the median as cut-offs for methylation markers used for Kaplan Meier. The LinkedOmics database (http://www.linkedomics.org/login.php) is an accessible platform designed for analyzing and comparing multidimensional datasets and clinical datasets from the Broad TCGA Firehose and Clinical Proteomic Tumor Analysis.34 We studied differentially expressed genes in correlation with hypermethylated SDC2 and TFPI2 using the LinkFinder module of Linkedomics including 392 TCGA CRC patients. Results were assessed via the Spearman correlation analysis and presented in the form of volcano plots and heat maps. What is more, we applied the LinkFinder results to analyze pathway and network by performing the LinkInterpreter module of LinkedOmics. The results were signed and ranked through the Kyoto Encyclopedia of Genes and Genomes (KEGG) pathways and gene set enrichment analysis (GSEA) containing cellular components, biological process, and molecular functions with the minimum number of genes being three, FDR < 0.05, and 500 simulations.
Sample Collection
All stool samples were given written informed consent and collected from patients at the Zhongnan Hospital of Wuhan University. The Medical Ethics Committee of Zhongnan Hospital of Wuhan University approved this study. The methylation status of SDC2 and TFPI2 in stool samples from 61 CRC patients, 16 adenomas, 53 healthy subjects (colonoscopy negative subjects), 37 gastric cancer patients (GC), and 13 subjects who had other kinds of gastrointestinal tumors (1 colonic lymphoma,4 liver cancer, 3 appendix carcinoma, 2 esophagus cancer, 2 duodenal carcinoma) were analyzed. Detailed characteristics of patients with stool samples were shown (Tables 1 and 2).
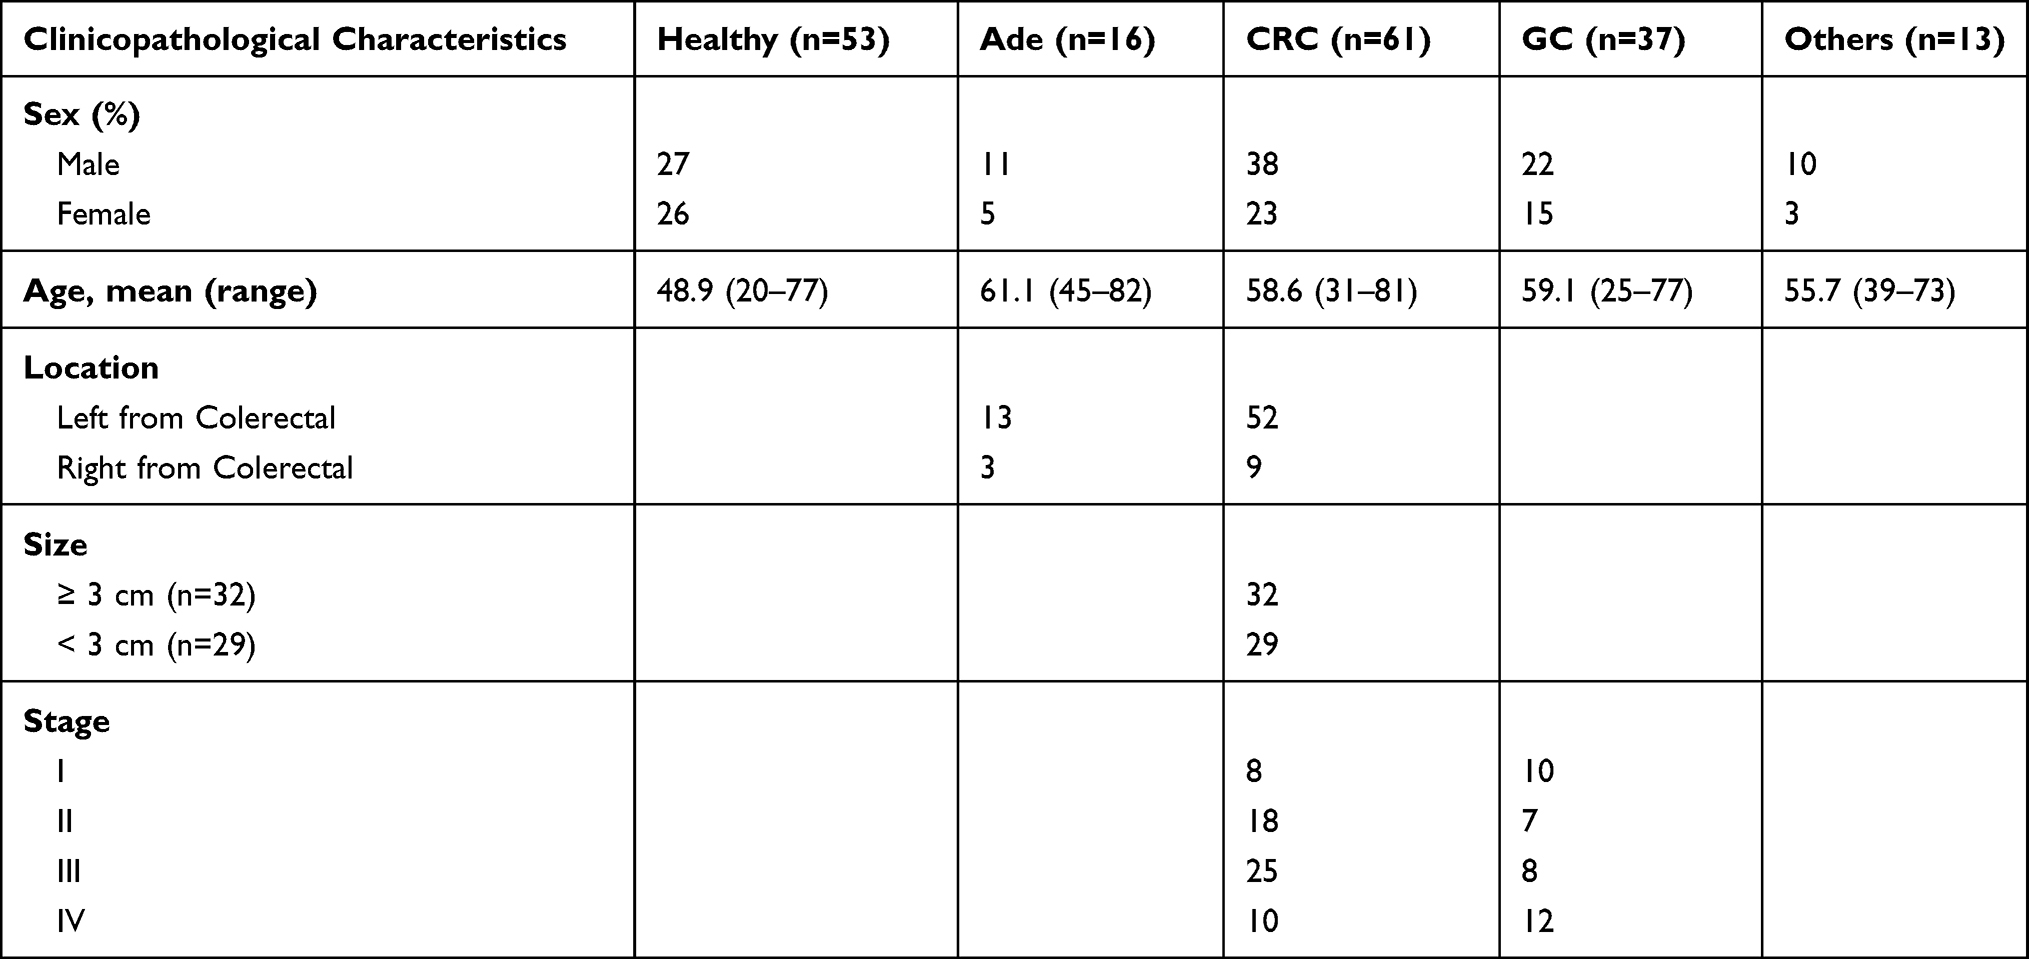 |
Table 1 Patient Characteristics of Stool Samples Used in This Study |
 |
Table 2 Other Clinicopathological Characteristics of Ade |
Stool samples (about 8 g per person) were transferred into 45 mL tubes containing 32 mL preservation buffer (200 mmol/L Tris·HCL, 300 mmol/L EDTA·2Na,150 mmol/L NaCL, ph 8.0). After collected, stool samples were kept at room temperature no more than 7 days before used.
This study was approved by the Institutional Review Board of Zhongnan Hospital.
Sample Processing and DNA Isolation
Preservative buffer was added to stool samples after vortex, the mixture was centrifuged at 12,000 rpm for 8 min. 25 mL of supernatant was then transferred to a new centrifuge tube. A 5 g crospovidone was added to the supernatant and incubated for 5 min at room temperature. After incubation, three times sequential centrifugation with 12,000 rpm for 5 min were conducted, for each time, 12.5 mL, 11 mL and 10 mL supernatant was collected sequentially to a new 50 mL tube for next centrifugation. The final resulting supernatant was added with 7.5 mL buffer A (mainly Guanidine thiocyanate) and homogenized, followed by incubation at 90°C for 10 min. After a rapid ice bath, a total of 45 μL trapping agent (Lcolocomf, China) was added to the tube and incubated in a horizontal shaker at 55 rpm at room temperature for 60 min. After incubation, the centrifuge tube was transferred to the magnetic separation rack wait 15 min for solution to clear, and the supernatant was discarded. Then, 1 mL buffer B (mainly EDTA-2Na and (HOCH2)3CNH2) was added to the 1.5mL/2mL centrifuge tube. After vortex mixing for 5 s, the buffer was briefly centrifuged for 2 s and placed on the magnetic separation rack for 2 min, and the supernatant was discarded. Repeat this step. Next, the 1.5 mL/2 mL centrifuge tube was added with 80 μL TE buffer and gently shaken and mixed, then put into a water bath kettle. After the temperature raised from room temperature to 55°C, the tube was taken out and then briefly centrifuged and placing on the magnetic separation rack for 2 min. Finally, the supernatant was moved to a 1.5 mL centrifuge tube, which was the need DNA solution. All purified DNA was kept at −20°C.
Bisulfite Conversion
A commercial kit EZ DNA Methylation kit (Wuhan A mmunition Life-tech Co, Ltd.) was used according to the manufacturer's instruction. The eluted DNA was immediately used for methylation analysis or kept at −20°C until further use.
Quantitative Methylation-Specific PCR (qMSP)
To quantitatively detect methylation levels of SDC2 and TFPI2, qMSP was performed. Specific primers were designed for the promoter region, including target genes and ACTB which was used as the internal control gene for effective sample collection and treatment to avoid false negatives. The following probes and primers were used (Table 3). The number of CG sites analyzed within the sequence of SDC2 and TFPI2 was 21 and 13, respectively. In brief, 5 μL bisulfite-modified DNA was amplified in a 25 μL reaction volume including 0.5 μL of 10 μM each primer, 0.5 μL of 10 μM each probe and 15.5 μL PCR master mix. The PCR was performed on ABI7500 (Thermo Fisher Scientific, USA) at 95°C for 5 min; 45 cycles at 95°C for 15 s, 60°C for 30 s.
 |
Table 3 Primers and Probes Used in This Study |
Data Analysis of Stool Samples
To get effective sample collection, ACTB was selected as a reference. If Ct value of ACTB was greater than 36, the stool sample was considered “invalid”. If Ct value of SDC2 or TFPI2 was less than 38, the stool sample was considered “detected”. Youden index (sensitivity + specificity - 1) was applied to evaluate the performance of methylated genes in detecting CRC and Ade. All statistical analyses with p<0.05 were considered statistically significant.
Results
The Association Between Promoter Methylation Levels of SDC2 and TFPI2 and the Clinicopathological Features in CRC
The multiple clinicopathological features of 37 normal samples and 313 CRC samples in the TCGA were analyzed by UALCAN. As a result, the promoter methylation levels of SDC2 (Figure 1A–H) and TFPI2 (Figure 2A–H) were significantly higher in CRC patients than that in healthy people according to age, gender, race, weight, histology, nodal metastasis status, or tumor grade. In particular, promoter methylation levels of SDC2 and TFPI2 increased as they aged. Therefore, methylation levels of SDC2 and TFPI2 may be potential diagnostic biomarkers in CRC.
 |
Figure 1 SDC2 promoter methylation level in subgroups of patients with CRC, stratified based on gender, age and other criteria (UALCAN). (A) Boxplot showing relative promoter methylation level of SDC2 in normal and CRC samples. (B) Boxplot showing relative promoter methylation level of SDC2 in normal individuals of either gender or male or female CRC patients. (C) Boxplot showing relative promoter methylation level of SDC2 in normal individuals of any age or in CRC patients aged 21–40, 41–60, 61–80, or 81–100 yr. (D) Boxplot showing relative promoter methylation level of SDC2 in normal individuals of either race or in CRC patients of Caucasian, African-American or Asian. (E) Boxplot showing relative promoter methylation level of SDC2 in normal individuals of either weight or in CRC patients with normal weight, extreme weight, obese or overweight. (F) Boxplot showing relative promoter methylation level of SDC2 in normal individuals or in CRC patients in stages 1, 2, 3 or 4 tumors. (G) Boxplot showing relative promoter level of SDC2 in normal individuals of either histology or adenocarcinoma or mucinous adenocarcinoma CRC patients. (H) Boxplot showing relative promoter methylation level of SDC2 in normal individuals of any nodal metastasis status or in CRC patients in N0, N1, N2. ***p< 0.001. |
 |
Figure 2 TFPI2 promoter methylation level in subgroups of patients with CRC, stratified based on gender, age and other criteria (UALCAN). (A) Boxplot showing relative promoter methylation level of TFPI2 in normal and CRC samples. (B) Boxplot showing relative promoter methylation level of TFPI2 in normal individuals of either gender or male or female CRC patients. (C) Boxplot showing relative promoter methylation level of TFPI2 in normal individuals of any age or in CRC patients aged 21–40, 41–60, 61–80, or 81–100 yr. (D) Boxplot showing relative promoter methylation level of TFPI2 in normal individuals of either race or in CRC patients of Caucasian, African-American or Asian. (E) Boxplot showing relative promoter methylation level of TFPI2 in normal individuals of either weight or in CRC patients with normal weight, extreme weight, obese or overweight. (F) Boxplot showing relative promoter methylation level of TFPI2 in normal individuals or in CRC patients in stages 1, 2, 3 or 4 tumors. (G) Boxplot showing relative promoter level of TFPI2 in normal individuals of either histology or adenocarcinoma or mucinous adenocarcinoma CRC patients. (H) Boxplot showing relative promoter methylation level of TFPI2 in normal individuals of any nodal metastasis status or in CRC patients in N0, N1, N2. ***p < 0.001. |
Heat Map for Different CpG Sites of Methylated SDC2 and TFPI2 in CRC
The comprehensive analysis of the association between clinicopathological features and methylation levels throughout the region of SDC2 and TFPI2 were performed by Methsurv in CRC. Gene regions and relation to CpG island of CpG sites of SDC2, TFPI2 and ACTB were drawn (Figure 3A–C). We found that most CpG sites of SDC2 were hypermethylated in CRC, especially in open sea regions and around the CpG islands. Likely, hypermethylated sites of TFPI2 lied mainly in the island and N Shore. However, when it comes to ACTB which is the internal control gene in our study, most CpG sites of it was hypomethylated in CRC. Besides, we also analyzed relative position distributions in different locations of a gene. The results showed that most hypermethylated sites for SDC2 lied on body regions, while most hypermethylated sites forTFPI2 fell onto body regions and 1stExon. Among them, cg24862252 (Body, Open_Sea), cg14408978 (Body, Open_Sea), cg14830748 (Body, Open_Sea), cg16962683 (Body, Open_Sea), cg14942501 (Body, Open_Sea) and cg26777303 (TSS1500, N_Shore) of SDC2 and cg09558850 (TSS1500, S_Shore), cg19854521 (TSS1500, S_Shore), cg18024479 (Body, N_Shore) and cg20230721 (Body, Island) of TFPI2 showed the highest DNA methylation level. As reference gene in our study, only cg26636061 (Body, N_Shore) of ACTB showed obviously high methylation level that demonstrated ACTB suits for internal control gene in our study.
 |
Figure 3 Heatmap for ACTB, SDC2 and TFPI2 in CRC. (A) The heatmap for ACTB in TCGA-CRC using MethSurv. (B) The heatmap for SDC2 in TCGA-CRC using MethSurv. (C) The heatmap for TFPI2 in TCGA-CRC using MethSurv. |
Methylation Status of SDC2 and TFPI2 Between CRC Tumors and Normal Tissues
As is known, promoter hypermethylation is a common mechanism of gene silence. To explore if the methylation status of SDC2 and TFPI2 may reduce the expression themselves, the in silico results from TCGA were acquired by using the online tool Wanderer. It showed that the methylation status of the promoter CpG sites of SDC2 and TFPI2 has a significant difference while most CpG sites of ACTB has none of significance between CRC tumors and normal tissues (Figure 4A–C). Approximately 94% and 100% of CpG sites were differentially methylated for SDC2 and TFPI2, respectively. These data indicated that the DNA methylation of SDC2 and TFPI2, rather than deletion, may contribute to the low expression of SDC2 and TFPI2 in CRC.
 |
Figure 4 Methylation levels of CpG citesof ACTB, SDC2 and TFPI2 in CRC and Normal. (A) Methylation levels throughout the region around ACTB gene between normal tissues and CRC tumors are compared. (B) Methylation levels throughout the region around SDC2 gene between normal tissues and CRC tumors are compared. (C) Methylation levels throughout the region around TFPI2 gene between normal tissues and CRC tumors are compared. Green probes indicate CpG islands. |
The Prognostic Values of Methylation Levels of SDC2 and TFPI2 in CRC
What is more, we explored prognosis analysis for methylation levels of SDC2 and TFPI2 using UCSC-XENA. However, no significance was found though hypermethylation of SDC2 and TFPI2 were associated with poor overall survival (Figure 5A and C). Besides, methylation levels of SDC2 and TFPI2 also had no correlation with disease-specific survival (Figure 5B and D). It suggested methylated SDC2 and TFPI2 did not take part in tumor progression. They may mainly affect the process of canceration and just be used to distinguish between CRC patients and non-cancer patients.
 |
Figure 5 Kaplan-Meier survival curves comparing the high and low methylation levels of SDC2 and TFPI2 in CRC patients (UCSC-XENA). (A) The overall survival curve for CRC patients with high or low methylation level of SDC2. (B) The disease-specific survival curve for CRC patients with high or low methylation level of SDC2. (C) The overall survival curve for CRC patients with high or low methylation level of TFPI2. (D) The disease survival curve for CRC patients with high or low methylation level of TFPI2. |
Enrichment Analysis of SDC2 and TFPI2 Methylation Functional Network in CRC
mRNA sequencing was analyzed by the LinkedOmics functional module using data from 393 CRC patients in TCGA. As is shown in the volcano plot, 627 genes (dark red dots) were significantly positively correlated with SDC2 hypermethylation, while there were 3801 genes (dark green dots) significantly negatively correlated with SDC2 hypermethylation (Figure 6A). A total of 986 genes were significantly positively correlated with TFPI2 hypermethylation, while 4477 genes were significantly negatively correlated with TFPI2 hypermethylation (Figure 7A) (p <0.05, false discovery rate [FDR] < 0.01). As can be seen from the heat maps (Figure 6B and C; Figure 7B and C), the top 50 significant gene sets were positively and negatively correlated with SDC2 and TFPI2 hypermethylation, respectively. Next, we used GESE to analyze GO functional enrichment by the results. The results demonstrated that differentially expressed genes related to SDC2 hypermethylation were mainly in the nucleoid, NADH dehydrogenase complex, and cytochrome complex, where they were responsible for mitochondrial RNA metabolic process, NADH dehydrogenase complex assembly, and cytoplasmic translation. The functional network also indicated that they participated in rRNA binding, damaged DNA binding, and structural constituent of the nuclear pore. What is more, the KEGG pathway enrichment suggested that SDC2 hypermethylation regulated DNA replication, ribosome biogenesis in eukaryotes, and base excision repair (Figure 8A–D). Similarly, differentially expressed genes in correlation with TFPI2 were referred to as a functional network including mitochondrial respiratory chain complex assembly, NADH dehydrogenase complex assembly and mitochondrial RNA metabolic process (Figure 9A–D). The KEGG pathway enrichment showed that TFPI2 hypermethylation affected base excision repair, RNA polymerase, and nucleotide excision repair. These data indicated that both methylated SDC2 and TFPI2 might participate in the occurrence of CRC by regulating tumor cells’ metabolic programs.
 |
Figure 6 Genes differentially expressed in correlation with SDC2 methylation in CRC (LinkedOmics). (A) A Pearson test was used to analyze correlations between SDC2 methylation and genes differentially expressed in CRC. (B and C) Heat maps showing genes positively and negatively correlated with SDC2 methylation in CRC (TOP 50). Red indicates positively correlated genes and green indicates negatively correlated genes. |
 |
Figure 7 Genes differentially expressed in correlation with TFPI2 methylation in CRC (LinkedOmics). (A) A Pearson test was used to analyze correlations between TFPI2 methylation and genes differentially expressed in CRC. (B and C) Heat maps showing genes positively and negatively correlated with TFPI2 methylation in CRC (TOP 50). Red indicates positively correlated genes and green indicates negatively correlated genes. |
 |
Figure 8 Significantly enriched GO annotations and KEGG pathways about SDC2 methylation in CRC. (A) Cellular components. (B) Biological processes. (C) Molecular functions. (D) KEGG pathway analysis. |
 |
Figure 9 Significantly enriched GO annotations and KEGG pathways about TFPI2 methylation in CRC. (A) Cellular components. (B) Biological processes. (C) Molecular functions. (D) KEGG pathway analysis. |
Clinical Validation of Methylation Status of SDC2 and TFPI2 by Using Stool Samples
The performance of methylated SDC2 and TFPI2 was also analyzed in stool samples. As a result, methylated SDC2 showed relatively high sensitivities of 68.8% and 77.0% in detecting Ade and CRC with a specificity of 98.1%. As for methylated TFPI2, it showed high sensitivities of 75% and 90.2% in detecting Ade and CRC with a specificity of 94.3% (Table 4). In contrast, the integration of methylated SDC2 and TFPI2 was more sensitive than methylated SDC2 and TFPI2 alone, and it also promoted the Youden index. The total positive detection rate for Ade and CRC stool samples was 81.3% and 93.4%, respectively, with a specificity of 94.3% and the positive detection rate was associated with the increasing severity of lesions (p <0.05).
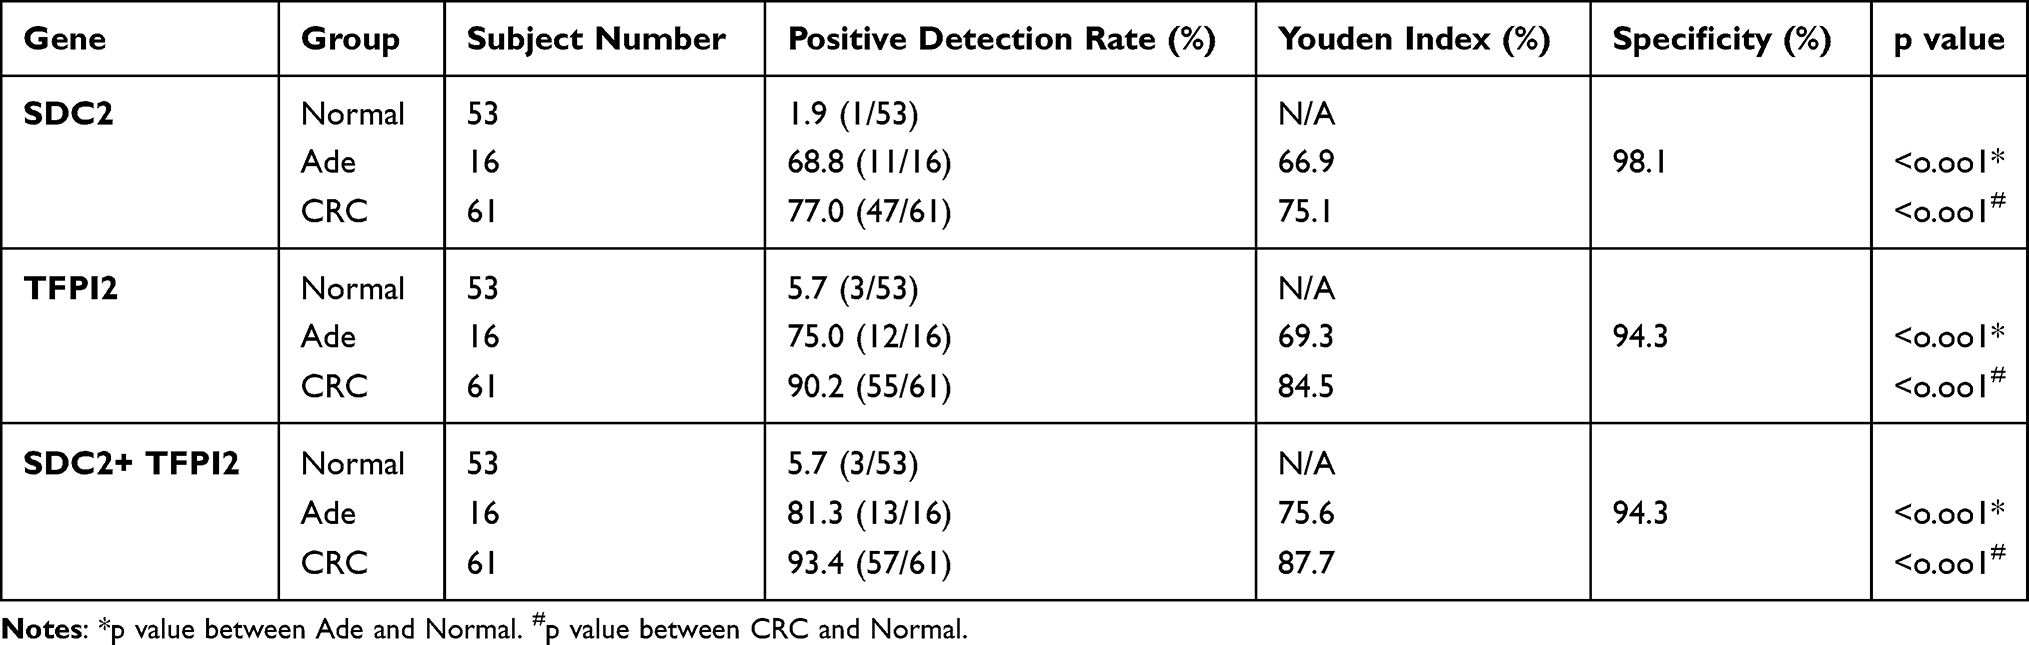 |
Table 4 Positive Detection Rates and Youden Indexes for Integration of Methylated SDC2 and TFPI2 in Detecting Normal, Ade and CRC in Stool Samples. N/A, Not Applicable |
Next, the correlation between SDC2 and TFPI2 methylation and clinicopathological features of CRC were explored. No significant correlation was found between positive detection rates of methylated SDC2 alone, methylated TFPI2 alone, or integration of these two methylated genes and sex, age, location, size, clinical stage and symptom in CRC stool samples (Table 5). In addition, the correlation between SDC2 and TFPI2 methylation and clinicopathological features of Ade were studied. There was no statistical relationship between positive detection rates of methylated SDC2 alone, methylated TFPI2 alone, or integration of these two methylated genes and sex, age, location, size, villous component and dysplasia in Ade stool samples (Table 6).
 |
Table 5 Correlation Between Methylation Detection Rate and the Clinicopathologic Features in CRC Stool Samples |
 |
Table 6 Correlation Between Methylation Detection Rate and the Clinicopathologic Features in Ade Stool Samples |
Furthermore, we compared the positive detection rates of methylated SDC2 and TFPI2 in different cancers including CRC, GC, and other gastrointestinal tumors in stool. The results showed that the total positive detection rate in GC and other gastrointestinal tumors stool samples was 35.1% and 21.4%, respectively, and obviously lower than that in CRC stool samples (p < 0.05) (Table 7). These results suggested that methylation detection of SDC2 and TFPI2 in the stool may be a valuable screening means for CRC.
 |
Table 7 Comparison of Methylation Detection of CRC, Gastric Cancer and Other Gastrointestinal Tumors |
Comparison of Integrated Methylation Detection of SDC2 and TFPI2 to Other Biomarkers in CRC
We also compared the performance of stool methylation detection with other methods of screening CRC including FOBT and tumor biomarkers by chi-square test. The results showed that methylation detection in stool samples was evidently better than FOBT and other biomarkers including AFP, CEA, CA125, CA153, and CA199 (Table 8) (p < 0.05).
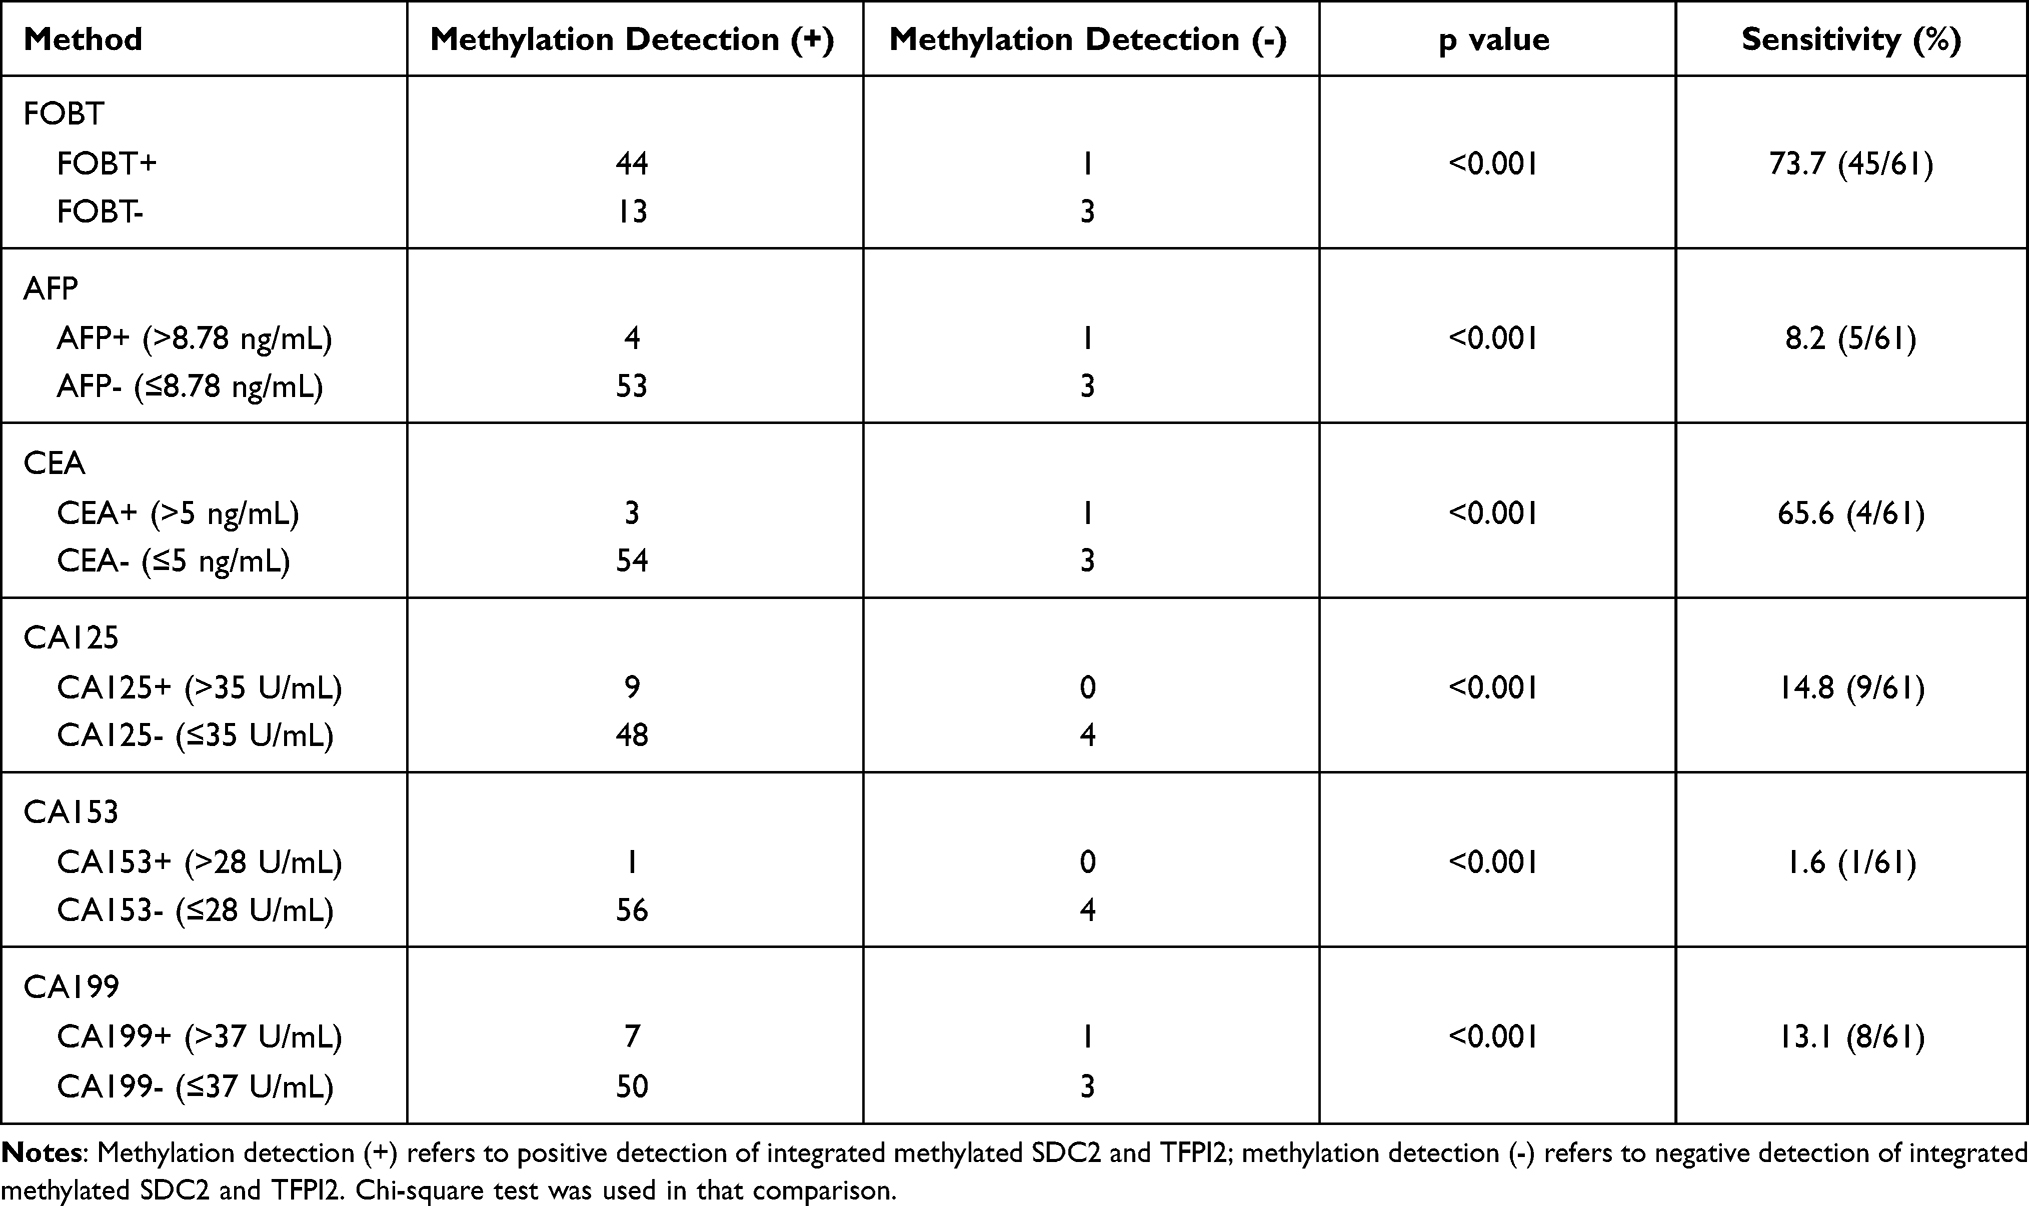 |
Table 8 Comparison of Integrated Detection of Methylated SDC2 and TFPI2 to Other Screening Methods in CRC |
Discussion
CRC is one of the most common malignant neoplasms.3 Early screening is one of the most efficient strategies to reduce incidence and mortality of CRC. Up to know, several tools have been widely used to screen CRC, including FOBT and colonoscopy. However, the sensitivity of FOBT for CRC is only 33.3–57.1%.10 Though colonoscopy is the most currently sensitive test, it is limited by the invasive and troublesome procedure. Neutrophil-to-lymphocyte ratio (NLR) appears to a potentially valuable biomarker, which is a blood parameter that is easily obtained in daily clinical practice. NLR has been repeatedly reported as a significant prognostic factor in advanced CRC patients. Importantly, changes in the NLR may be a useful predicting factor in those treated with anti-PD-1/PD-L1 agents.35 However, the diagnostic role of NLR in CRC remains undefined. In CRC, CpG island methylator phenotype (CIMP+) is more often observed in older patients, females and high-grade proximal tumors, which are usually BRAF-mutated and mismatch repair (MMR) deficient. In addition, MLH1 promoter hypermethylation leading to MMR deficiency through gene silencing has been found in a subset of CIMP+ tumors. As such, CIMP status seems to be an emerging biomarker in CRC, because of its distinct mutations.36 Recently, detection of aberrantly methylated genes in the stool has been recommended as a new alternative method for early screening of CRC.37 Previous studies indicated that integrated detection of different genes might promote the screening efficiency.38 SDC2 and TFPI2 had been reported hypermethylated in CRC and can be easily detected in DNA from different kinds of bodily fluids, including serum and stool.26,27,39,40 Our study indicated that most CpG sites of SDC2 and TFPI2 were hypermethylated in CRC tissues and methylated SDC2 and TFPI2 has a high positive detection rate in CRC and Ade in stool samples. Integrated detection of methylated SDC2 and TFPI2 in stool has high potential to be a noninvasive and efficient method of early screening for CRC.
Previous studies have confirmed that SDC2 and TFPI2 were aberrantly methylated in CRC tissues.26,27 We used public databases to perform target gene analyses. It was confirmed that promoter methylation levels of SDC2 and TFPI2 were significantly higher in CRC tissues than in normal tissues based on various clinicopathological features. The results demonstrated that the promoter methylation levels of SDC2 and TFPI2 had no correlation with gender, age, race, weight, histology, nodal metastasis status, and tumor grade. These results provide strong evidence for the feasibility of methylated SDC2 and TFPI2 in detecting CRC. Further research indicated that most CpG sites of SDC2 and TFPI2 were hypermethylated and they mainly lied on body regions and 1stExon. What is more, methylation levels of SDC2 and TFPI2 were both not correlated with overall survival and disease-specific survival. The results suggested that methylated SDC2 and TFPI2 might mainly play a role in the carcinogenesis of CRC and did not participate in the progression of CRC. Syndecan 2 protein is a cell surface heparan sulfate proteoglycan that can facilitate cell proliferation and migration via interaction with extracellular matrix proteins.19 TFPI2 is a matrix-associated Kunitz-type serine proteinase inhibitor that can suppress cell proliferation, angiogenesis, tumor growth, and metastasis.23 Expression of TFPI2 may be inactivated by promoter methylation. However, methylated SDC2 might perform complex functions. Related functional networks indicated that methylated SDC2 in CRC was associated with DNA replication, ribosome biogenesis in eukaryotes, and base excision repair, while methylated TFPI2 might be jointly involved in mitochondrial respiratory chain complex assembly, NADH dehydrogenase complex assembly, and mitochondrial RNA metabolic process. The enrichment analysis results indicated that both methylated SDC2 and TFPI2 might participate in the occurrence of CRC by regulating tumor cells’ metabolic programs. In this study, online tools were used based on the most popular bioinformatics theories to perform related methylation analysis on tumor data from public databases. The advantages of this method were that there were a large sample size, simplicity, and low cost. This enables large-scale research about methylation of CRC and subsequent functional studies.
Generally, aberrantly methylated genes in solid tumors are suited biomarkers for early cancer detection and can be easily detected in stool samples.41 In a previous study, the overall sensitivity of methylated SDC2was 90.0% for CRC and 33.3% for advanced adenoma,26 with a specificity of 90.9% by Linear Target Enrichment-quantitative methylation-specific PCR in stool samples. The sensitivity of TFPI2 methylation was 76–89% for detection of stage I to III CRC and 33.3% for detection of advanced adenoma,27 with a specificity of 79% to 93% in stool samples. On the other hand, in plasma samples, the sensitivities for detecting Ade and CRC by methylated SDC2 were 33.3% and 56.6% with a specificity of 95.6%28 and the sensitivity by methylated TFPI2 for CRC were 88% with a specificity of 95.6%.29 In our study, methylated SDC2 in stool samples detected 77.0% of CRC and 68.8% of Ade, with a specificity of 98.1%, while methylated TFPI2 in stool samples detected 90.2% of CRC and 75% of Ade, with a specificity of 94.3%. The specificities and sensitivities for Ade of two genes were both higher than previous study. However, the sensitivity of methylated SDC2 for CRC was lower than previous results while the sensitivity of methylated TFPI2 for CRC was higher than previous results. In contrast, the integration of methylated SDC2 and methylated TFPI2 led to higher sensitivities for CRC and Ade and a higher specificity than previous results. In addition, integration of methylated SDC2 and methylated TFPI2 showed a higher sensitivity than single-gene detection for CRC and Ade in this study. What is more, the integration of methylated SDC2 and methylated TFPI2 showed a Youden index of 87.7% and 75.6% for CRC and Ade, respectively, which was higher than single-gene detection in our study. Methylation rates in both CRC and Ade showed significant differences from normal patients and methylation rate in stool samples increased as the severity of lesions. Similar to results of tissue samples from public databases, methylation rates of SDC2 and TFPI2 in CRC stool samples were irrelevant to sex, age, location, clinical stage, and symptom status. Similarly, methylation rates of SDC2 and TFPI2 in Ade stool samples were and sex, age, location, size, villous component and dysplasia. Meanwhile, methylation detection of CRC in stool showed a clear advantage over FOBT and the biomarkers such as CEA, CA153, and CA199. However, further studies with larger patient cohorts were necessary to assess the performance of methylated SDC2 and TFPI2 in detecting CRC in stool samples.
It is widely reported that the role of DNA methylation biomarkers in early screening of CRC.14,42,43 Microsatellite instability (MSI) is caused by mutations in the mismatch repair gene with the consequent inability to correct DNA errors that take place during cell replication. Mismatch repair genes are inactivated either as a result of sporadic MLH1 promoter hypermethylation, or germline mutations in MLH1, MSH2, MSH6 and PMS2 genes. It is now recommended that MSI status should be evaluated in all newly diagnosed CRC cases. This important clinical information with prognostic value for stage II CRC can be used as a screening marker to identify Lynch syndrome patients, and may predict response to immunotherapy in patients with stage IV disease.44 Single methylation markers showed low sensitivity or specificity in stool samples such as SFRP2 which showed a sensitivity of 77–90% for CRC with specificity of 77%45 and HIC1 which showed a sensitivity of 42% for CRC with specificity of 100%.43 Though multiple molecular targets sacrificed specificity, it significantly enhances sensitivity. Integrated detection of methylated SFRP2, HPP1, and MGMT showed a sensitivity of 96.2% for CRC with specificity of 95.8%.46 Our study indicated that not only sensitivity but also the Youden index of multiple molecular targets was higher than that of single methylation markers. Multiple methylation markers may be a good efficient method for screening early CRC in the future.
This study demonstrated the importance of SDC2 and TFPI2 methylation in screening CRC at multiple levels. At the same time, this study has some limitations. One is the relatively small number of stool samples, which may result in fluctuations in the performance assessment. Another limitation is that the stool samples were mostly from eastern Asia. Therefore, large-scale studies of clinical validation of SDC2 and TFPI2 methylation and in-depth evaluation of ethnic or regional differences in the future will be needed.
Conclusion
The findings from the bioinformatics network analysis study identified the role of SDC2 and TFPI2 methylation in the occurrence of CRC. Integrated detection of methylated SDC2 and TFPI2 in stool samples demonstrated high sensitivities for AA and CRC. It was feasible to use SDC2 and TFPI2 methylation as new biomarkers for a noninvasive tool of CRC early screening.
Abbreviations
SDC2, syndecan-2; TFPI2, tissue factor pathway inhibitor 2; CRC, colorectal cancer; Ade, adenoma; GO, Gene Ontology; KEGG, Kyoto Encyclopedia of Genes and Genomes; FOBT, blood testing; FIT, fecal immunochemical test; GSEA, gene set enrichment analysis; GC, gastric cancer.
Data Sharing Statement
All data generated in this study can be obtained by contacting the corresponding author.
Ethics Approval and Consent to Participate
This study was approved by the Ethics Committee of Medicine of Wuhan University, and written informed consent was obtained from all study participants. Sample collection was conducted in accordance with the Declaration of Helsinki.
Acknowledgments
This study was supported by grants from National Natural Science Foundation of China (81872376), National Natural Science Fund Youth Fund of China (81702411), and Health Commission of Hubei Province Scientific Research Project (WJ2019H012). We would like to acknowledge the staffs at Wuhan Ammunition Life-tech Co. Ltd for their technical assistance.
Author Contributions
All authors made substantial contributions to conception and design, acquisition of data, or analysis and interpretation of data; took part in drafting the article or revising it critically for important intellectual content; agreed to submit to the current journal; gave final approval of the version to be published; and agree to be accountable for all aspects of the work.
Disclosure
The authors declare no conflicts of interest in this work.
References
1. Rasool S, Kadla SA, Rasool V, Ganai BA. A comparative overview of general risk factors associated with the incidence of colorectal cancer. Tumour Biol. 2013;34(5):2469–2476. doi:10.1007/s13277-013-0876-y
2. Sung H, Ferlay J, Siegel RL, et al. Global cancer statistics 2020: GLOBOCAN estimates of incidence and mortality worldwide for 36 cancers in 185 countries. CA Cancer J Clin. 2021. doi:10.3322/caac.21660
3. Siegel RL, Miller KD, Jemal A. Cancer statistics, 2020. CA Cancer J Clin. 2020;70(1):7–30. doi:10.3322/caac.21590
4. Bray F, Ferlay J, Soerjomataram I, Siegel RL, Torre LA, Jemal A. Global cancer statistics 2018: GLOBOCAN estimates of incidence and mortality worldwide for 36 cancers in 185 countries. CA Cancer J Clin. 2018;68(6):394–424. doi:10.3322/caac.21492
5. Dashwood RH. Early detection and prevention of colorectal cancer (review). Oncol Rep. 1999;6(2):277–281.
6. Bresalier RS, Kopetz S, Brenner DE. Blood-based tests for colorectal cancer screening: do they threaten the survival of the FIT test? Dig Dis Sci. 2015;60(3):664–671. doi:10.1007/s10620-015-3575-2
7. Bray C, Bell LN, Liang H, Collins D, Yale SH. Colorectal cancer screening. WMJ. 2017;116(1):27–33.
8. Issa IA, Noureddine M. Colorectal cancer screening: an updated review of the available options. World J Gastroenterol. 2017;23(28):5086–5096. doi:10.3748/wjg.v23.i28.5086
9. Wolf AMD, Fontham ETH, Church TR, et al. Colorectal cancer screening for average-risk adults: 2018 guideline update from the American Cancer Society. CA Cancer J Clin. 2018;68(4):250–281. doi:10.3322/caac.21457
10. Tinmouth J, Lansdorp-Vogelaar I, Allison JE. Faecal immunochemical tests versus guaiac faecal occult blood tests: what clinicians and colorectal cancer screening programme organisers need to know. Gut. 2015;64(8):1327–1337. doi:10.1136/gutjnl-2014-308074
11. Chen H, Li N, Ren J, et al. Participation and yield of a population-based colorectal cancer screening programme in China. Gut. 2019;68(8):1450–1457. doi:10.1136/gutjnl-2018-317124
12. Lee JK, Liles EG, Bent S, Levin TR, Corley DA. Accuracy of fecal immunochemical tests for colorectal cancer: systematic review and meta-analysis. Ann Intern Med. 2014;160(3):171. doi:10.7326/M13-1484
13. Okugawa Y, Grady WM, Goel A. Epigenetic alterations in colorectal cancer: emerging biomarkers. Gastroenterology. 2015;149(5):1204–1225.e1212.
14. Zhang H, Zhu YQ, Wu YQ, Zhang P, Qi J. Detection of promoter hypermethylation of Wnt antagonist genes in fecal samples for diagnosis of early colorectal cancer. World J Gastroenterol. 2014;20(20):6329–6335. doi:10.3748/wjg.v20.i20.6329
15. Kadiyska T, Nossikoff A. Stool DNA methylation assays in colorectal cancer screening. World J Gastroenterol. 2015;21(35):10057–10061. doi:10.3748/wjg.v21.i35.10057
16. Widschwendter M, Menon U. Circulating methylated DNA: a new generation of tumor markers. Clin Cancer Res. 2006;12(24):7205–7208. doi:10.1158/1078-0432.CCR-06-2531
17. Fiegl H, Millinger S, Mueller-Holzner E, et al. Circulating tumor-specific DNA: a marker for monitoring efficacy of adjuvant therapy in cancer patients. Cancer Res. 2005;65(4):1141–1145. doi:10.1158/0008-5472.CAN-04-2438
18. Board RE, Knight L, Greystoke A, et al. DNA methylation in circulating tumour DNA as a biomarker for cancer. Biomark Insights. 2008;2:307–319.
19. Mytilinaiou M, Nikitovic D, Berdiaki A, et al. Emerging roles of syndecan 2 in epithelial and mesenchymal cancer progression. IUBMB Life. 2017;69(11):824–833. doi:10.1002/iub.1678
20. Marion A, Dieudonné FX, Patiño-Garcia A, Lecanda F, Marie PJ, Modrowski D. Calpain-6 is an endothelin-1 signaling dependent protective factor in chemoresistant osteosarcoma. Int J Cancer. 2012;130(11):2514–2525. doi:10.1002/ijc.26246
21. Sun M, Gomes S, Chen P, et al. RKIP and HMGA2 regulate breast tumor survival and metastasis through lysyl oxidase and syndecan-2. Oncogene. 2014;33(27):3528–3537. doi:10.1038/onc.2013.328
22. Ryu HY, Lee J, Yang S, et al. Syndecan-2 functions as a docking receptor for pro-matrix metalloproteinase-7 in human colon cancer cells. J Biol Chem. 2009;284(51):35692–35701. doi:10.1074/jbc.M109.054254
23. Sierko E, Wojtukiewicz MZ, Kisiel W. The role of tissue factor pathway inhibitor-2 in cancer biology. Semin Thromb Hemost. 2007;33(7):653–659. doi:10.1055/s-2007-991532
24. Sato N, Parker AR, Fukushima N, et al. Epigenetic inactivation of TFPI-2 as a common mechanism associated with growth and invasion of pancreatic ductal adenocarcinoma. Oncogene. 2005;24(5):850–858. doi:10.1038/sj.onc.1208050
25. Wong CM, Ng YL, Lee JM, et al. Tissue factor pathway inhibitor-2 as a frequently silenced tumor suppressor gene in hepatocellular carcinoma. Hepatology. 2007;45(5):1129–1138. doi:10.1002/hep.21578
26. Oh TJ, Oh HI, Seo YY, et al. Feasibility of quantifying SDC2 methylation in stool DNA for early detection of colorectal cancer. Clin Epigenetics. 2017;9(1):126. doi:10.1186/s13148-017-0426-3
27. Glöckner SC, Dhir M, Yi JM, et al. Methylation of TFPI2 in stool DNA: a potential novel biomarker for the detection of colorectal cancer. Cancer Res. 2009;69(11):4691–4699. doi:10.1158/0008-5472.CAN-08-0142
28. Zhao G, Ma Y, Li H, et al. A novel plasma based early colorectal cancer screening assay base on methylated SDC2 and SFRP2. Clin Chim Acta. 2020;503:84–89. doi:10.1016/j.cca.2020.01.010
29. Bagheri H, Mosallaei M, Bagherpour B, Khosravi S, Salehi AR, Salehi R. TFPI2 and NDRG4 gene promoter methylation analysis in peripheral blood mononuclear cells are novel epigenetic noninvasive biomarkers for colorectal cancer diagnosis. J Gene Med. 2020;22(8):e3189. doi:10.1002/jgm.3189
30. Chandrashekar DS, Bashel B, Balasubramanya SAH, et al. UALCAN: a portal for facilitating tumor subgroup gene expression and survival analyses. Neoplasia. 2017;19(8):649–658. doi:10.1016/j.neo.2017.05.002
31. Modhukur V, Iljasenko T, Metsalu T, Lokk K, Laisk-Podar T, Vilo J. MethSurv: a web tool to perform multivariable survival analysis using DNA methylation data. Epigenomics. 2018;10(3):277–288. doi:10.2217/epi-2017-0118
32. Diez-Villanueva A, Mallona I, Peinado MA. Wanderer, an interactive viewer to explore DNA methylation and gene expression data in human cancer. Epigenetics Chromatin. 2015;8(1):22. doi:10.1186/s13072-015-0014-8
33. Goldman MJ, Craft B, Hastie M, et al. Visualizing and interpreting cancer genomics data via the Xena platform. Nat Biotechnol. 2020;38(6):675–678. doi:10.1038/s41587-020-0546-8
34. Vasaikar SV, Straub P, Wang J, Zhang B. LinkedOmics: analyzing multi-omics data within and across 32 cancer types. Nucleic Acids Res. 2018;46(D1):D956–D963. doi:10.1093/nar/gkx1090
35. Moschetta M, Uccello M, Kasenda B, et al. Dynamics of neutrophils-to-lymphocyte ratio predict outcomes of PD-1/PD-L1 blockade. Biomed Res Int. 2017;2017:1506824. doi:10.1155/2017/1506824
36. Zarkavelis G, Boussios S, Papadaki A, Katsanos KH, Christodoulou DK, Pentheroudakis G. Current and future biomarkers in colorectal cancer. Ann Gastroenterol. 2017;30(6):613–621. doi:10.20524/aog.2017.0191
37. Stracci F, Zorzi M, Grazzini G. Colorectal cancer screening: tests, strategies, and perspectives. Front Public Health. 2014;2:210. doi:10.3389/fpubh.2014.00210
38. Liu R, Su X, Long Y, et al. A systematic review and quantitative assessment of methylation biomarkers in fecal DNA and colorectal cancer and its precursor, colorectal adenoma. Mutat Res. 2019;779:45–57. doi:10.1016/j.mrrev.2019.01.003
39. Oh T, Kim N, Moon Y, et al. Genome-wide identification and validation of a novel methylation biomarker, SDC2, for blood-based detection of colorectal cancer. J Mol Diagn. 2013;15(4):498–507. doi:10.1016/j.jmoldx.2013.03.004
40. Hibi K, Goto T, Shirahata A, et al. Detection of TFPI2 methylation in the serum of colorectal cancer patients. Cancer Lett. 2011;311(1):96–100. doi:10.1016/j.canlet.2011.07.006
41. Osborn NK, Ahlquist DA. Stool screening for colorectal cancer: molecular approaches. Gastroenterology. 2005;128(1):192–206. doi:10.1053/j.gastro.2004.10.041
42. Chen WD, Han ZJ, Skoletsky J, et al. Detection in fecal DNA of colon cancer-specific methylation of the nonexpressed vimentin gene. J Natl Cancer Inst. 2005;97(15):1124–1132. doi:10.1093/jnci/dji204
43. Lenhard K, Bommer GT, Asutay S, et al. Analysis of promoter methylation in stool: a novel method for the detection of colorectal cancer. Clin Gastroenterol Hepatol. 2005;3(2):142–149. doi:10.1016/S1542-3565(04)00624-X
44. Boussios S, Ozturk MA, Moschetta M, et al. The developing story of predictive biomarkers in colorectal cancer. J Pers Med. 2019;9(1):12. doi:10.3390/jpm9010012
45. Muller HM, Oberwalder M, Fiegl H, et al. Methylation changes in faecal DNA: a marker for colorectal cancer screening? Lancet. 2004;363(9417):1283–1285. doi:10.1016/S0140-6736(04)16002-9
46. Barták BK, Kalmár A, Péterfia B, et al. Colorectal adenoma and cancer detection based on altered methylation pattern of SFRP1, SFRP2, SDC2, and PRIMA1 in plasma samples. Epigenetics. 2017;12(9):751–763. doi:10.1080/15592294.2017.1356957
 © 2021 The Author(s). This work is published and licensed by Dove Medical Press Limited. The
full terms of this license are available at https://www.dovepress.com/terms
and incorporate the Creative Commons Attribution
- Non Commercial (unported, 3.0) License.
By accessing the work you hereby accept the Terms. Non-commercial uses of the work are permitted
without any further permission from Dove Medical Press Limited, provided the work is properly
attributed. For permission for commercial use of this work, please see paragraphs 4.2 and 5 of our Terms.
© 2021 The Author(s). This work is published and licensed by Dove Medical Press Limited. The
full terms of this license are available at https://www.dovepress.com/terms
and incorporate the Creative Commons Attribution
- Non Commercial (unported, 3.0) License.
By accessing the work you hereby accept the Terms. Non-commercial uses of the work are permitted
without any further permission from Dove Medical Press Limited, provided the work is properly
attributed. For permission for commercial use of this work, please see paragraphs 4.2 and 5 of our Terms.