
Back to Journals » Journal of Inflammation Research » Volume 18

SCIN: A Key Driver in Chronic Atrophic Gastritis-Gastric Cancer Cascade with Implications for Immunity and Prognosis
Authors Wu K, Ye Y, Pei B, Song B, Li T, Yang Q, Jin Y, Li X
Received 8 June 2025
Accepted for publication 2 September 2025
Published 10 September 2025 Volume 2025:18 Pages 12485—12503
DOI https://doi.org/10.2147/JIR.S545499
Checked for plagiarism Yes
Review by Single anonymous peer review
Peer reviewer comments 2
Editor who approved publication: Dr Junhao Wang
Kairui Wu,1,* Yu Ye,1,* Bei Pei,1 Biao Song,2 Tingting Li,2 Qi Yang,2 Yueping Jin,2 Xuejun Li2
1Graduate School, Anhui University of Chinese Medicine, Hefei, Anhui, People’s Republic of China; 2Department of Gastroenterology, The Second Affiliated Hospital of Anhui University of Chinese Medicine, Hefei, Anhui, People’s Republic of China
*These authors contributed equally to this work
Correspondence: Yueping Jin, Email [email protected] Xuejun Li, Email [email protected]
Background: Gastric cancer (GC) is a major global health burden, and chronic atrophic gastritis (CAG), a key precancerous lesion in the Correa cascade, is critical in its pathogenesis. As a Ca²+-dependent actin-regulating protein, scinderin (SCIN) has been implicated in tumor progression across multiple malignancies, including gastric cancer. This study investigated SCIN expression dynamics during CAG-to-GC progression, its association with the tumor immune microenvironment (TIME) and clinical prognosis, and validated its role via integrated bioinformatics and experiments.
Methods: Transcriptomic data from TCGA and GEO were analyzed using R. WGCNA and ceRNA networks identified SCIN as the core RNA and its interacting miRNAs/lncRNAs. GSVA, GSEA, immune infiltration, and checkpoint analyses explored SCIN’s immunological relevance. Prognostic value was assessed via Cox models and ROC curves. SCIN expression was validated in 28 human gastric tissues by RT-qPCR and Western blotting. Functional assays (CCK-8, Transwell, flow cytometry) investigated its role in GC cells.
Results: SCIN expression significantly increased along normal mucosa→CAG→GC, with high diagnostic performance (AUC). Elevated SCIN correlated with poor survival and served as an independent prognostic factor. It was involved in immune-related pathways, modulated the TIME, and correlated with immune checkpoint markers. SCIN knockdown inhibited GC cell migration, enhanced apoptosis, and altered cell cycle.
Conclusion: This study is the first to identify SCIN as a key molecular driver in the CAG-to-GC transition. SCIN represents a robust prognostic biomarker and a potential target for immunotherapeutic intervention in GC.
Keywords: SCIN, gastric cancer, chronic atrophic gastritis, Correa cascade, immunity
Introduction
According to the latest global cancer statistics from the International Agency for Research on Cancer (IARC), gastric cancer (GC) is the fifth most frequently diagnosed malignancy worldwide, accounting for 4.9% of new cancer cases and 6.8% of cancer-related deaths.1 Due to the absence of specific symptoms in the precancerous and early stages of GC, coupled with low public awareness and limited screening uptake,2 the majority of patients are diagnosed at an advanced stage. In the well-established Correa cascade,3 chronic atrophic gastritis (CAG) represents the earliest defined stage of precancerous gastric lesions (PLGC) and is a critical determinant for the subsequent development of gastric adenocarcinoma.4 However, clinical tools for monitoring the malignant transformation from CAG to GC remain inadequate. Traditional endoscopic biopsy is invasive and often associated with poor patient compliance,5 and there is a lack of validated molecular biomarkers to track the stepwise progression from chronic gastritis to CAG, gastric intestinal metaplasia (GIM), dysplasia, and ultimately GC. To address this gap, our study focuses on three pivotal stages within the Correa cascade—healthy controls, CAG, and GC. By integrating multi-omics bioinformatics analysis with experimental validation, we aim to identify core molecular drivers of the CAG–GC transition. This approach has the potential to overcome current diagnostic limitations by providing non-invasive biomarkers and uncovering novel therapeutic targets to interrupt gastric tumorigenesis at an early stage.
This study analyzed RNA sequencing data and clinicopathological information from the TCGA and GEO databases, with all operations adhering to the respective database guidelines. The integrated strategy of weighted gene co-expression network analysis (WGCNA) and ceRNA network has been validated as effective for identifying key regulatory molecules in studies on colorectal cancer, hepatocellular carcinoma, and cervical cancer.6–8 Based on this, the present study applied this strategy to screen key regulatory factors in the progression from CAG to GC and verify their functions. It also used the CIBERSORT algorithm to assess immune cell infiltration and constructed a three-stage risk stratification model (control group - chronic atrophic gastritis group - gastric cancer group) via multivariate Cox regression to clarify SCIN’s clinical value. For experimental validation, 28 gastric tissue specimens from the Department of Gastroenterology, Second Affiliated Hospital of Anhui University of Chinese Medicine were used (Ethics Approval No.: 2022-zj-37), and in vitro functional experiments were performed to elucidate SCIN’s mechanistic role in CAG-to-GC progression.
Materials and Methods
RNA Sequencing Dataset Acquisition
RNA-sequencing (RNA-seq) datasets were obtained from the GEO (https://www.ncbi.nlm.nih.gov/geo/) and TCGA (https://portal.gdc.cancer.gov/) databases, incorporating healthy control and GC samples. Prior to unified analysis in R, all data underwent standardized preprocessing: first, genes with expression levels (TPM/FPKM) < 1 in ≥50% of samples were excluded to retain high-confidence expressed genes; batch effects were then corrected using quantile normalization via the “ComBat” function from the R package “sva”, followed by log2 transformation to ensure consistent expression scales; for genes corresponding to multiple probes, mean expression values were calculated using the “dplyr” package by grouping genes by their symbols. Based on the preprocessed data, DEGs among Control, CAG, and GC groups were systematically identified using the “limma” package for group comparisons, with screening thresholds set as |log2 FC| > 1 and adjusted P-value (FDR) < 0.05. Venn diagram analysis was used to determine the intersection of DEGs across datasets, yielding a core gene set.
WGCNA
To investigate the potential regulatory role of SCIN during the Control-CAG-GC progression, a gene co-expression network was constructed using the “WGCNA” R package (v 1.71). The optimal soft thresholding power was selected to establish a scale-free topological overlap matrix (TOM). Genes were hierarchically clustered using the hclust function, and modules were defined using the Dynamic Tree Cut algorithm. Module-trait relationships were analyzed to identify gene clusters significantly associated with gastric lesion progression. DEGs from GEO datasets GSE27411 and GSE116312 were integrated, and their intersection with module genes from CAG- and GC-associated modules was defined as the core DEG set for downstream analyses.
Construction of ceRNA Interaction Network
A comprehensive lncRNA-miRNA-mRNA competing endogenous RNA (ceRNA) network centered on SCIN was constructed to explore its regulatory landscape. Candidate miRNAs targeting SCIN were identified using the miRDB database (https://mirdb.org) with a Target Score threshold > 80. Corresponding lncRNAs interacting with these miRNAs were predicted via the ENCORI platform (https://rnasysu.com/encori/index.php). The resulting interaction data were imported into Cytoscape software (version 3.9.1) for visualization and topological analysis of the SCIN-centered ceRNA network. To verify the physical binding between hsa-miR-4775 and SCIN 3’UTR, sequence alignment and binding energy analysis were performed. The mature sequence of hsa-miR-4775 (5′→3′) and complementary segment of SCIN 3’UTR (3′→5′) were retrieved from miRBase (https://www.mirbase.org) and NCBI Reference Sequence (NM_000345.4), respectively. Binding energy calculation and secondary structure prediction were conducted using RNAhybrid (https://bibiserv.cebitec.uni-bielefeld.de/rnahybrid) with parameters: minimum free energy (MFE) hybridization mode, human 3’UTR dataset (-s 3utr_human), and threshold ≤-15 kcal/mol. Complementarity between the seed region (positions 2–8) of hsa-miR-4775 and SCIN 3’UTR was prioritized. Sequence alignment diagrams were generated using “ggplot2” package (v3.4.4), with solid lines indicating Watson-Crick pairs and dashed lines for G-U wobble pairs. Binding energy values were integrated to validate the thermodynamic stability of the interaction.
GSVA and GSEA
To elucidate the biological functions and regulatory pathways associated with DEGs in the Correa cascade, enrichment analyses were performed across Control-CAG and CAG-GC comparisons. GSVA and GSEA were employed to identify significantly enriched pathways and biological processes. Functional annotation was conducted using the “clusterProfiler” R package, with Gene Ontology (GO) and Kyoto Encyclopedia of Genes and Genomes (KEGG) databases (significance threshold: P < 0.05). GO terms were classified into three categories: Biological Process (BP), Cellular Component (CC), and Molecular Function (MF). GSEA was further performed on the Oebiotech Cloud Platform (https://cloud.oebiotech.com) under stringent criteria (enrichment score [ES] > 0.5, P < 0.05, false discovery rate [FDR] < 0.25) to validate key signaling pathways.
Immune Infiltration Analysis
To investigate differences in the tumor immune microenvironment between GC and control groups, immune cell infiltration levels in the TCGA-STAD cohort were quantified using the CIBERSORT algorithm. The correlation between SCIN expression and immune infiltration was visualized to assess potential immune relevance. Given the pivotal role of immune checkpoint molecules in modulating responses to immunotherapy, the co-expression patterns of SCIN with three key immune checkpoints—PD-1, PD-L1, and CTLA-4—were analyzed using scatter plots and Pearson correlation analysis. Additionally, immune infiltration profiles were compared between SCIN high- and low-expression subgroups to evaluate SCIN’s potential as a novel immunotherapeutic target in GC.
Univariate Cox Regression and ROC Curve Analysis
To assess the prognostic value of SCIN expression in CAG and GC, univariate Cox proportional hazards regression was performed using the “survival” R package. Predictive accuracy was further evaluated using ROC curve analysis. Clinical and expression data from three independent cohorts—TCGA-STAD, GSE27411, and GSE116312—were integrated to perform cross-dataset validation. Analyses were conducted via the Bioinformatics Online Analysis Platform (http://www.bioinformatics.com.cn).
Clinical Sample Validation
Quantitative Real-Time PCR (RT-qPCR)
Total RNA was extracted from gastric tissue samples using TRIzol reagent (12897014 CN; Life Technologies), and reverse transcription was performed using the TaKaRa reverse transcription kit (RR079A). A 10-μL RT-qPCR reaction system was prepared, containing 2×SYBR Green mixture (5 μL), forward and reverse primers (10 μM, 1 μL each), cDNA template (1 μL), and RNase-Free water (2 μL). The amplification protocol included initial denaturation at 95°C for 1 min, followed by 40 cycles of denaturation at 95°C for 20s. β-actin served as the internal control, and relative expression levels of SCIN were calculated using the 2−ΔΔCt method. Primers were designed by Sangon Biotech: SCIN: forward: 5′-CACTGAGTGGCAGTTGCATT-3′, reverse: 5′-GGCCCAACAATTCTGAGCTT-3′; β-actin: forward: 5′-CCCTGGAGAAGAGCTACGAG-3′, and reverse: 5′-GGAAGGAAGGCTGGAAGAGT-3′.
Western Blot Analysis
Gastric tissue samples were lysed in RIPA buffer (P0025B, Beyotime), and supernatants were collected following centrifugation. Sodium dodecyl sulfate polyacrylamide gel electrophoresis (SDS-PAGE) loading buffer (ZLI-8059, Zs-BIO) was added, and protein samples were denatured in boiling water for 15 min. After cooling to room temperature, proteins were separated by SDS-PAGE and transferred to polyvinylidene fluoride (PVDF, IPVH00031, Millipore), membranes (0.22 μm). Membranes were pre-activated with methanol for 2–3 min and equilibrated in a transfer buffer for 5 min. Protein transfer was conducted using a wet transfer system (VE-186, Tanon) (100 V, 60 min). Membranes were blocked with 5% non-fat milk for 1 h at room temperature and incubated overnight at 4°C with primary antibodies: anti-SCIN (bs-0812R; Bioss) and anti-β-actin (TA-08; Zsbio). The following day, membranes were incubated with HRP-conjugated secondary antibodies (ZB-2508, Zsbio) (1:5000) for 1.2 h at room temperature and washed three times in PBST (10 min per wash). Protein bands were visualized using enhanced chemiluminescence (ECL) reagent (BL820A; Biosharp) and quantified using ImageJ software (v1.53).
In vitro Experiment Validation
Cell Culture and Transfection
The human gastric epithelial cell line GES-1 and gastric cancer cell lines MGC-803, SGC-7901, and MKN-45 were obtained from the Cell Bank of the Chinese Academy of Sciences (Shanghai, China). Docetaxel was purchased from Jiangsu Hengrui Medicine Co., Ltd. (China). All cell lines were cultured in RPMI-1640 medium supplemented with 10% fetal bovine serum (FBS) and 1% penicillin-streptomycin. Cells were maintained at 37°C in a humidified atmosphere containing 5% CO2 and were regularly labeled with cell type and passage date for traceability. For siRNA transfection, cells were seeded in 6-well plates at a density of 5×10⁵ cells/well and incubated for 24 h to reach approximately 80% confluence. Transfection was performed using Lipofectamine 3000 (Thermo Fisher Scientific), with 500 μL of transfection complex added per well according to the manufacturer’s protocol. After 4–6 h, the medium was replaced with fresh complete medium, and cells were cultured for an additional 48 h before collection. Transfection efficiency was confirmed by RT-qPCR. Three SCIN-targeting siRNA sequences were designed and synthesized by Shanghai GenePharma Co., Ltd.: siRNA-SCIN 1: sense 5′-AAUAGUCAUCCAUCUGAACAG-3′, antisense 5′-GUUCAGAUGGAUGACUAUUUG-3′; siRNA-SCIN 2: sense 5′-UUGAAGUUCUCUAUUCUGCA-3′, antisense 5′-GCAGAAUAGAGAACUUCAAGG-3′; siRNA-SCIN 3: sense 5′-UAUAGUUUAGCCAUUUUCCUG-3′, antisense 5′-GGAAAAUGGCUAAACUAUACA-3′.
Transwell Migration Assay
Cells in the logarithmic growth phase were digested with trypsin, resuspended in serum-free RPMI-1640 (SH30526.01, Cytiva), and adjusted to a final concentration of 2×10⁵ cells/mL. A 200 μL cell suspension was seeded into the upper chamber of a Transwell insert (8 μm pore size, 2677; Corning). The lower chamber was filled with 600 μL RPMI-1640 medium supplemented with 10% FBS (10099–141; Gibco) as a chemoattractant. After incubation for 24 h at 37°C with 5% CO2, non-migrated cells on the upper surface of the membrane were removed using a cotton swab. Migrated cells on the lower surface were fixed with 4% paraformaldehyde for 30 min at room temperature, stained with 0.5% crystal violet for another 30 min, and washed thoroughly with PBS. Six random fields per insert were imaged under a light microscope at 40× magnification. Migrated cells were manually counted, and data were expressed as the average number of cells per field.
Cell Viability Assay
Cells in the logarithmic phase were harvested with trypsin (C0201; Beyotime Biotechnology), centrifuged, and resuspended in a complete medium. A single-cell suspension was prepared at a density of 4×10⁴ cells/mL. Then, 100 μL of the suspension (approximately 5000 cells/well) was seeded into 96-well plates. Peripheral wells were filled with sterile PBS (SH30256.01; Cytiva) to minimize edge effects. After overnight incubation to allow cell adherence, cells were treated according to experimental conditions and incubated for an additional 48 h. Subsequently, 10 μL of CCK-8 reagent (BS350B; Biosharp) was added to each well, followed by incubation at 37°C for 1–4 h. Absorbance was measured at 450 nm using a microplate reader, and cell viability was calculated based on optical density (OD) values. Growth curves were plotted to assess proliferation capacity.
Flow Cytometry Analysis of Apoptosis and Cell Cycle
Cells were harvested by trypsinization, washed twice with ice-cold PBS (SH30256.01; Cytiva), and resuspended at a density of 1–10×105 cells/mL. For apoptosis detection, cells were resuspended in 500 μL of 1× Binding Buffer (diluted from 5× stock with ddH2O), followed by the addition of 5 μL Annexin V-FITC (AP105; MultiSciences) and 10 μL propidium iodide (PI) staining solution. Samples were gently vortexed and incubated for 5 min at room temperature in the dark. Apoptotic cells were immediately analyzed by flow cytometry. For cell cycle analysis, cells were fixed in pre-cooled 70% ethanol for a minimum of 2 h or overnight at 4°C following PBS washing. Fixed cells were centrifuged to remove ethanol, washed twice with ice-cold PBS, and incubated with 0.5 mL of PI/RNase staining buffer for 15 min at room temperature in the dark. Samples were then analyzed using a CytoFLEX flow cytometer (BECKMAN). Data were processed using FlowJo software (Tree Star, Inc)., and cell cycle phase distribution was further evaluated using ModFit LT software.
Statistical Analysis
All statistical analyses were conducted using R software (version 4.4.0) and SPSS (version 25.0). Continuous variables are expressed as mean ± standard deviation (SD). For two-group comparisons, Student’s t-test was used for normally distributed data, while the Wilcoxon rank-sum test was applied for non-normally distributed data. For comparisons among three or more groups, one-way analysis of variance (ANOVA) followed by post hoc testing was employed. Spearman’s rank correlation analysis was used to assess associations between variables. Survival outcomes were evaluated using univariate Cox proportional hazards regression. Prognostic accuracy was assessed via ROC curve analysis. For RT-qPCR validation, categorical data were compared using the χ2 test. All experiments were independently repeated at least three times. Correlations between SCIN expression and immune checkpoint markers were analyzed using GraphPad Prism (version 10.0.2). A P-value < 0.05 was considered statistically significant.
Results
Multi-Omics Integration Identifies SCIN as a Key Upregulated Gene in the Control-CAG-GC Progression
Transcriptomic datasets from GSE27411 (6 control vs 6 CAG samples), GSE116312 (3 CAG vs 3 GC samples), and the TCGA-STAD cohort (36 control vs 412 GC samples) were integrated for analysis. Only Homo sapiens samples were retained following stringent filtering. As a result, 1920 DEGs 961 upregulated/959 downregulated) were identified in the TCGA-STAD cohort, 239 DEGs (175 upregulated/64 downregulated) in GSE27411, and 503 DEGs (351 upregulated/152 downregulated) in GSE116312. Volcano plots illustrated the distribution of significantly dysregulated genes across the three datasets (Figure 1A and B). Venn diagram analysis (Figure 1C) revealed two overlapping DEGs—SCIN and CYP2C8. Subsequent expression profiling and statistical comparison of SCIN across the three datasets (Figure 1D–F) demonstrated consistent and progressive upregulation from the control group to CAG and finally to GC.
 |
Figure 1 SCIN is significantly upregulated in CAG and GC. (A) Volcano plot of DEGs in GSE27411 (|log2FC| > 1 and P < 0.05). (B) Volcano plot of DEGs in GSE116312 (|log2FC| > 1 and P < 0.05). (C) Venn diagram of core DEGs across GSE27411, GSE116312, and TCGA-STAD datasets. (D) Bar chart showing SCIN expression levels between the CAG Group and Control Group in GSE27411, *P < 0.05. (E) Bar chart showing SCIN expression levels between the CAG Group and GC Group in GSE116312, **P < 0.01. (F) Bar chart showing SCIN expression levels between the Control Group and GC Group in TCGA-STAD, ****P < 0.0001. |
WGCNA-Based Identification of Hub Genes in the CAG-GC Transition
WGCNA was performed to further screen hub genes involved in the CAG-GC transition. Scale-free co-expression networks were constructed for the GSE27411 (scale-free R2 = 0.8, soft-threshold power β = 16) and GSE116312 (R2 = 0.74, β = 30) datasets (Figures 2A, B and 3A, B). Hierarchical clustering identified 18 gene modules in GSE27411 (including blue, darkred, darkorange, etc.; Figure 2C) and 20 modules in GSE116312 (including darkseagreen4, honeydew1, coral1, etc.; Figure 3C). Highly interconnected adjacent genes (AGs) were identified through module partitioning. Module-trait correlation analysis revealed that the blue (r=0.78, P=0.003), darkred (r=0.63, P=0.03), darkgreen (r=0.65, P=0.02), and steelblue (r=0.6, P=0.04) modules in GSE27411 were significantly associated with CAG, while the coral1 (r=0.9, P=0.01), floralwhite (r=0.87, P=0.02), and darkred (r=0.94, P=0.005) modules in GSE116312 were significantly linked to CAG-GC transformation. Genes from these significant modules were extracted for further investigation. TOM-based hierarchical clustering produced dendrograms (Figures 2D and 3D), leading to the identification of SCIN as the only overlapping gene across both datasets. Based on this finding, a three-stage risk prediction model (Control-CAG-GC) was constructed to further validate the significance of SCIN in GC.
 |
Figure 2 Characteristics of SCIN in GSE27411. (A) Scale-free network with optimal soft-threshold (R²=0.8). (B) Power check based on the optimal soft-threshold of 16. (C) Heatmap of module-trait correlation analysis based on CAG samples; ME (Module Eigenvalue). (D) Gene clustering dendrogram of CAG samples. |
 |
Figure 3 Characteristics of SCIN in GSE116312. (A) Scale-free network with optimal soft-threshold (R²=0.74). (B) Power check based on the optimal soft-threshold of 30. (C) Heatmap of module-trait correlation analysis based on CAG Group and GC Group; ME (Module Eigenvalue). (D) Gene clustering dendrogram of CAG Group and GC Group. |
SCIN-Centered ceRNA Network Reveals Multilayered Regulatory Interactions in GC Progression
To explore the upstream regulatory mechanisms of SCIN, ten SCIN-targeting miRNAs were identified using the miRDB database. Subsequently, lncRNAs interacting with these miRNAs were predicted via the ENCORI platform, resulting in 118 potential lncRNA-miRNA-mRNA regulatory relationships. Analysis of key regulatory axes identified several core miRNAs, including hsa-miR-4775, hsa-miR-6881-3p, hsa-miR-7111-3p, hsa-miR-489-3p, and hsa-miR-3185. Notably, hsa-miR-489-3p was predicted to interact with the lncRNAs PURPL, MIR124-1HG, and SNHG1; hsa-miR-1252-5p with MRPL20-AS1, MIR3142HG, and TDRG1; and hsa-miR-3163 with Z99943.1, DNM3OS, and TNR-IT1. These findings support a complex ceRNA regulatory mechanism. The resulting SCIN-centered lncRNA-miRNA-mRNA regulatory network was constructed and visualized using Cytoscape (Figure 4), highlighting SCIN as a central hub within this multilayered regulatory axis.
 |
Figure 4 SCIN-related ceRNA interactions. (A) Schematic diagram of ceRNA network construction. Red represents mRNA, Orange represents miRNA, and light yellow represents lncRNA. (B) Secondary structure diagram of hsa-miR-4775. (C) Energy distribution topographic map of hsa-miR-4775. (D) Sequence binding diagram of SCIN and hsa-miR-4775. |
Among these, hsa-miR-4775 is a core regulator with significant functional relevance. Notably, hsa-miR-4775 has been confirmed to promote invasion and metastasis in gastrointestinal malignancies by activating the Smad7/TGFβ-mediated epithelial-mesenchymal transition (EMT) pathway.9 It is predicted to form multiple lncRNA-miRNA-mRNA axes with SCIN to regulate gastric cancer progression. To visually verify their physical binding, Figure 4B–D illustrates the molecular interaction between hsa-miR-4775 and SCIN 3’UTR: in the secondary structure of hsa-miR-4775, the critical seed region (positions 2–8) exhibits favorable binding energy (ΔG≈-12.40 kcal/mol, Figure 4B); the energy distribution shows a distinct energy trough in the seed region (Figure 4C), which drives stable binding; sequence alignment confirms their interaction via Watson-Crick pairing (solid lines) and G-U wobble pairing (dashed lines), with near-perfect complementarity in the seed region and a binding energy of −32.5 kcal/mol (Figure 4D), confirming a thermodynamically stable physical interaction.
GSVA and GSEA Reveal SCIN-Associated Enrichment in Lipid Metabolism and Epithelial Remodeling Pathways
To further elucidate SCIN-associated biological functions across disease stages, GSVA and GSEA were performed. In the Control vs CAG comparison, GSEA identified significant enrichment in KEGG pathways related to fat digestion and absorption, cholesterol metabolism, vitamin digestion and absorption, steroid hormone biosynthesis, and bile secretion (Figure 5A). GO enrichment analysis revealed notable enrichment in BP terms, such as cholesterol homeostasis, steroid metabolic process, triglyceride homeostasis, and cholesterol efflux; in CC terms, including brush border, brush border membrane, apical plasma membrane, very-low-density lipoprotein particle, and peroxisomal matrix; and in MF terms, such as aminopeptidase activity, metalloaminopeptidase activity, glucuronosyltransferase activity, and cholesterol transfer activity (Figure 5B). For the CAG vs GC comparison, GSEA revealed enrichment in KEGG pathways related to organismal systems, metabolism, and human diseases (Figure 5C). GO analysis showed significant terms in BP terms, including digestive system process, digestion, xenobiotic metabolic process, organic anion transport, and cellular response to xenobiotic stimulus; in CC terms, such as apical part of cell, AGE-RAGE signaling pathway in diabetic complications, apical plasma membrane, and brush border; and in MF terms, including vitamin binding, secondary active transmembrane transporter activity (Figure 5D). Further GSEA stratified by SCIN expression revealed that high SCIN expression in the Control-CAG group was associated with significant enrichment of fat digestion and absorption (ES=0.857, NES=2.48, P<0.001, FDR<0.001) and cholesterol metabolism (ES=0.74, NES=2.28, P<0.001, FDR<0.001) pathways (Figure 5E and F). In the CAG-GC group, high SCIN expression corresponded with enriched pathways involving brush border (ES=0.754, NES=2.31, P<0.001, FDR<0.001) and aminopeptidase activity (ES=0.838, NES=2.23, P<0.001, FDR<0.001) (Figure 5G and H). These findings are further supported by the enrichment heatmaps displayed in Figure 6A and B.
 |
Figure 5 Functional enrichment analysis of SCIN. (A and B) KEGG bar plot and GO bubble plot of GSVA for GSE27411. (C and D) KEGG bar plot and GO bubble plot of GSVA for GSE116312. (E and F) GSEA analysis plots for GSE27411. (G and H) GSEA analysis plots for GSE116312. |
 |
Figure 6 Enrichment analysis heatmaps of SCIN. (A) GSEA heatmap for the Fat digestion and absorption pathway. (B) GSEA heatmap for the Cholesterol metabolism pathway. |
SCIN Promotes Pro-Inflammatory Immune Cell Infiltration and Immune Checkpoint Suppression
The association between SCIN expression and immune cell infiltration was assessed using the CIBERSORT algorithm. A comparative analysis of immune infiltration patterns between the control and GC groups revealed distinct differences in the abundance of 22 immune cell types, visualized as stacked bar charts (Figure 7A). SCIN expression was notably elevated in GC samples enriched with Macrophages M0, Macrophages M1, CD4+ memory activated T cells, naive B cells, follicular helper T cells, and regulatory T cells (Tregs). Conversely, in the control group, higher SCIN expression was observed in eosinophils, resting mast cells, monocytes, and plasma cells (Figure 7B). Further subgroup analysis within the GC cohort (Figure 7C) demonstrated that high SCIN expression was significantly associated with increased infiltration of resting mast cells, Macrophages M2, and monocytes, whereas Tregs, Macrophages M0, and resting NK cells were significantly decreased (P<0.05). Additionally, correlation analysis between SCIN expression and three immune checkpoint molecules—PDCD1 (PD-1), CTLA4, and CD274 (PD-L1)—revealed significant negative correlations (Figure 7D–F), with correlation coefficients of r2 = 0.3488, 0.5714, and 0.3119, respectively.
 |
Figure 7 Immune infiltration analysis. (A) Immunocyte stacked bar chart of the GC Group. (B) Box plots of 22 immune cell types between the Control Group and GC Group analyzed by the CIBERSORT algorithm, ns P>0.05, *P<0.05, **P<0.01, ***P<0.001, ****P<0.0001. (C) Correlation heatmap between 22 immune cell types and SCIN expression in GC. (D–F) Scatter plots analyzing the correlation between SCIN expression levels and the expression levels of three immune checkpoints (PDCD1, CTLA4, and CD274). |
SCIN Serves as an Independent Prognostic Factor and Early Diagnostic Biomarker in GC
Survival analysis indicated that elevated SCIN expression was significantly associated with poorer overall survival (OS) in GC patients (P=0.022, HR=1.086; Figure 8A). Kaplan-Meier survival curves derived from the TCGA-STAD cohort further confirmed that patients with high SCIN expression had significantly reduced OS compared to those with low SCIN expression (P<0.0001; Figure 8B). To evaluate the diagnostic value of SCIN, receiver operating characteristic (ROC) curve analysis was performed. The area under the curve (AUC) values were 0.926 for the Control vs CAG group, 0.857 for the CAG vs GC group, and 0.7832 for the Control vs GC group (Figure 8C–E).
 |
Figure 8 Results of univariate Cox regression and ROC curve analysis for SCIN. (A) Random forest plot in GC samples (P=0.022, HR=1.086). (B) Optimal survival curve of the SCIN model in GC samples (P<0.0001). (C-E) ROC curves of SCIN in GSE27411, GSE116312, and TCGA-STAD datasets. |
Validation of SCIN Upregulation Along the Correa Cascade in Clinical Gastric Tissue Samples
To verify the progressive upregulation of SCIN expression observed in bioinformatics analyses, an independent clinical cohort consisting of 28 human gastric tissue specimens was examined. Samples were collected from the Second Affiliated Hospital of Anhui University of Chinese Medicine between August 2023 and January 2025, including 8 control, 12 CAG, and 8 GC specimens. RT-qPCR results demonstrated a significant stepwise increase in SCIN mRNA expression along the Control-CAG-GC sequence (P<0.01; Figure 9A). Western blot analysis further confirmed a corresponding elevation in SCIN protein levels, with significantly higher expression observed in the CAG and GC groups compared to the control group (P<0.001). Moreover, SCIN expression was markedly higher in the GC group than in the CAG group (P<0.001; Figure 9B and C).
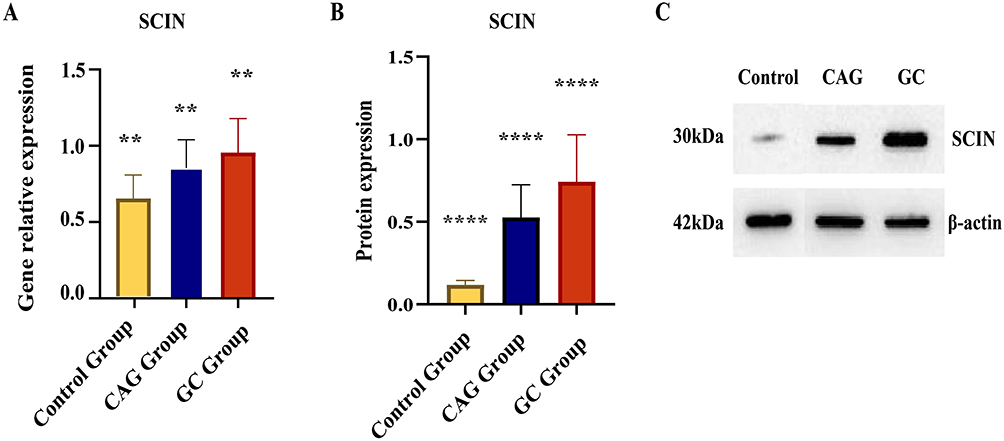 |
Figure 9 RT-qPCR and WB results. (A) Bar chart of SCIN gene expression levels in each group detected by RT-qPCR, **P<0.01. (B and C) Bar chart of SCIN protein expression levels and protein electrophoresis bands in each group detected by WB, ****P<0.0001. |
SCIN Promotes GC Cell Proliferation and Migration While Inhibiting Apoptosis by Facilitating S/G2 Phase Cell Cycle Progression
Based on the integrative bioinformatics analysis and clinical validation indicating high SCIN expression in GC, we hypothesized that SCIN plays a functional role in promoting GC malignancy. This hypothesis was systematically evaluated through a series of in vitro experiments. First, SCIN expression was assessed in three GC cell lines—MGC-803, SGC-7901, and MKN-45—as well as in normal human gastric epithelial cells (GES-1). RT-qPCR analysis revealed significantly elevated SCIN expression in all GC cell lines compared to GES-1 (P<0.001), with the highest expression observed in MGC-803 cells (Figure 10A). Three siRNA sequences targeting SCIN were designed and transfected into MGC-803 cells (Figure 10B), and siRNA-SCIN 1 was selected for downstream functional assays based on its superior knockdown efficiency. CCK-8 assays demonstrated that SCIN knockdown significantly reduced cell viability compared to the negative control (siRNA-NC) group (Figure 10C). Transwell migration assays further showed that silencing SCIN markedly suppressed cell migration capacity (Figure 10D and E). Flow cytometry analysis revealed that SCIN knockdown significantly promoted apoptosis (Figure 11A and B) and induced cell cycle arrest at the S/G2 phase (Figure 11C and D). Specifically, SCIN silencing resulted in a reduced proportion of cells in the G1 phase and an increased proportion in the S and G2 phases, indicating that SCIN facilitates cell cycle progression by promoting the G1-to-S/G2 phase transition. Collectively, these findings confirm that SCIN enhances GC cell proliferation and migration while inhibiting apoptosis, primarily by accelerating cell cycle progression from the G1 to S/G2 phases, thereby contributing to GC progression and malignancy.
 |
Figure 10 Knockdown of SCIN inhibits viability and migration of MGC-803 cells. (A) Relative expression of SCIN mRNA in GES-1, MGC-803, SGC-7901, and MKN-45 cells was measured by RT-qPCR. ****P < 0.0001 vs GES-1. (B) RT-qPCR detection of SCIN mRNA expression after knockdown. ****P < 0.0001 vs siRNA-NC. (C) Cell viability was measured using the Cell Counting Kit-8 assay. (D) Migration of SCIN-knockdown cells was studied by Transwell assay, observed under a microscope at 40× magnification. (E) Bar chart of the number of migrated cells under the microscope. ****P < 0.0001 vs siRNA-NC. |
 |
Figure 11 Flow cytometry analysis of apoptosis and cell cycle. (A) Apoptosis analysis: Knockdown of SCIN promoted apoptosis in MGC-803 cells. (B) Bar chart showing the apoptosis rate (%) in each group. ****P < 0.0001 vs siRNA-NC. (C) Cell cycle analysis: SCIN promoted the proliferation of MGC-803 cells. (D) Bar chart showing the cell cycle distribution in each group. **P < 0.01 vs siRNA-NC. |
To validate the reliability of the experimental system and compare the effects between SCIN knockdown and conventional chemotherapy (docetaxel), a high-dose docetaxel (DTX) treatment group as a positive control in this study.10 Results showed that after 50 nM docetaxel treatment, MGC-803 cells exhibited significantly decreased viability (comparable to the si-SCIN group), markedly impaired migration, significantly increased apoptosis rate, and cell cycle arrest at the S/G2 phase (Figures 10C–10E and 11A–11D). These findings confirm that both SCIN knockdown and high-dose DTX intervention can significantly inhibit malignant phenotypes (proliferation, migration) of gastric cancer cells, promote apoptosis, and induce cell cycle arrest, with similar efficacy. This supports the oncogenic function of SCIN—its high expression maintains the malignant characteristics of gastric cancer cells, while SCIN knockdown mimics the tumor-suppressive effects of chemotherapeutic drugs, further confirming the pro-carcinogenic role of SCIN in gastric cancer progression.
Discussion
GC remains one of the leading causes of cancer-related mortality worldwide, with more than one million new cases diagnosed annually.11 Its pathogenesis follows a well-characterized premalignant sequence, known as the Correa cascade,12 with CAG serving as a critical intermediate stage13 (Correa cascade: normal gastric mucosa → chronic gastritis → CAG → intestinal metaplasia/dysplasia → GC).14 Histologically, atrophic gastritis is marked by the loss of acid-secreting parietal cells in the gastric mucosa, accompanied by replacement with immature glandular and epithelial cell populations,15 creating a pathological environment conducive to the development of intestinal-type gastric carcinoma.16 Although endoscopy is currently the gold standard for monitoring CAG and assessing GC risk,17 its utility in large-scale screening is limited by technical complexity, operator variability, and restricted accessibility. These limitations highlight the need for complementary non-invasive approaches. Incorporating personalized risk stratification into current screening frameworks may significantly enhance the efficiency of early detection.18 Therefore, there is an urgent need for robust, serological early-warning biomarkers and therapeutic targets for individuals with precancerous gastric lesions (PLGC) to address the global burden of GC.
Scinderin (SCIN), a Ca2+-dependent actin-severing and -capping protein of the gelsolin superfamily,19 has been implicated in modulating cell proliferation, migration, and differentiation across multiple malignancies, including gastric,20 prostate,21 lung,22 glioma,23 hepatocellular,24 and breast cancers.25 These findings suggest that SCIN plays a role in tumor progression and may serve as a marker of metastatic potential. In the present study, we comprehensively investigated the dynamic expression profile and functional role of SCIN across the Control-CAG-GC continuum. By integrating multi-omics bioinformatics analysis with in vitro and in vivo experimental validation, we demonstrated for the first time that SCIN is a critical molecular driver of CAG-to-GC progression and established SCIN as a multifunctional biomarker with potential utility in early diagnosis, prognostic assessment, and therapeutic targeting of GC.
We performed differential expression analysis and screening of RNA-seq data from the TCGA, GEO, and starBase databases using R language, followed by Venn diagram analysis. Subsequently, we constructed WGCNA and ceRNA interaction networks.26 This integrative approach identified SCIN, hsa-miR-489-3p, and SNHG1 as core differentially expressed RNAs. Ahram et al demonstrated through PCR array analysis that hsa-miR-489-3p was significantly upregulated in non-metastatic subtypes of triple-negative breast cancer, suggesting its role in modulating metastatic potential based on expression profiles and clinical subtype.27 Similarly, Xu et al reported that SNHG1, identified through RNA sequencing and validated by in vitro and in vivo experiments, could serve as a potential diagnostic and therapeutic target in colorectal cancer.28 To further explore the biological functional characteristics of the SCIN high-expression group, this study analyzed the results of GSEA and GSVA by stratified comparison among the Control, CAG, and GC groups. The KEGG and GO enrichment results of the SCIN high-expression group in the comparison between the Control Group and CAG Group indicated that SCIN may drive gastric epithelial atrophy and promote lipid accumulation in gastric mucosa during the CAG stage by disturbing cholesterol homeostasis, inducing mitochondrial dysfunction and oxidative stress.29,30 Oxidative stress plays a complex role in the malignant transformation of gastric cancer. Single-cell sequencing studies have shown that there is heterogeneity in the response of different cells in gastric cancer tissues and their microenvironment to oxidative stress, and this imbalance may create conditions for the survival of cancer cells.31 Chronic inflammation caused by Helicobacter pylori can induce oxidative stress,32 which promotes malignant transformation of cells through DNA damage, interference with apoptosis, and other mechanisms. Moreover, excessive reactive oxygen species generated by oxidative stress can damage cellular components, prompting cells to acquire malignant phenotypes.33 In the subsequent CAG vs GC comparison, the SCIN-high group continued to exhibit enrichment in the GO-CC term “brush border” (ES=0.754, NES=2.31, FDR<0.001) and the GO-MF term “aminopeptidase activity” (ES=0.838, NES=2.23, FDR<0.001), alongside aberrant activation of the KEGG pathway “Bile secretion”. These results indicate that SCIN may impair the digestive and absorptive functions of the gastric mucosal barrier. Given the essential role of the brush border in nutrient digestion, its dysfunction could compromise mucosal repair mechanisms and accelerate the progression from intestinal metaplasia to dysplasia.34
One of the central findings of this study is the significant and progressive upregulation of SCIN throughout the Correa cascade. From normal gastric mucosa to CAG, and ultimately to GC, SCIN expression increased markedly at both the mRNA and protein levels. This trend was robustly confirmed through comprehensive bioinformatics analyses—integrating multiple independent datasets from TCGA and GEO—and further validated in clinical specimens via RT-qPCR and Western blot analysis. The consistent correlation between SCIN expression and disease severity suggests that aberrant activation of SCIN constitutes an early and critical molecular event in the malignant transformation of CAG to GC. Importantly, ROC curve analysis demonstrated that SCIN expression levels had excellent discriminative power in distinguishing CAG from GC, with high AUC values.35 These results provide strong molecular evidence for the potential application of SCIN in risk stratification and early intervention strategies for patients with precancerous gastric lesions.36 As a quantifiable molecular marker, SCIN may offer distinct advantages over conventional histopathology and endoscopic surveillance by aiding in the identification of high-risk CAG patients, thereby optimizing follow-up intervals and enhancing early GC detection rates.2 Furthermore, survival analysis underscored the clinical significance of SCIN. Using a multivariate Cox proportional hazards regression model, we demonstrated that high SCIN expression independently predicts shorter OS in GC patients.37 Notably, this prognostic value remained significant even after adjusting for established clinicopathological parameters, including TNM stage, age, and sex. These findings suggest that SCIN can provide additional prognostic granularity—distinguishing between patients with similar clinical staging but differing risks of recurrence and mortality.
To delve into the functional role of SCIN in GC oncogenesis and progression, we performed a series of in vitro gain- and loss-of-function assays. Transwell migration and invasion assays revealed that SCIN silencing markedly attenuated the invasive and migratory capacities of GC cells, while promoting apoptosis and accelerating cell cycle progression, as assessed by flow cytometry with PI staining. Consistently, CCK-8 assays demonstrated that inhibition of SCIN significantly reduced cell viability and proliferation. These phenotypic alterations are in line with the known molecular function of SCIN—promoting pseudopod formation through depolymerization of F-actin filaments, thereby providing structural support for cellular motility and metastatic dissemination.38 Immune infiltration analysis using the CIBERSORT algorithm, along with immune checkpoint profiling, further revealed that elevated SCIN expression was significantly associated with increased infiltration of specific immune cell subsets in GC tissues, including Macrophages M0, Macrophages M1, CD4+ memory activated T cells, and naive B cells. Among these, tumor-associated macrophages (TAMs) are known to modulate inflammatory responses and facilitate immune evasion in the tumor microenvironment (TME),39,40 while naive B cells have been implicated in promoting cancer cell proliferation and metastatic progression.41 More importantly, SCIN expression was significantly negatively correlated with the expression levels of three key immune checkpoint molecules, suggesting that SCIN upregulation may contribute to the formation of an immunosuppressive TME.42
This study systematically characterized the regulatory landscape and biological functions of SCIN through a comprehensive multi-omics strategy, incorporating differential gene expression analysis, WGCNA, ceRNA network construction, GSEA and GSVA enrichment analyses, and immune profiling. These findings were further corroborated by clinical data and functional experiments, highlighting SCIN’s potential as both a diagnostic/prognostic biomarker for risk stratification in CAG and GC, and as a promising therapeutic target. Additionally, our exploration of SCIN’s involvement in shaping the TME offers novel insights into GC immunotherapy. However, this study has several limitations. First, the current findings are based primarily on retrospective data, and prospective validation in large, well-annotated clinical cohorts is essential. Second, the specific downstream signaling pathways and effector molecules through which SCIN mediates its oncogenic and immunomodulatory effects remain incompletely understood. Potential interactions with key oncogenic pathways, such as STAT3 and PI3K/AKT, warrant further investigation.43,44 Third, while SCIN shows strong tissue-based diagnostic and prognostic potential, its utility as a non-invasive biomarker in serum, plasma, or gastric juice has not yet been explored,45 and the translational roadmap for clinical application remains underdeveloped. To address these gaps, future studies will employ advanced techniques such as ChIP-seq and Co-IP/MS to identify SCIN’s direct transcriptional targets and interacting protein networks in GC cells.46 Parallel efforts will focus on launching multi-center, prospective, large-sample cohort studies to rigorously assess the clinical utility of SCIN (via tissue and liquid biopsy) in predicting CAG malignant transformation, GC prognosis, and guiding individualized treatment strategies.47,48
Conclusion
Through integrative multi-omics bioinformatics analysis and comprehensive experimental validation, this study is the first to systematically demonstrate the pivotal role of SCIN in driving the malignant transformation from CAG to GC. SCIN was found to be significantly and progressively upregulated along the Correa cascade, contributing to tumor progression by remodeling the cytoskeleton and facilitating the formation of an immunosuppressive TME. The expression pattern of SCIN offers a robust molecular indicator for the risk stratification of CAG patients, prognostic assessment in GC, and the identification of candidates for immunotherapy. Moreover, targeting SCIN or its regulatory ceRNA network may represent a promising therapeutic strategy for the prevention and treatment of GC.
Data Sharing Statement
The datasets used and/or analyzed during the current study are available from the corresponding author upon reasonable request.
Ethics Approval and Informed Consent
All methods were performed in accordance with relevant guidelines and regulations (eg, Declaration of Helsinki). Studies involving human participants were reviewed and approved by the Institutional Ethics Committee of the Second Affiliated Hospital of Anhui University of Traditional Chinese Medicine (Ethics No. 2022-zj-37). Patients/participants provided written informed consent to participate in this study.
Consent for Publication
The manuscript was approved by all authors for publication.
Funding
This study was funded by the major natural science project of Anhui Province (2024AH040145); anhui Traditional Chinese Medicine Science and Technology Project (202303A07020003); and Anhui Provincial Health and Health Research Project (AHWJ2023BBa20018) funded.
Disclosure
The authors report no conflicts of interest in this work.
References
1. Bray F, Laversanne M, Sung H, et al. Global cancer statistics 2022: GLOBOCAN estimates of incidence and mortality worldwide for 36 cancers in 185 countries. CA. 2024;74(3):229–263. doi:10.3322/caac.21834
2. Pimentel-Nunes P, Libânio D, Marcos-Pinto R, et al. Management of epithelial precancerous conditions and lesions in the stomach (MAPS II): european Society of Gastrointestinal Endoscopy (ESGE), European Helicobacter and Microbiota Study Group (EHMSG), European Society of Pathology (ESP), and Sociedade Portuguesa de Endoscopia Digestiva (SPED) guideline update 2019. Endoscopy 2019;51(4):365–388. doi:10.1055/a-0859-1883
3. Correa P, Piazuelo MB. The gastric precancerous cascade. J Digest Dis. 2012;13(1):2–9. doi:10.1111/j.1751-2980.2011.00550.x
4. Fann JC, Chiang TH, Yen AM, Lee YC, Wu MS, Chen HH. Personalized risk assessment for dynamic transition of gastric neoplasms. J Biomed Sci. 2018;25(1):84. doi:10.1186/s12929-018-0485-6
5. Yoshimizu S, Yamamoto Y, Horiuchi Y, et al. Diagnostic performance of routine esophagogastroduodenoscopy using magnifying endoscope with narrow-band imaging for gastric cancer. Dig Endosc. 2018;30(1):71–78. doi:10.1111/den.12916
6. Xiang J, Gao L, Jing HY, et al. Construction of CeRNA regulatory network based on WGCNA reveals diagnosis biomarkers for colorectal cancer. BMC Cancer. 2022;22(1):991. doi:10.1186/s12885-022-10054-z
7. Gu Y, Li J, Guo D, et al. Identification of 13 key genes correlated with progression and prognosis in hepatocellular carcinoma by weighted gene co-expression network analysis. Front Genetics. 2020;11:153. doi:10.3389/fgene.2020.00153
8. Luo Y, Liu Z, Hu X. ceRNA network and WGCNA analyses of differentially expressed genes in cervical cancer tissues for association with survival of patients. Reprod Sci. 2024;31(8):2523–2533. doi:10.1007/s43032-024-01477-z
9. Zhao S, Sun H, Jiang W, et al. miR−4775 promotes colorectal cancer invasion and metastasis via the Smad7/TGFβ-mediated epithelial to mesenchymal transition. Mol Cancer. 2017;16(1):12. doi:10.1186/s12943-017-0585-z
10. Yuan Q, Han J, Cong W, et al. Docetaxel-loaded solid lipid nanoparticles suppress breast cancer cells growth with reduced myelosuppression toxicity. Int J Nanomed. 2014;9:4829–4846. doi:10.2147/ijn.S70919
11. Thrift AP, El-Serag HB. Burden of Gastric Cancer. Clin Gastroenterol Hepatol. 2020;18(3):534–542. doi:10.1016/j.cgh.2019.07.045
12. Banks M, Graham D, Jansen M, et al. British society of gastroenterology guidelines on the diagnosis and management of patients at risk of gastric adenocarcinoma. Gut. 2019;68(9):1545–1575. doi:10.1136/gutjnl-2018-318126
13. Vannella L, Lahner E, Annibale B. Risk for gastric neoplasias in patients with chronic atrophic gastritis: a critical reappraisal. World J Gastroenterol. 2012;18(12):1279–1285. doi:10.3748/wjg.v18.i12.1279
14. Mülder DT, Hahn AI, Huang RJ, et al. Prevalence of gastric precursor lesions in countries with differential gastric cancer burden: a systematic review and meta-analysis. Clin Gastroenterol Hepatol. 2024;22(8):1605–1617.e1646. doi:10.1016/j.cgh.2024.02.023
15. Sipponen P, Maaroos HI. Chronic gastritis. Scand J Gastroenterol. 2015;50(6):657–667. doi:10.3109/00365521.2015.1019918
16. Goldenring JR, Mills JC. Cellular plasticity, reprogramming, and regeneration: metaplasia in the stomach and beyond. Gastroenterology. 2022;162(2):415–430. doi:10.1053/j.gastro.2021.10.036
17. Yao K, Uedo N, Kamada T, et al. Guidelines for endoscopic diagnosis of early gastric cancer. Dig Endosc. 2020;32(5):663–698. doi:10.1111/den.13684
18. Hamashima C. Forthcoming step in gastric cancer prevention: how can risk stratification be combined with endoscopic screening for gastric cancer? Gut Liver. 2022;16(6):811–824. doi:10.5009/gnl210313
19. Trifaró JM, Rosé SD, Marcu MG. Scinderin, a Ca2+-dependent actin filament severing protein that controls cortical actin network dynamics during secretion. Neurochem Res. 2000;25(1):133–144. doi:10.1023/a:1007503919265
20. Liu JJ, Liu JY, Chen J, et al. Scinderin promotes the invasion and metastasis of gastric cancer cells and predicts the outcome of patients. Cancer Lett. 2016;376(1):110–117. doi:10.1016/j.canlet.2016.03.035
21. Wang D, Sun SQ, Yu YH, Wu WZ, Yang SL, Tan JM. Suppression of SCIN inhibits human prostate cancer cell proliferation and induces G0/G1 phase arrest. Int J Oncol. 2014;44(1):161–166. doi:10.3892/ijo.2013.2170
22. Liu H, Shi D, Liu T, Yu Z, Zhou C. Lentivirus-mediated silencing of SCIN inhibits proliferation of human lung carcinoma cells. Gene. 2015;554(1):32–39. doi:10.1016/j.gene.2014.10.013
23. Wang X, Luo LX. New targets for cancer promotion and therapy in gliomas: scinderin. World J Clin Oncol. 2024;15(6):687–690. doi:10.5306/wjco.v15.i6.687
24. Zhai S, Li Y, Yang Y, et al. Scinderin is a potential prognostic biomarker and correlated with immunological regulation: from pan-cancer analysis to liver hepatocellular carcinoma. Front Immunol. 2024;15:1361657. doi:10.3389/fimmu.2024.1361657
25. Zhao N, Ni C, Fan S, et al. RSRC2 expression inhibits malignant progression of triple-negative breast cancer by transcriptionally regulating SCIN expression. Cancer. 2023;16(1):15. doi:10.3390/cancers16010015
26. Li J, Meng H, Bai Y, Wang K. Regulation of lncRNA and its role in cancer metastasis. Oncol Res. 2016;23(5):205–217. doi:10.3727/096504016x14549667334007
27. Ahram M, Abu Alragheb B, Abushukair H, Bawadi R, Al-Hussaini M. MicroRNAs associated with androgen receptor and metastasis in triple-negative breast cancer. Cancers. 2024;16(3):665. doi:10.3390/cancers16030665
28. Xu M, Chen X, Lin K, et al. The long noncoding RNA SNHG1 regulates colorectal cancer cell growth through interactions with EZH2 and miR−154−5p. Mol Cancer. 2018;17(1):141. doi:10.1186/s12943-018-0894-x
29. Chang WC, Huang SF, Lee YM, et al. Cholesterol import and steroidogenesis are biosignatures for gastric cancer patient survival. Oncotarget. 2017;8(1):692–704. doi:10.18632/oncotarget.13524
30. Cruz ALS, Barreto EA, Fazolini NPB, Viola JPB, Bozza PT. Lipid droplets: platforms with multiple functions in cancer hallmarks. Cell Death Dis. 2020;11(2):105. doi:10.1038/s41419-020-2297-3
31. Yu W, Chen G, Yan J, Wang X, Zhu Y, Zhu L. Single-cell sequencing analysis reveals gastric cancer microenvironment cells respond vastly different to oxidative stress. J Transl Med. 2022;20(1):250. doi:10.1186/s12967-022-03411-w
32. Hardbower DM, de Sablet T, Chaturvedi R, Wilson KT. Chronic inflammation and oxidative stress: the smoking gun for helicobacter pylori-induced gastric cancer? Gut Microbes. 2013;4(6):475–481. doi:10.4161/gmic.25583
33. Kim YJ, Kim EH, Hahm KB. Oxidative stress in inflammation-based gastrointestinal tract diseases: challenges and opportunities. J Gastroenterol Hepatol. 2012;27(6):1004–1010. doi:10.1111/j.1440-1746.2012.07108.x
34. Duan X, Lian H, Li J, et al. Expression of GCRG213p, LINE−1 endonuclease variant, significantly different in gastric complete and incomplete intestinal metaplasia. Diagn. Pathol. 2019;14(1):61. doi:10.1186/s13000-019-0838-9
35. Hanley JA, McNeil BJ. The meaning and use of the area under a receiver operating characteristic (ROC) curve. Radiology. 1982;143(1):29–36. doi:10.1148/radiology.143.1.7063747
36. Rugge M, Genta RM, Di Mario F, et al. Gastric cancer as preventable disease. Clin Gastroenterol Hepatol. 2017;15(12):1833–1843. doi:10.1016/j.cgh.2017.05.023
37. Prentice RL, Zhao S. Regression models and multivariate life tables. J Am Stat Assoc. 2021;116(535):1330–1345. doi:10.1080/01621459.2020.1713792
38. Khurana S, George SP. Regulation of cell structure and function by actin-binding proteins: villin’s perspective. FEBS Lett. 2008;582(14):2128–2139. doi:10.1016/j.febslet.2008.02.040
39. Zhao S, Mi Y, Guan B, et al. Tumor-derived exosomal miR−934 induces macrophage M2 polarization to promote liver metastasis of colorectal cancer. J hematol oncol. 2020;13(1):156. doi:10.1186/s13045-020-00991-2
40. Yao M, Mao X, Zhang Z, et al. Tumor-derived CircRNA_102191 promotes gastric cancer and facilitates M2 macrophage polarization. Cell Cycle. 2023;22(18):2003–2017. doi:10.1080/15384101.2023.2271341
41. Iqbal J, Shen Y, Huang X, et al. Global microRNA expression profiling uncovers molecular markers for classification and prognosis in aggressive B-cell lymphoma. Blood. 2015;125(7):1137–1145. doi:10.1182/blood-2014-04-566778
42. Topalian SL, Drake CG, Pardoll DM. Immune checkpoint blockade: a common denominator approach to cancer therapy. Cancer Cell. 2015;27(4):450–461. doi:10.1016/j.ccell.2015.03.001
43. Yu H, Pardoll D, Jove R. STATs in cancer inflammation and immunity: a leading role for STAT3. Nat Rev Cancer. 2009;9(11):798–809. doi:10.1038/nrc2734
44. Liu R, Chen Y, Liu G, et al. PI3K/AKT pathway as a key link modulates the multidrug resistance of cancers. Cell Death Dis. 2020;11(9):797. doi:10.1038/s41419-020-02998-6
45. Heitzer E, Haque IS, Roberts CES, Speicher MR. Current and future perspectives of liquid biopsies in genomics-driven oncology. Nat Rev Genet. 2019;20(2):71–88. doi:10.1038/s41576-018-0071-5
46. Park PJ. ChIP-seq: advantages and challenges of a maturing technology. Nat Rev Genet. 2009;10(10):669–680. doi:10.1038/nrg2641
47. Sauerbrei W, Taube SE, McShane LM, Cavenagh MM, Altman DG. Reporting Recommendations for Tumor Marker Prognostic Studies (REMARK): an abridged explanation and elaboration. J National Cancer Inst. 2018;110(8):803–811. doi:10.1093/jnci/djy088
48. Janes H, Pepe MS, Bossuyt PM, Barlow WE. Measuring the performance of markers for guiding treatment decisions. Ann Internal Med. 2011;154(4):253–259. doi:10.7326/0003-4819-154-4-201102150-00006
 © 2025 The Author(s). This work is published and licensed by Dove Medical Press Limited. The
full terms of this license are available at https://www.dovepress.com/terms
and incorporate the Creative Commons Attribution
- Non Commercial (unported, 4.0) License.
By accessing the work you hereby accept the Terms. Non-commercial uses of the work are permitted
without any further permission from Dove Medical Press Limited, provided the work is properly
attributed. For permission for commercial use of this work, please see paragraphs 4.2 and 5 of our Terms.
© 2025 The Author(s). This work is published and licensed by Dove Medical Press Limited. The
full terms of this license are available at https://www.dovepress.com/terms
and incorporate the Creative Commons Attribution
- Non Commercial (unported, 4.0) License.
By accessing the work you hereby accept the Terms. Non-commercial uses of the work are permitted
without any further permission from Dove Medical Press Limited, provided the work is properly
attributed. For permission for commercial use of this work, please see paragraphs 4.2 and 5 of our Terms.