Back to Journals » Pediatric Health, Medicine and Therapeutics » Volume 14
School Feeding and Nutritional Status of Students in Dubti District, Afar, Northeast Ethiopia: Comparative Cross-Sectional Study
Authors Hussein K ![]() , Mekonnen TC
, Mekonnen TC ![]() , Hussien FM, Alene TD
, Hussien FM, Alene TD ![]() , Abebe MS
, Abebe MS ![]()
Received 29 March 2023
Accepted for publication 29 May 2023
Published 1 June 2023 Volume 2023:14 Pages 217—230
DOI https://doi.org/10.2147/PHMT.S412740
Checked for plagiarism Yes
Review by Single anonymous peer review
Peer reviewer comments 2
Editor who approved publication: Professor Roosy Aulakh
Kedir Hussein,1 Tefera Chanie Mekonnen,1 Foziya Mohammed Hussien,1 Tilahun Dessie Alene,2 Melese Shenkut Abebe3
1School of Public Health, College of Medicine and Health Science, Wollo University, Dessie, Ethiopia; 2Department of Pediatrics, School of Medicine, College of Medicine and Health Science, Wollo University, Dessie, Ethiopia; 3Department of Anatomy, School of Medicine, College of Medicine and Health Science, Wollo University, Dessie, Ethiopia
Correspondence: Melese Shenkut Abebe, Department of Anatomy, School of Medicine, College of Medicine and Health Science, Wollo University, Dessie, Ethiopia, Email [email protected]
Background: Providing food to the school children is an important means of compacting malnutrition especially in high food insecure areas. Our study was conducted to evaluate the association between school feeding and nutritional status among students in primary schools of Dubti district in Afar region.
Methods: A comparative cross-sectional study was employed on 936 primary school students from March 15– 31/2021. For data collection, structured questionnaire was administered by the interviewer. Descriptive statistics as well as logistic regression was conducted. WHO Anthro-plus software was used to compute anthropometric data. Adjusted odds ratio with 95% CI was calculated to identify the level of association. Variables with p-value < 0.05 were taken as statistical level of significance.
Results: A total of 936 primary school students, with 100% response rate, were included in the current study. The prevalence of stunting in school fed and non-school fed students was 13.7% 95% CI (11, 17) and 21.6% 95% CI (18, 25), respectively. The prevalence of thinness in school fed and non-school fed students was 4.9% 95% CI (3, 7) and 13.9% 95% CI (11, 17), respectively. Even though no record of overweight and obesity were found in non-school fed students, 5.4% 95% CI (3, 7) among school fed students was overweight/obese. Grade level, diet information source, media source availability, maternal age, the critical time for hand washing, and nutrition education were found to be predictors of malnutrition in both groups of students.
Conclusion: The magnitude of stunting and thinness in school fed students is found to be lower, but overnutrition is higher than non-school fed. Grade level of students and diet selection information were determinants that affected the nutritional status of students. Coordinated education regarding good feeding practice, and personal as well as environmental hygiene should be given to the students and their families.
Keywords: school feeding, nutritional status, students, malnutrition
A Letter to the Editor has been published for this article.
Introduction
School feeding refers to the delivery of food to children in the school.1 The two forms of school feeding programs are as follows: in-school feeding (children are given food in school) and take-home rations (food is given to children’s guardian).1 Providing food to the school children is an important means of compacting malnutrition especially in high food insecure areas. This feeding program enhances learning capacity and educational performance of students.2 Consistent provision of food for school children is reported to enhance nutritional status for those who suffer from nutrient inadequacy. Over all, students participated in school feeding programs have shown improved cognitive function, increased school attendance and enrolment rate, better academic performance, and reduced school dropout rate. For this reason, school feeding program (SFP) has been implemented by many developing countries as a means of preventing nutrient deficiency.3
Malnutrition is a pathological state resulting from comparative or complete scarcity or surplus of any of the vital nutrients.4 The two important anthropometric indices used to delineate malnutrition are stunting, and thinness.5 Chronic malnutrition as seen in reduced linear growth is reported to be related with frequent exposure to adverse economic conditions, inadequate sanitation, insufficient dietary intake and infection.6 In acute malnutrition or thinness, ie, low weight-for-height or reduced body mass index (BMI) for age, it can be due to current illness and/or food starvation.7
In 2018, worldwide, a total of 820 million people are on inadequate food supply; for this Asia, Africa, Latin America as well as Caribbean respectively accounts for 513.9, 256.1 and 42.5 million.2 In southern Asia and Sub-Saharan Africa, at least one out of three children is affected by stunting.8 In Africa, a large number of school children are affected by undernutrition, are stunted, or are on short-term hunger.9 Every day, millions of children around the world go to school on an empty stomach.10 Nearly 8 million childrens died due to malnutrition worldwide.11 In many developing countries including in Sub-Saharan Africa, undernutrition is still a major public health issue needing an urgent solution.11
As reported in the Ethiopian mini demographic health survey (EMDHS) 2019, in under five years children, 37% and 12% are stunted (short for their age or stunted (below −2 standard deviation (SD)) or severely stunted (below −3 SD), respectively.12 The magnitude of stunting increases with age; it is 22% in children age between 6 and 8 months and 44% in children 48–59 months of age. In one study, highest prevalence of stunted children (45%) were 24–35 months of age. Male children were relatively stunted as compared with females (40% versus 33%, respectively).13
Ethiopia is one of the developing countries suffering from child malnutrition. A study conducted in 2015 reported that malnutrition affected 31% of the school children (19.6% stunted, 15.9% underweight and 14.0% wasted).11 Ethiopia is practicing World Food Program (WFP) sponsored school feeding program since 1994. Target areas to initiate SFP are districts with long-term food scarcity, reduced school enrollment, and increased gender disparity. Dubti district of Afar region is one of the food insecure areas and SFP was implemented in 1995 as a pilot project.2 The effectiveness of such school feeding intervention programs should be evaluated. Therefore, our study comparatively evaluated the nutritional status of students in SFP and non-school feeding program (NSFP). The findings of this study could be used as a baseline reference for those who plan to initiate SFP.
Material and Methods
Study Area and Period
This research was done in Dubti district, Afar Region State, northeastern Ethiopia. Based on the 2007 Central Statistics Agency report, the District has a total population of 76,718; from this 39,893 are males. Dubti is recognized as commonly drought-affected and food unsecure districts in the Afar Region. As per Dubti District Education Bureau report, there were 6 full-cycle (grade 1–8) primary schools with 3724 students in the District. From this only 2 schools were included in the SFP.14 The study was conducted from March 15–31/2021.
Study Design and Population
A comparative cross-sectional study was employed in Dubti district primary school students. The source and study population were, respectively, all primary school students in the district and students in the sampled schools during the study period.
Inclusion and Exclusion Criteria
All students being at the sampled schools during data collection period were included in this study. Students with known disease conditions and refusers were excluded.
Sample Size
Sample size of the study was computed using double population proportion formulas using the following considerations: 95% CI, 80% power, 37.6% proportion of thinness among students who did not feed at school, 27.8% proportion of thinness among students who fed at school, 48.3% proportion of stunting among students who did not feed at school, 58.5% proportion of stunting among students who fed at school and 10% non-response rate.15 Based on this assumption, the sample size was 820 then to prevent design effect, it was multiplied by 1.14; 820*1.14=934.8. When divided into four schools, approximated to 234 sample size were distributed in each, then the final sample size (234*4) was determined to be 936.
Sampling Procedures
Participants of this study were selected using a multi-stage sampling method. Considering the list of schools as a population frame, four full-cycle primary schools were selected by stratified sampling method. Each two represents schools included in SFP or NSFP. Next, students in selected schools were incorporated in the study by using simple random sampling (lottery method) from the list of attendance sheets of each grade based on proportional allocation. The total sample size computed was distributed to sampled schools based on considering the proportion to the size of the students from each school. At the end, following the school registration logbook as a sampling frame, participants were selected by a simple random sampling technique.
Data Collection
Data collection was done by using interviewer-administered structured questionnaire. The questionnaire consists of variables significantly associated with malnutrition from similar literature;15 socio-demographic, socioeconomic, water, sanitation and hygiene (WaSH), health as well as nutrition-related information. For data collector and supervisor, our diplomas and 2 BSc nurses were respectively recruited.
Measuring height and weight was done by using a seca 217 stadiometer digital and weighing scale, respectively. While measuring the weight, the weighing scale was checked each day prior to the actual data collection. Weight and height were measured to the closest 0.1 kg and 0.1 cm, respectively. At height measurement, each student erects in anatomical position with no shoes and heels. Posterior of heel, leg, buttock, shoulder, and posterior head touch the stadiometer board. The top of the head touches the headpiece of the stadiometer. For both measurements, the average of two recordings was used for the final analysis. We have used WHO Anthro plus software in order to calculate the z-score values for stunting: height for age Z score (HAZ), and thinness, overweight as well as obesity: BMI for age Z score (BAZ). Computed z-scores of BMI-for-age and height for age were used for the classification of thinness, overweight, obesity and stunting based on WHO reference value.16 To assure the quality of the data, questionnaires were pre-tested and the scales were consistently check for well functionality. In addition, data collection process was seriously supervised and the collected data were check for any errors.
Data Processing and Analysis
Data were entered into Epi Data version 3.1 and analyzed using WHO Anthro-plus (for nutritional indices) and SPSS version 23 software. The nutritional status of school fed and non-school fed students were compared. Variables with a p-value of ≤0.25 in the bi-variable analysis were entered to the multivariable analysis. Adjusted odds ratio with 95% CI were computed to determine the strength of association. P-value <0.05 was considered statistically significant. Using WHO Anthro-plus software: the weight, height, sex, and age (in month) of the students were converted to HAZ and BAZ. The resulting indices were used to estimate proportions of stunting (HAZ < –2 SD), thinness (BAZ < –2 SD), overweight (BAZ > 1 but <2 SD) and obesity (BAZ > 2 SD).17
Results
Socio-demographic Characteristics of the Students and Their Parents
A total of 936 primary school students were participated in the current study. The mean age of the respondents (students) was 10.96 years (SD±2.58) and 10.65 years (SD ±2.30) in schools with SFP and NSFP, respectively. The majority of the respondents were males in both school groups, which were 259 (55.3%) for SFP schools and 282 (60.3%) for NSFP schools. About one-fifth of the students in both categories were in grade one. Above 80% of the students’ parents in both groups were married and living together. Above 90% and above 76% of the students in SFP schools were Muslims and Afar ethnically, while about 82% and 62% of students in the comparative group were in similar categories respectively (Table 1).
 |
Table 1 Socio-Demographic Characteristics of the Respondents |
Socio-economic Characteristics of Respondents
The majority of the student’s mothers cannot read and write with a relatively higher percentage in NSFP 184 (39.3%) than in SFP 156 (33.3%). Regarding student’s father education, those having primary education were higher in NSFP 186 (39.7%) than in SFP 148 (30.6%). In both SFP and NSFP, 380 (81.2%) and 290 (62%) of the students’ mothers were housewives, respectively. The father’s occupations in SFP 175 (37.4%) and NSFP 188 (40.2%) were an agro-pastoral and civil servant, respectively. The majority of students in both programs lack pocket money from their families 374 (79.9%) in SFP and 336 (71.8%) in NSFP (Table 2).
 |
Table 2 Socioeconomic Characteristics and Source of Information of the Respondents |
Health and WaSH Related Characteristics of the Respondents
Among students in NSFP and SFP, 367 (78.4%) and 209 (44.7%) had respectively latrine (sanitized with water and detergents) coverage. According to the expanded program of immunization (EPI) schedule, 397 (84.8%) students in NSFP and 356 (76.1%) in SFP were fully vaccinated. In both groups, diarrheal disease and cold flu were higher in NSFP 206 (44.0%) and 217 (46.4%) than in SFP 171 (36.5%) and 104 (22.2%), respectively. The majority of student’s source of drinking water in both SFP 461 (98.5%) and NSFP 345 (73.7%) is pipe water. In both SFP 427 (91.2%) and NSFP 436 (92.7%) groups, there was a good habit of hand washing before eating. Nearly equal frequency of washing hands after toilet in SFP 365 (78.0%) and NSFP 368 (78.6%), but a little bit of difference in methods they use, NSFP 128 (34.8%) use water with soap to wash their hands is higher than SFP 40 (11.0%) (Table 3).
 |
Table 3 Health-Related Characteristics of the Respondents |
Feeding Practices of Respondents
All students ate food a day prior to data collection at least once in both programs, among the eating frequencies, more than twice covers the greater proportion in both programs SFP 419 (89.5%) and NSFP 463 (98.9%). Only 7.7%, 5.3% and 0.2% of students missed their meals during breakfast, lunch and dinner in the SFP group, while 1.1%, 0.9% and 0.9% of the students missed breakfast, lunch and dinner in the NSFP group, respectively (Table 4).
 |
Table 4 Nutrition-Related Characteristics of the Respondents |
In NSFP bread with milk, bread with Shirowot (locally prepared from a powder of bean, pepper, and onion) and Tef Injera (local thin bread made from Eragrostis tef) with Shirowot are commonly eaten during breakfast, lunch and dinner. Regarding meals, in the SFP they ate porridge, prepared from 120 mg corn soya bean + 8g oil + 3g iodized salt, at 10:00 AM during break time (Table 4).
Prevalence of Malnutrition
The prevalence of stunting in SFP students was 13.7%, while 21.6% in NSFP students. The prevalence of thinness in SFP students was 4.9%, while 13.9% of students in NSFP were thin. Even though no records of overweight and obesity were found in NSFP students, 4.1% and 1.3% among SFP students were overweight and obese, respectively (Table 5).
 |
Table 5 Prevalence on Malnutrition Among the Respondents |
Determinants of Malnutrition
The variables (age of the student, grade level, ethnicity, household member, hand washing before eating, having diarrhea and cold flu, hand washing after toilet, smoking in the family, khat chewing in the family, nutrition education, diet information source, and diet information source) with a p-value of ≤0.25 in the bi-variable analysis were taken up to the multivariable analysis. For students in SFP, only the grade level of the students and diet information source were found to be significant at p <0.05 (Table 6).
 |
Table 6 Determinants of Stunting Among Students in SFP Schools |
Students in grades 1, 2, and 3 were 25, 24 and 9.7 times more likely to have stunting as compared with students in grade 8 [AOR 25 (3.2–193), AOR 24 (2.7–214) and AOR 9.7 (1.5–61.2), respectively] (Table 6).
Fourteen variables with a p-value of ≤0.25 in the bivariable analysis were taken up into the multivariable analysis for students in NSFP; however, none of them were found to be significant at p <0.05 (Table 7).
 |
Table 7 Determinants of Stunting Among Students in NSFP Schools |
From 12 variables with a p-value of ≤0.25 in the bi-variable analysis and taken up into the multivariable analysis for students in both SFP and NSFP, only the grade level of the students, mothers age, critical time for hand washing and nutrition education were found to be significant at p <0.05 (Table 8). Students in grade 4 were 70% protected from stunting compared to students in grade 1 [AOR 0.3 (0.1–0.6)]. Students in grade 8 were 80% protected from stunting as compared to grade 1 [AOR 0.2 (0.1–0.7)]. Students whose mothers are 35–45 years old were 2 times more likely to have stunting as compared with students whose mothers are >45 years old [AOR 2 (1.1–3.4)]. Students who wash their hands before meals were 45% less likely to have stunting than students who wash their hands after toilet [AOR 0.55 (0.3–0.9)]. Students who are in schools with no nutrition education were 2.6 times more likely to have stunting than their counterparts [AOR 2.6 (1.1–5.5)] (Table 8).
 |
Table 8 Determinants of Stunting in Both SFP and NSFP Students |
In both groups of the students age <=10 were 2 times higher in exposing to thinness as compared to students age >10 but other variables could not associate with thinness as well as being overweight (Table 9).
 |
Table 9 Multinomial Logistic Regression of Factors Associated with Thinness and Overweight/Obesity Among Students from Both Groups |
In SFP students, age (<=10) of the students had significant association with thinness that is 2 times prone to thinness as compared to students aged (>10) (Table 10).
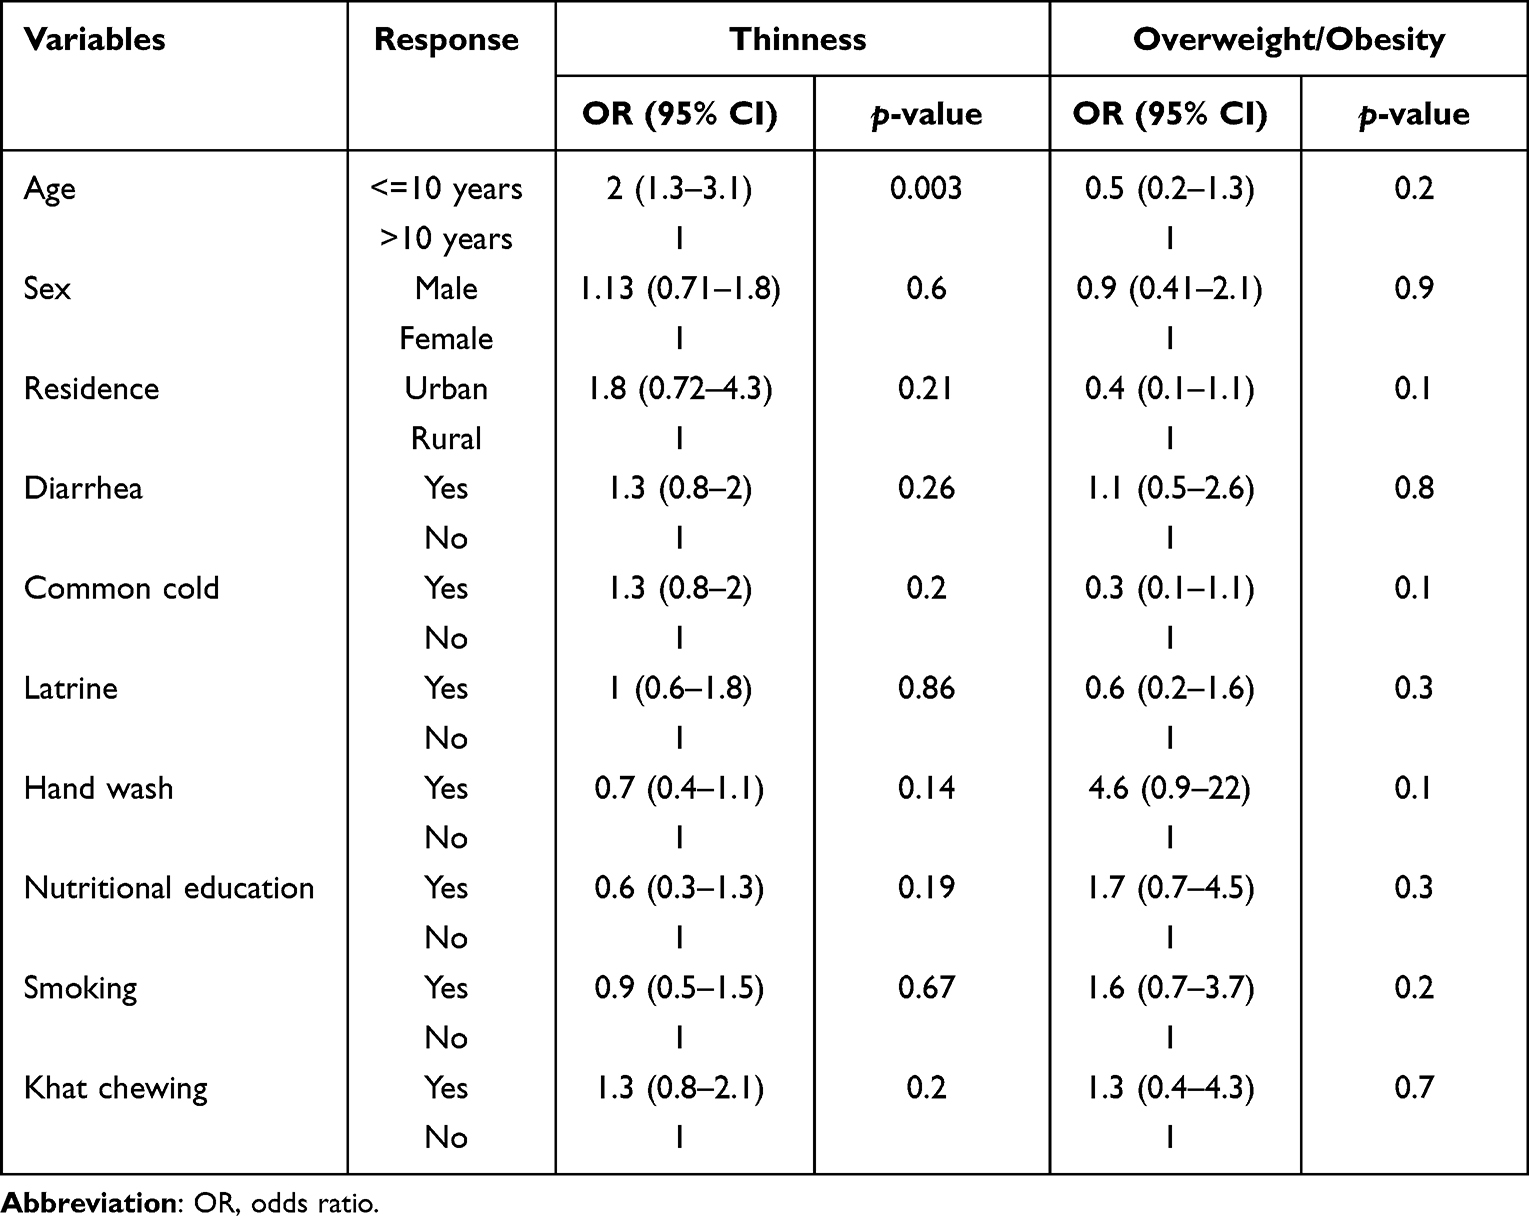 |
Table 10 Multinomial Logistic Regression of Factors Associated with Thinness and Overweight/Obesity from SFP Groups |
Since the third option (overweight/obesity) in NSFP was absent, the variable would remain dichotomous so bi-variable and multi-variable for BAZ with dependent variable re-categorized as thinness and normal remained as an option to perform. Even though four variables were recruited for multivariable regression after 28 variables were checked for bi-variable, none of them had an association.
Discussion
In this study, the magnitude of stunting in SFP students is found to be 13.6%, which is lower than the prevalence reported by studies done in Meket15 and Addis Ababa,18 but similar to the prevalence of stunting in the study conducted in Ghana.19 Simultaneously, the prevalence of stunting in NSFP students of this study was 21.6%, which is similar to studies conducted at Meket3 and Addis Ababa,18 but a little bit higher than the prevalence in Ghanaian students.19 In the present study, the prevalence of stunting is found to be higher in NSFP students than in SFP students. This finding is similar with the study performed in Ghana.19 But studies conducted at Meket15 and Addis Ababa18 reported that the prevalence of stunting in SFP is found to be higher than in NSFP students. The discrepancy between the findings in different studies may arise from the discrepancies in the quality and quantity of school meals and may also be due to the difference in food composition, the amount of feeding given, and the frequency of food eaten at schools.
The overall prevalence of stunting in primary school students in the current study was found to be 18%, which is lower than studies done in Afar,20 Dangila,3 Gondar,21 Addis Ababa,18 and Ghana.22 But the finding is similar to the study conducted at Addis Ababa23 and higher than the study done at Mieso, Somali.24
In this study, the magnitude of thinness in SFP students was 4.9% which is lower than the prevalence of thinness in Meket students15 and similar to the prevalence of studies conducted in Addis Ababa23 and Ghana.19 Regarding NSFP students, prevalence of thinness was 13.9%. This prevalence is lower than the study done in Meket15 and higher than studies conducted at Addis Ababa24 and Ghana.19 Overall, the current study reported that the prevalence of thinness is found to be higher in NSFP students than in SFP students. This finding is inline with studies conducted in Meket15 and Addis Ababa,23 but the study conducted in Ghana showed that the prevalence of thinness in SFP is found to be higher than in NSFP students. The discrepancy between the findings in different studies may arise from the difference in the nature of school meals. In addition, this might be due to the difference in socioeconomic status and nutrition knowledge between Ethiopian and Ghanaian parents.
The overall thinness prevalence of this study was 9.4%, which is consistent with studies conducted at Afar20 and Gondar.21 But it is lower than that of Addis Ababa18 and higher than that of the Dangila3 and Egypt.25
Even though there were no records of obesity and overweight in NSFP students in this study, 5.4% of students in SFP schools were overweight and obese. This level was higher than studies of Addis Ababa23 and Ghana.19 The study done in Addis Ababa indicated a 2.9% prevalence of overweight and obesity in NSFP students.23 The overall prevalence of overweight and obesity (which was 2.7% in this study) was found to be consistent with the study of school meal adequacy in Addis Ababa23 and lower than the Egypt.25
In this study, the grade level of the students and diet information source were significant determinants of stunting in SFP students. But none of them could associate with stunting in NSFP students. Grade level of students persists to be significant factor associated with stunting in SFP students, NSFP students, and the overall stunting status. Students in grades 1, 2 and 3 of SFP schools were more likely to have stunting than students in higher grades. This may be due to as age and grade level increases knowledge of the student’s increases, which in turn the stunting rate become decreased.
The source of diet information was another predictor of stunting in this study. Students who got diet information from school mini-media were more likely to have stunting when compared with students who got diet information from television. This may be due to children focus more on television than listening to school mini-media messages and television messages may be more attractive for children. Media source for nutritional information was significantly associated with stunting in another study done in Awash, Afar. For those families listening to radio, it could be a source of knowledge related to nutrition and child care.26
Strength and Limitation of the Study
Although the study elucidates important findings related to school feeding and nutritional status, it is not out of limitations. The following are some of the limitations; the contents of the meal given at school were not measured, there may be residual confounders from unincluded variables, and the effect of the feeding program on school attendance was not evaluated.
Conclusion and Recommendations
The prevalence of stunting and thinness in SFP students is found to be lower than the prevalence in NSFP. And overnutrition is higher in SFP. Student’s age, grade level of students, diet selection information, and nutrition education are the determinants that affected the nutritional status of primary school students. Coordinated education regarding good feeding practices, and personal as well as environmental hygiene should be given to the students and their families using school mini-media and local television. The school administrator should communicate with the family of malnourished students. The government and stakeholders in Dubti district should support students in need of daily feeding.
Abbreviations
BMI, Body mass index; HAZ, Height for age Z score; NSFP, Non-school feeding program; SFP, School feeding program; WAZ, Weight for age Z score.
Data Sharing Statement
All data are included in the manuscript.
Ethics Approval and Consent to Participate
The study was approved by the Ethical Review Committee of Wollo University. All the methods were conducted in accordance with Declaration of Helsinki. Privacy and confidentiality were maintained throughout the study period by excluding personal identifiers from the data collection tools. A letter of permission was taken from regional and district education bureaus as well as the school administrators. Informed verbal consent was taken from children’s parents/legal guardians. Similarly, the informed verbal consent for participation was approved by the Ethical Review Committee of Wollo University.
Acknowledgments
Wollo University and Dubti District Education Office are duly acknowledged for their support during the entire work.
Disclosure
The authors report no conflicts of interest in this work.
References
1. Yohannes A. The Effect of School Feeding Program on the School Performance of Primary Public School Children in Arada Sub City, Addis Ababa. Addis Ababa University; 2017.
2. Ministry of Education. The Federal Democratic Republic of Ethiopia National School Health and Nutrition Strategy. Ministry of Education; 2012.
3. Demilew YM, Emiru AA. Under nutrition and associated factors among school adolescents in Dangila Town, Northwest Ethiopia: a cross sectional study. Afr Health Sci. 2018;18(3):756–766. doi:10.4314/ahs.v18i3.34
4. Mengistu K, Alemu K, Destaw B. Prevalence of malnutrition and associated factors among children aged 6–59 months at Hidabu Abote District, North Shewa, Oromia Regional State. J Nutr Disorders Ther. 2013;1(1):2161–2509. doi:10.4172/2161-0509-3-T1-001
5. Herrador Z, Sordo L, Gadisa E, et al. Cross-sectional study of malnutrition and associated factors among school aged children in rural and urban settings of Fogera and Libo Kemkem districts, Ethiopia. PLoS One. 2014;9(9):e105880. doi:10.1371/journal.pone.0105880
6. Mohammed SH, Habtewold TD, Tegegne BS, et al. Dietary and non-dietary determinants of linear growth status of infants and young children in Ethiopia: hierarchical regression analysis. PLoS One. 2019;14(1):e0209220. doi:10.1371/journal.pone.0209220
7. JMt HJ, Mitra AK, Hasmiza H, Pim C, LOr N, Wm’wm PI. Effect of gender and nutritional status on academic achievement and cognitive function among primary school children in a rural district in Malaysia. Malays J Nutr. 2011;17(2):189–200.
8. World Health Organization. World Hunger is Still Not Going Down After Three Years and Obesity is Still Growing–UN Report. World Health Organization; 2019.
9. Partida S, Marshall A, Henry R, Townsend J, Toy A. Attitudes toward nutrition and dietary habits and effectiveness of nutrition education in active adolescents in a private school setting: a pilot study. Nutrients. 2018;10(9):1260. doi:10.3390/nu10091260
10. Watkins K. The State of the World’s Children 2016: A Fair Chance for Every Child. ERIC; 2016.
11. Wairimu MJ. Feeding Practices and Nutrition Status Among Children Aged 6–23 Months Following Discharge from Supplementary Feeding Program in Isiolo County, Kenya. Kenyatta University; 2018.
12. Central Statistical Agency. Ethiopia Mini Demographic and Health Survey. Central Statistical Agency; 2014.
13. Zenebe M, Gebremedhin S, Henry CJ, Regassa N. School feeding program has resulted in improved dietary diversity, nutritional status and class attendance of school children. Ital J Pediatr. 2018;44(1):1–7. doi:10.1186/s13052-018-0449-1
14. Central Statistical Agency. 2007 Population and Housing Census of Ethiopia. Addis Ababa, Ethiopia: Central Statistical Agency; 2007.
15. Demilew YM, Nigussie AA. The relationship between school meals with thinness and stunting among primary school students, in Meket Wereda, Ethiopia: comparing schools with feeding and non-feeding program. BMC Nutr. 2020;6(1):1–10. doi:10.1186/s40795-020-00358-3
16. World Health Organization. WHO Child Growth Standards: Length/Height-for-Age, Weight-for-Age, Weight-for-Length, Weight-for-Height and Body Mass Index-for-Age: Methods and Development. World Health Organization; 2006.
17. Agbozo F, Atitto P, Jahn A, Abubakari A. Nutrient composition and dietary diversity of on-site lunch meals, and anthropometry of beneficiary children in private and public primary schools in Ghana. Nutr Health. 2018;24(4):241–249. doi:10.1177/0260106018793048
18. Beyene L. Magnitude and associated factors of under nutrition among orphans residing in selected orphanages in Addis Ababa, Ethiopia; 2019.
19. Kwabla MP, Gyan C, Zotor F. Nutritional status of in-school children and its associated factors in Denkyembour District, eastern region, Ghana: comparing schools with feeding and non-school feeding policies. Nutr J. 2018;17(1):1–8. doi:10.1186/s12937-018-0321-6
20. Kahssay M, Mohamed L, Gebre A. Nutritional status of school going adolescent girls in Awash Town, Afar Region, Ethiopia. J Environ Public Health. 2020;2020:1–9. doi:10.1155/2020/7367139
21. Getaneh Z, Melku M, Geta M, Melak T, Hunegnaw MT. Prevalence and determinants of stunting and wasting among public primary school children in Gondar town, northwest, Ethiopia. BMC Pediatr. 2019;19(1):1–11. doi:10.1186/s12887-019-1572-x
22. Bigson K, Essuman EK, Lotse CW. Food hygiene practices at the Ghana school feeding programme in wa and cape coast cities. J Environ Public Health. 2020;2020:1–7. doi:10.1155/2020/9083716
23. Assefa A, Zewdu A, Urga K. Nutritional status of school children in Addis Ababa who are and are not involved in a school feeding program. Ethiopian J Public Health Nutr. 2020;3(1):1–24.
24. Abdulkadir AA, Tefera BL, Habtemu JH. Nutritional status and associated factors among primary school adolescents of pastoral and agro-pastoral communities, Mieso Woreda, Somali Region, Ethiopia: a comparative cross-sectional study. J Public Health Epidemiol. 2016;8(11):297–310.
25. Abdelaziz SB, Youssef MRL, Sedrak AS, Labib JR. Nutritional status and dietary habits of school children in Beni-Suef Governorate, Egypt. Food Nutr Sci. 2015;6(1):54. doi:10.4236/fns.2015.61007
26. Gebre A, Reddy PS, Mulugeta A, Sedik Y, Kahssay M. Prevalence of malnutrition and associated factors among under-five children in pastoral communities of Afar Regional State, Northeast Ethiopia: a community-based cross-sectional study. J Nutr Metab. 2019;2019:1–13. doi:10.1155/2019/9187609
 © 2023 The Author(s). This work is published and licensed by Dove Medical Press Limited. The
full terms of this license are available at https://www.dovepress.com/terms
and incorporate the Creative Commons Attribution
- Non Commercial (unported, 3.0) License.
By accessing the work you hereby accept the Terms. Non-commercial uses of the work are permitted
without any further permission from Dove Medical Press Limited, provided the work is properly
attributed. For permission for commercial use of this work, please see paragraphs 4.2 and 5 of our Terms.
© 2023 The Author(s). This work is published and licensed by Dove Medical Press Limited. The
full terms of this license are available at https://www.dovepress.com/terms
and incorporate the Creative Commons Attribution
- Non Commercial (unported, 3.0) License.
By accessing the work you hereby accept the Terms. Non-commercial uses of the work are permitted
without any further permission from Dove Medical Press Limited, provided the work is properly
attributed. For permission for commercial use of this work, please see paragraphs 4.2 and 5 of our Terms.
Recommended articles
Assessing Health-Related Quality of Life in Patients Receiving Home Enteral Nutrition with a Disease-Specific Tool (NutriQoL®): A Prospective Observational Study in Spain
Irles-Rocamora JA, Virgili Casas MN, Álvarez-Hernández J, Jiménez Licera E, Zarco Rodríguez FP, García Raimundo EM, Creus Costas G, Lizán L, Blanco Naveira M, Layola Brías M
Patient Preference and Adherence 2025, 19:3861-3872
Published Date: 3 December 2025