Back to Journals » Diabetes, Metabolic Syndrome and Obesity » Volume 13
Sarcopenia Coexisting with High Adiposity Exacerbates Insulin Resistance and Dyslipidemia in Saudi Adult Men
Authors Habib SS, Alkahtani S ![]() , Alhussain M
, Alhussain M ![]() , Aljuhani O
, Aljuhani O ![]()
Received 28 April 2020
Accepted for publication 25 July 2020
Published 25 August 2020 Volume 2020:13 Pages 3089—3097
DOI https://doi.org/10.2147/DMSO.S260382
Checked for plagiarism Yes
Review by Single anonymous peer review
Peer reviewer comments 3
Editor who approved publication: Prof. Dr. Antonio Brunetti
Syed Shahid Habib,1 Shaea Alkahtani,2 Maha Alhussain,3 Osama Aljuhani4
1Department of Physiology, College of Medicine, King Saud University, Riyadh, Saudi Arabia; 2Department of Exercise Physiology, College of Sport Sciences and Physical Activity, King Saud University, Riyadh, Saudi Arabia; 3Department of Nutrition and Food Sciences, College of Agricultural and Food Sciences, King Saud University, Riyadh, Saudi Arabia; 4Department of Physical Education, College of Sport Sciences and Physical Activity, King Saud University, Riyadh, Saudi Arabia
Correspondence: Syed Shahid Habib
Department of Physiology, College of Medicine, King Saud University, PO Box 2925, King Saud University Medical City, Riyadh 11461, Kingdom of Saudi Arabia
Tel +966 1-4671616
Fax +966 1-4672567
Email [email protected]
Objective: The associations between sarcopenia, adiposity indices and metabolic dysregulation still remain controversial. We aimed to assess and compare insulin resistance and metabolic profile in sarcopenic and non-sarcopenic obese Saudi adult men.
Methods: This cross sectional study was conducted at the College of Sports Sciences, King Saud University, Riyadh. We recruited 312 Saudi adult male individuals and 288 were finally selected for the study. Body composition analysis and hand grip strength (HGS) were estimated by bioimpedance analysis (BIA) and dynamometer in all subjects, respectively. Fasting blood samples were collected for glucose (FBG), basal insulin (BI) and lipid profile. The subjects were divided into three groups based on the body composition parameters, appendicular lean mass (ALM) and body fat percentage (BF%), into non-obese (NonOb) [Normal ALM+< 25 BF%], obese without sarcopenia (ObNonS) [Normal ALM+> 25 BF%] and obese with sarcopenia (ObS) [Low ALM+> 25 BF%].
Results: Obese subjects had significantly higher BI, HOMA-IR and HOMA-β compared to non-obese. Moreover, comparison between two obese groups revealed that both BI and HOMA-IR levels were higher in ObS subjects compared to ObNonS individuals revealing that sarcopenia exacerbates the insulin resistance profile. There was a significant trend of higher resistance and lower sensitivity from non-obese to obesity with sarcopenia. Total cholesterol (TC) and triglycerides (TG) were significantly higher and high density lipoprotein cholesterol (HDL-C) was significantly lower in sarcopenic obese subjects compared to non-sarcopenic obese individuals. The worsening effects were more significant at cutoff point of 7.46 on insulin indices and lipid profile showing that sarcopenia associated with obesity exacerbates the dyslipidemia.
Conclusion: Our study shows that obesity associated with sarcopenia exhibits significantly greater insulin resistance and dyslipidemia than sarcopenia or obesity per se. Therefore, sarcopenic obesity might be an independent risk factor for metabolic disease progression.
Keywords: obesity, sarcopenia, sarcopenic obesity, HOMA-IR, HOMA-β cholesterol, triglycerides (TG), body fat percentage (BF%), body fat mass (BFM)
Introduction
Metabolic syndrome (MetS) includes abdominal obesity, dyslipidemia, hypertension and elevated glucose leading to a higher cardiovascular risk.1 The key mechanism operating in its progression are Insulin resistance and chronic inflammation.2 Their combined effects lead to all detrimental metabolic effects resulting in increased cardiovascular morbidity and mortality.3,4
Sarcopenia by definition is the gradual decline in physical performance of muscles due to deficiency in muscle mass and strength as the age advances. The International Working Group on Sarcopenia and the Asia Working Group for Sarcopenia (AWGS) and European Working Group on Sarcopenia in Older People (EWGSOP), have recommended both presence of low muscle mass and low muscle function to accurately define sarcopenia, since there are different cut-off points and phenotypes for diagnosing sarcopenia.5–7
Widely employed techniques to estimate sarcopenia include non-imaging (e.g., proforma based questionnaire, physical activity performance, anthropometric scales, bioelectrical impedance analysis, biological biomarkers) and imaging methods (magnetic resonance imaging [MRI], dual X-ray absorptiometry [DXA)] and computed tomography [CT]).8 In an interesting study by Zhang et al it was shown that in non-obese middle-aged and older adults with sarcopenia there was two times higher odds to be suffering from MetS than matched healthy subjects.9
The associations between sarcopenia, adiposity indices and metabolic dysregulation have shown controversial results. We hypothesized that obesity associated with sarcopenia results in worsening of insulin resistance and lipid profiles. Moreover, a recent study in Saudi Arabia showed a worse cardiometabolic profile among sarcopenic young adult Arabs who have MetS compared with their peers who have only one condition of these two disease markers.10 Therefore, we aimed to assess and compare insulin and metabolic profile in sarcopenic and non sarcopenic obesity based on body composition indices in Saudi adult men at different cutoff points of sarcopenia.
Methods
This cross sectional study was conducted at the College of Sports Sciences, King Saud University, Riyadh Saudi Arabia from Feb 2019 to Jan 2020. A total of 312 Saudi adult male subjects were initially recruited for the study. Final selection included 288 drug naive individuals (106 subjects with MS and 182 controls) as per selection criteria. All subjects underwent detailed clinical examination. Subjects with hepatic disease, renal disease, other endocrine diseases, infectious diseases, or receiving any medications, congenital muscular or neurological diseases or history of these disorders in first degree relatives were excluded from the study. Based on literature search for similar studies with a minimum 80% predictive power at 95% confidence interval an appropriate sample size of about 160 subjects was calculated.
Appendicular Lean Mass and Sarcopenia Estimation
We analyzed appendicular lean mass (ALM) and hand grip strength test (HGS). Total and percent lean mass and TLM/ht2 were calculated. ALM is the sum of arm and leg lean mass, and ALM/ht2 was also calculated. Sarcopenia was defined as 2 SD below the average of ALM/ht2 for specific young population, but it was calculated in the present study as 1 SD below the mean of ALM/ht2.11 Dominant HGS was measured using a manual spring dynamometer (Baseline® Smedley Spring Dynamometers, Fabrication enterprises Inc., NY, USA), the handle was adjusted to comfortable hand grip size of the participant, and participants were asked to squeeze the handle with maximal force while standing and the elbow fully extended, with consistent encouragements for all participants, and the best of two measures was recorded in kg. Participants with −1 (ALM/Ht2 8.28) and −2 (ALM/Ht2 7.46) standard deviations below the sex-specific mean for Saudi young adults were considered to have sarcopenia class I and class II, respectively. Based on our previous research two cutoff points of ALM/Ht2 7.46 and 8.28 kg/m2 were grouping into sarcopenic and non sarcopenic obesity.11
The subjects were divided into three groups based on the body composition; Non obese (NonOb) [Normal ALM+<25 BF%], obese without sarcopenia (ObNonS) [Normal ALM+>25 BF%] and obese with sarcopenia (ObS) [Low ALM+>25 BF%].
Metabolic Syndrome Criteria
The National Cholesterol Education Program Adult Treatment Panel III (NCEP-ATP III) criteria were adapted for MetS selections.1 The diagnosis of MetS includes presence of any three of the following abnormalities: 1) high waist circumference ≥ 102 cm (40 inches); 2) high triglycerides (TG) with values >150 mg/dL; 3) low high density lipoprotein cholesterol (HDL-C) < 40 mg/dL; 4) high blood pressure with systolic blood pressure (SBP) >130 mmHg and/or diastolic blood pressure (DBP) >85 mmHg; 5) High fasting blood glucose (FBG) >100 mg/dL.
Body Composition Analysis and Obesity Classification
All body composition analysis were performed using Tanita MC-980MA (Tanita Corporation, Tokyo, Japan) by bioimpedance analysis (BIA). Tanita MC-980MA uses 8-electrode system, in which, current is supplied from the tips of the toes of both feet and the fingertips of both hands, and the voltage is measured on the heel of both feet and the thenar side of both hands. This method allows five different impedance measurements including whole body, right leg, left leg, right arm, and left arm to be made by switching the part of the body in which the current is flowing and the location where the voltage is measured. This system is extremely reliable and offers an important new opportunity of evaluating adiposity and fat free mass (FFM) in research and clinical settings.12 However, it is now well known that BMI is a poor index of adiposity, and that sometimes it may even be a misleading indicator and therefore more accurate measures of obesity such as total and segmental body composition by BIA have gained popularity and are being commonly used in clinical practice for exercise and rehabilitation programs.13 The parameters calculated in body composition analysis were Body Fat percentage (BF%), body fat mass (BFM), FFM, ALM and total body water (TBW).
Blood Assays
Fasting venous blood samples were analyzed for glucose, basal insulin and lipids. FBG and Lipids were determined by colorimetric methods using auto analyzer Dimension® EXL™ with LM Integrated Chemistry System and included total cholesterol (TC), triglycerides (TG) and high density lipoprotein cholesterol (HDL-C). Insulin levels were determined by chemiluminescence immunoassay (CLIA) method using AdVIA Centaur XPT Chemistry Analyzer from Siemens (Siemens Healthcare Diagnostics GmbH, Eschborn, Germany) with immunoreactive insulin kit (Siemens 06602443 Immulite® Insulin Kit). The limit of detection of this assay is 0.5 μIU/mL and the measuring range is from 1.0 to 300 μIU/mL. Insulin resistance and sensitivity indices were calculated using the standard formulas.Islet function was evaluated with the modified homeostasis model assessment known as HOMA2: the updated HOMA model (i.e., the computer model) for β-cell function (HOMA-β), which was calculated using fasting Insulin level (BI) and fasting blood glucose (FBG, mmol/L), and insulin resistance (IR) was evaluated using the modified homeostasis model assessment for insulin resistance (HOMA-IR). The formulas were as follows: HOMA-β = 20 x BI uIU/mL/(FBG - 3.5) and HOMA-IR = fasting Insulin x FBG/22.5 (R) where BI = Basal Insulin uIU/mL and FBG = Fasting blood glucose mmol/l. HOMA % Sensitivity (IS) was calculated as reciprocal of HOMA-IR (1/HOMA-IR). Quantitative Insulin Sensitivity Check Index (QUICKI) was calculated using the formula; QUICKI = 1/[log(BI - FBG)]. The normal HOMA-IR value of healthy human ranges from 1.7–2.0.14,15
Statistical Analysis
Data were analyzed using SPSS software (version 20.0 Chicago, IL, USA). Continuous data were presented as mean ± standard deviation (SD). Categorical data were presented as frequencies and percentages (%). All continuous variables were checked for normality using the Kolmogorov–Smirnov test. Student’s Independent sample t-tests were used to compare two groups for normally distributed data. Mann–Whitney U-tests was used to compare two groups for skewed data. For more than two groups one way ANOVA was used to compare normally distributed data while Kruskal Wali’s test was used to compare skewed data. Additionally Jonckheere-Terpstra test was performed to determine if there are statistically significant differences between different groups on markers of insulin resistance and sensitivity. Stepwise multiple linear regression models were created with HOMA-IR and HOMA-β as dependent variables and age, BMI, lipid profile, body composition indices as independent variables. The best model was selected to determine the independent predictors for HOMA-IR and HOMA-β. Simple Linear regression analysis was performed to see the relationship of adiposity indices with insulin resistance. P<0.05 was used to determine statistical significance.
Results
Table 1 shows the comparison of physical characteristics and metabolic profile between normal and MetS positive subjects. The population studied had a mean age 56.77±9.42 years (range 40–82). BMI, SBP, DBP, BF%, BFM, TG, BI and HOMA-IR were significantly higher in the MetS group compared to controls. While HDL-C, QUICKI, HOMA-βlog and IS significantly lower in MetS group compared to controls (Table 1).
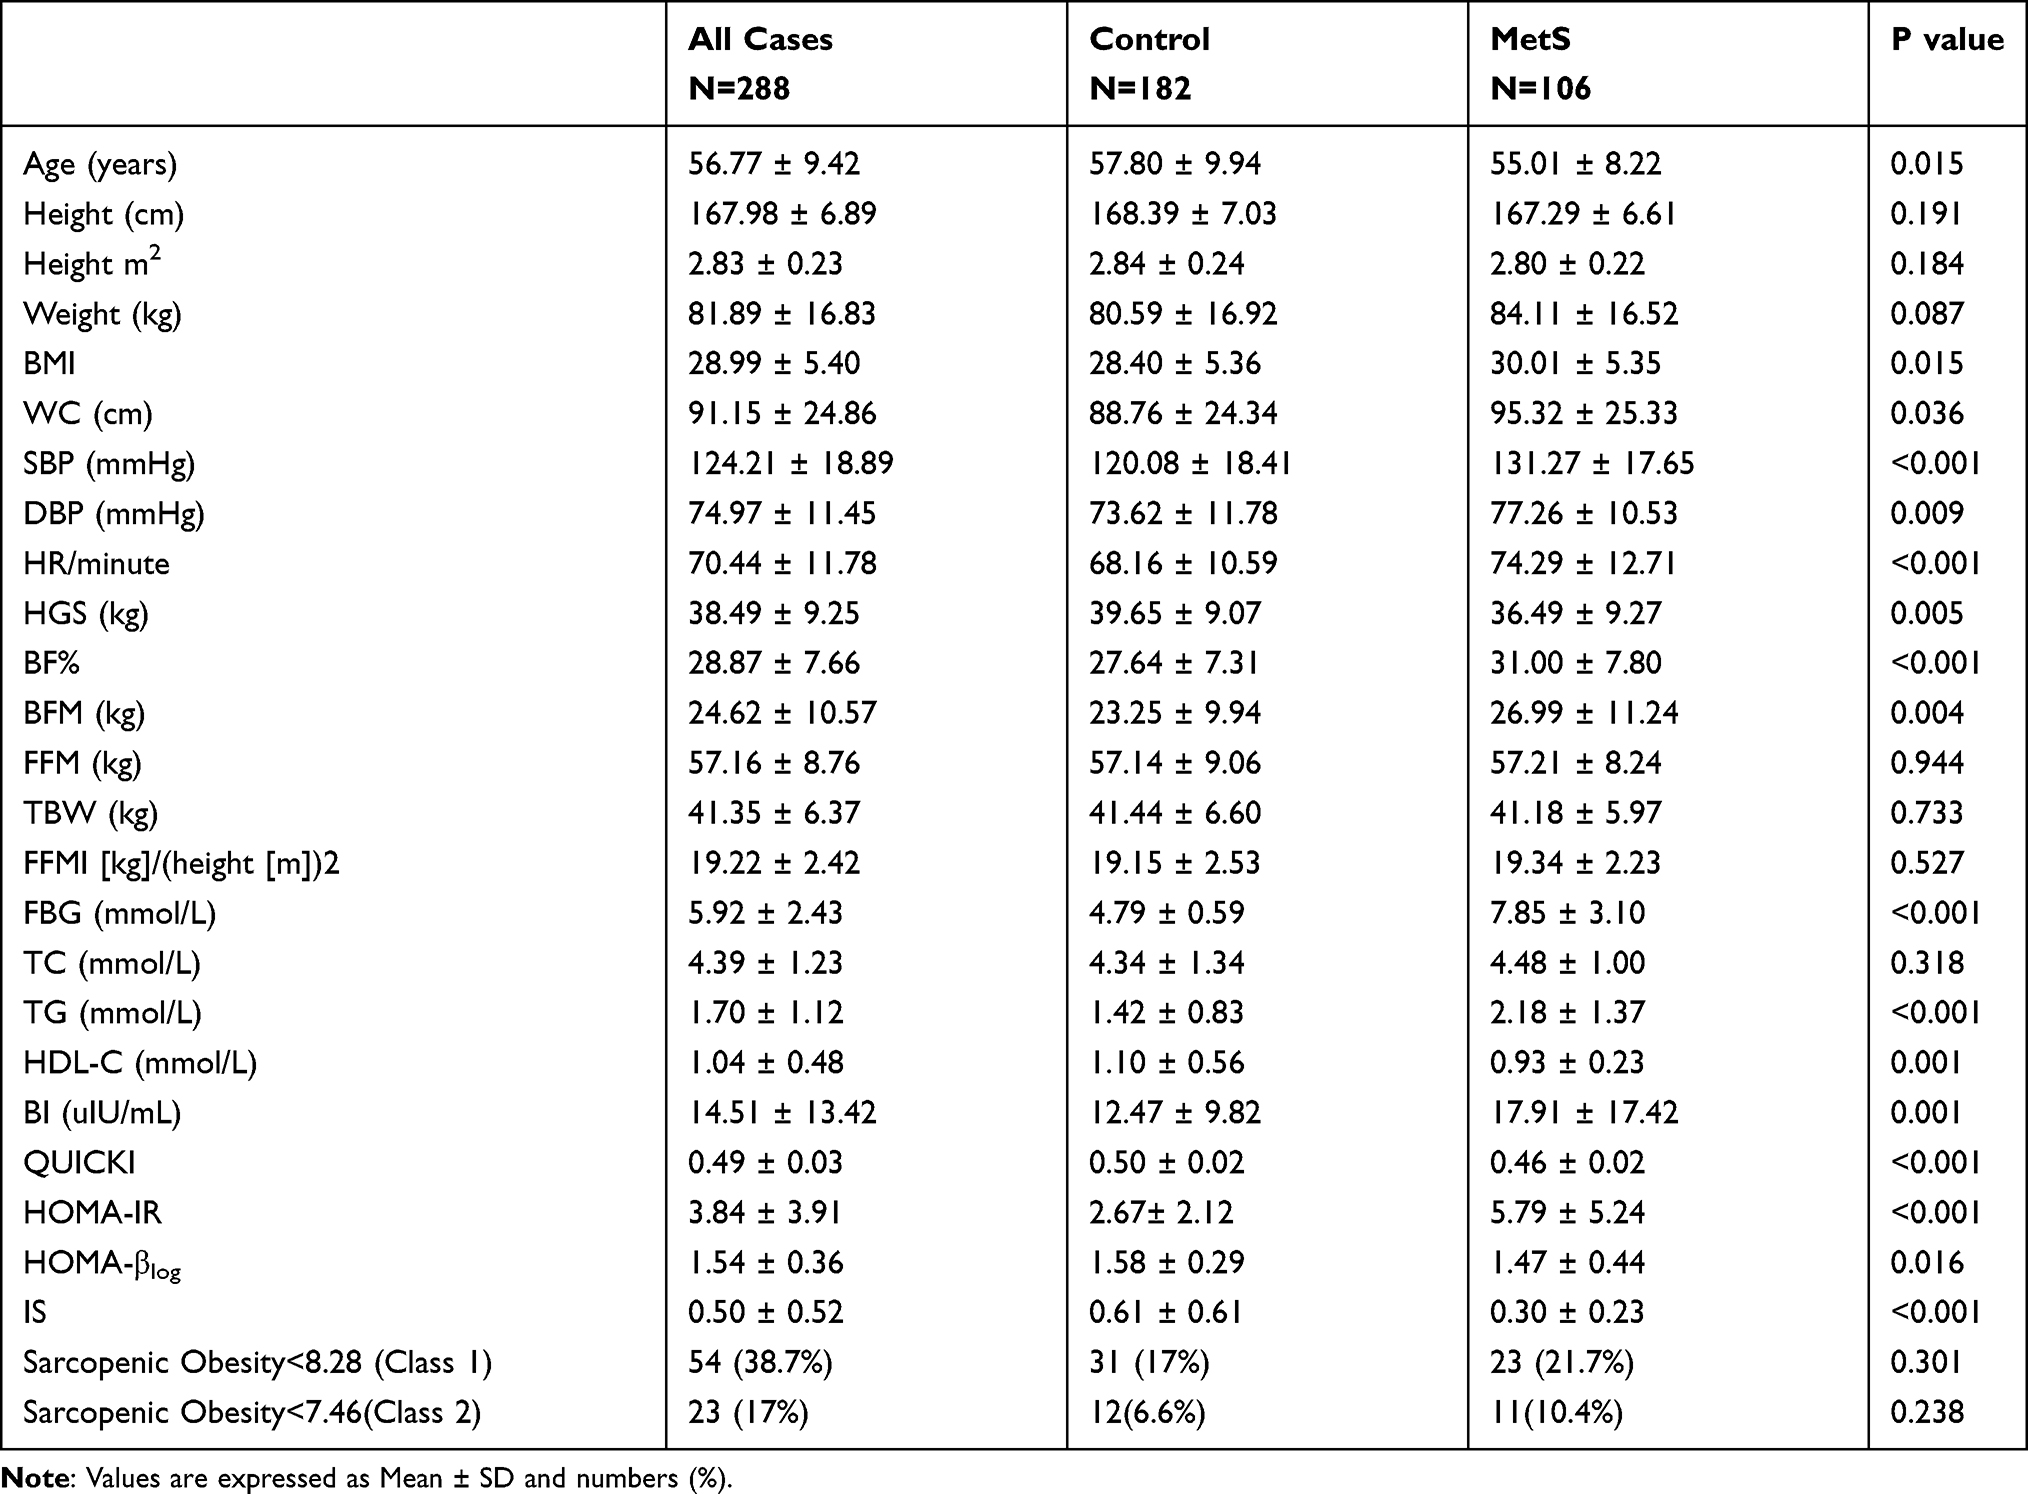 |
Table 1 Comparison of Descriptive Characteristics and Metabolic Profile Between Control and Metabolic Syndrome Individuals |
We compared BI, insulin resistance, insulin sensitivity indices and lipid profile between the three groups which showed significant differences. Tables 2 and 3 express comparison of insulin resistance and sensitivity indices between NonOb, ObNonS and ObS individuals at cut off point 8.28 and 7.46 respectively. Differences for BI, QUICKI, HOMA-IR and HOMA-β were analyzed by Kruskal Wallis Test since these parameters were not following normal distribution. BI and HOMA-IR were significantly higher in obese subjects compared to non obese. Moreover, comparison between two obese groups revealed that BI, HOMA-IR and HOMA-β levels were higher in sarcopenic obese subjects compared to non sarcopenic obese individuals. The effects were more significant at cut off point of 7.46. This show that sarcopenia exacerbates the insulin resistance profile. There was a significant trend of higher resistance and lower sensitivity from NonOb to ObNonS and ObS as shown in Tables 2 and 3. This was further confirmed by Jonckheere-Terpstra test which showed statistically significant differences trend between different groups on markers of insulin resistance and sensitivity. Tables 2 and 3 also express comparison of lipid profile between NonOb to ObNonS and ObS. TC and TG were significantly higher and HDL-C were significantly lower in sarcopenic obese subjects compared to non sarcopenic obese individuals. The effects were more significant at cut off point of 7.46. This show that sarcopenia exacerbates the dyslipidemia. Additionally to confirm the relationship of adiposity indices with insulin resistance we performed linear regression analysis that showed a significant positive correlation between BFM (r=0.302, p<0.001), BFM to lean body mass ratio (r=0.326, p<0.001) and HOMA-IR (Figures 1 and 2). Stepwise multiple linear regression models were created with HOMA-IR and HOMA-β as dependent variables and age, BMI, lipid profile variables, body composition indices as independent variables. Table 4 shows the model results for HOMA-IR as dependent variable. Fat to Lean mass ratio, TG, TC and BF% were independent predictors of HOMA-IR (Adjusted R Square = 25.1%, F Change = 10.8, p=0.001). Table 5 expresses results of stepwise regression models with HOMA-β as dependent variable. The independent predictors were Fat to Lean mass ratio, TG,TC, BF% and HGS (Adjusted R Square = 17.8%, F Change = 3.9, p=0.049).
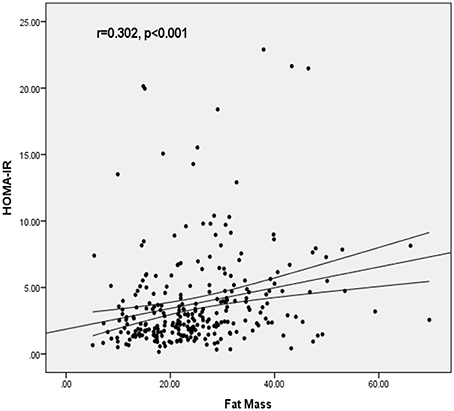 |
Figure 1 Linear regression analysis between fat mass and HOMA-IR in all subjects. |
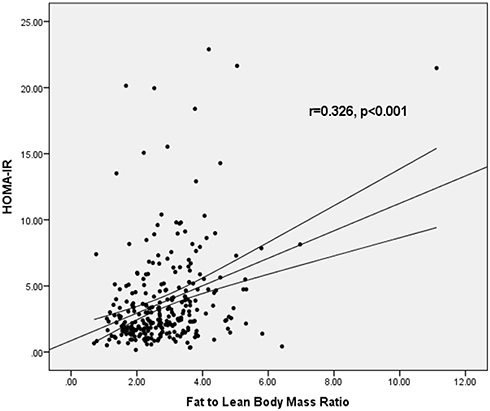 |
Figure 2 Linear regression analysis between fat mass to lean body mass ratio and HOMA-IR in all subjects. |
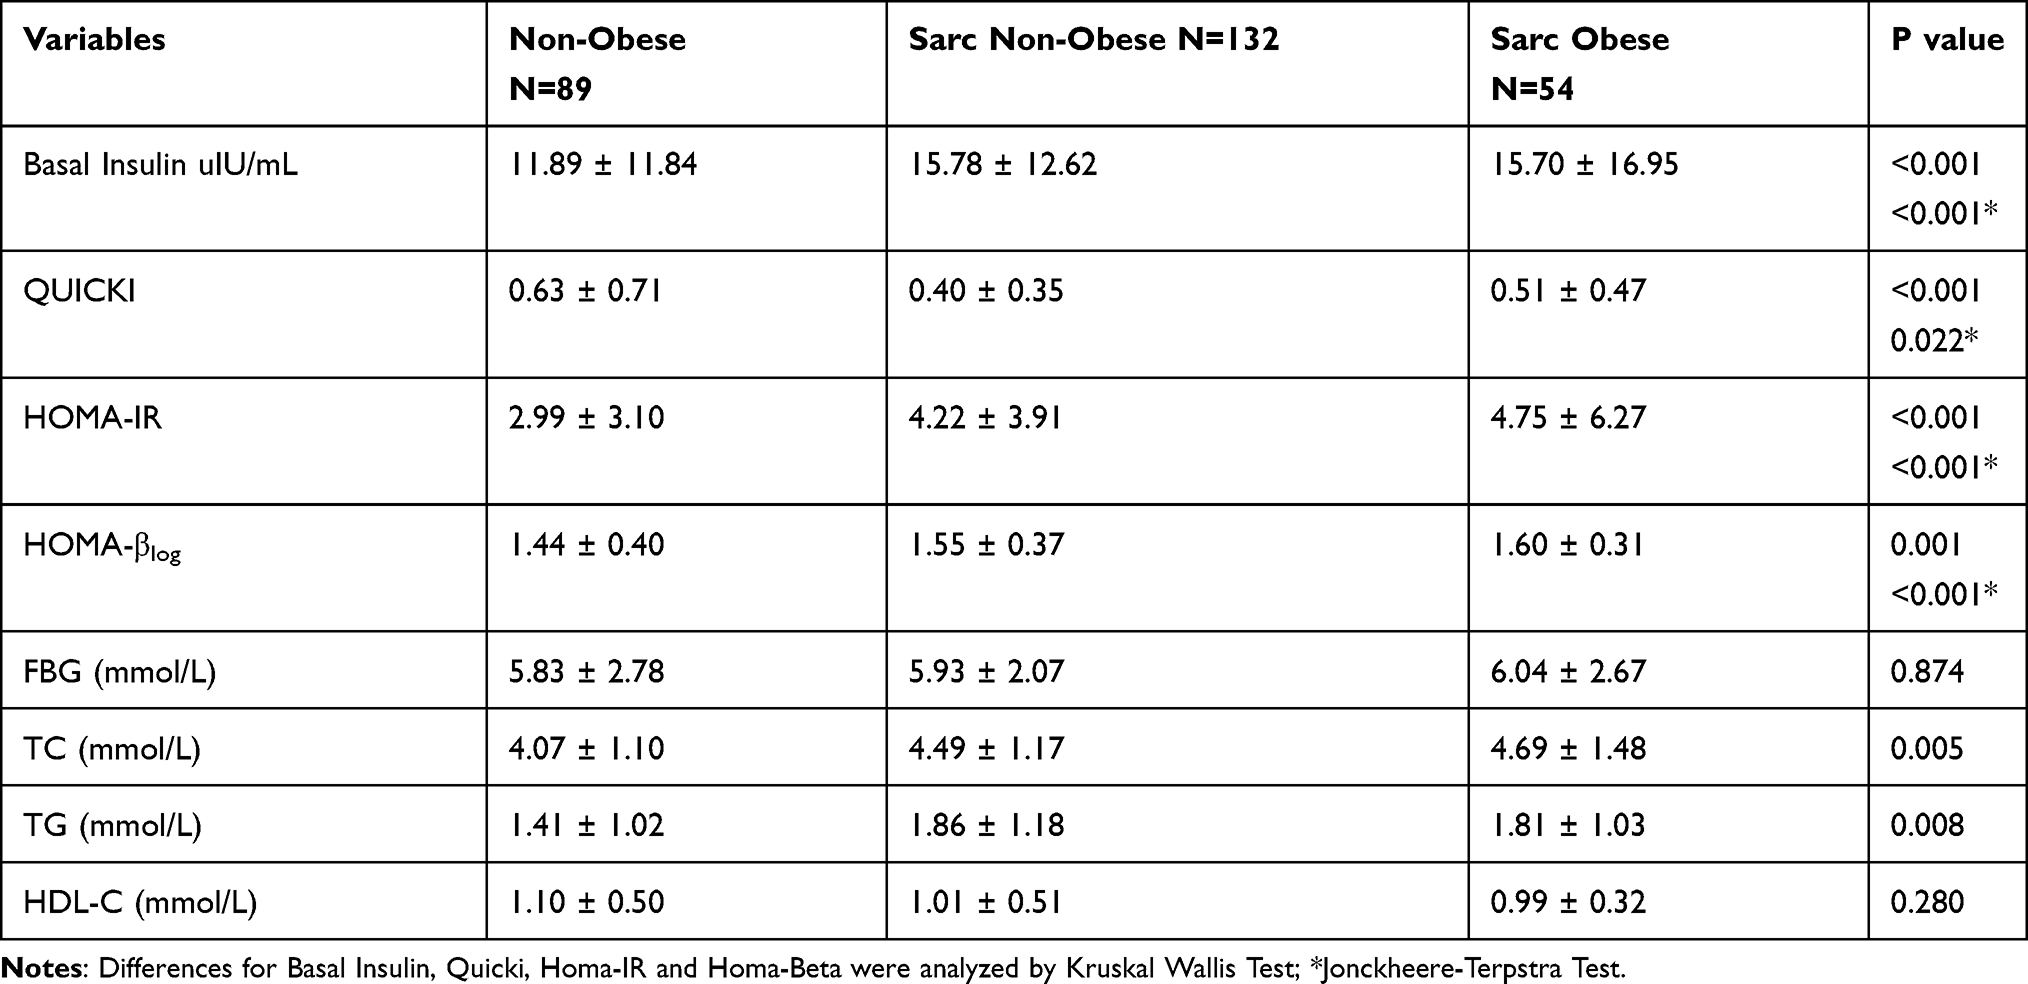 |
Table 2 Comparison of Insulin Resistance and Sensitivity Indices Between Non-Obese, Obese Without Sarcopenia and Obese with Sarcopenia (Sarcopenia Class 1[< 8.28]) |
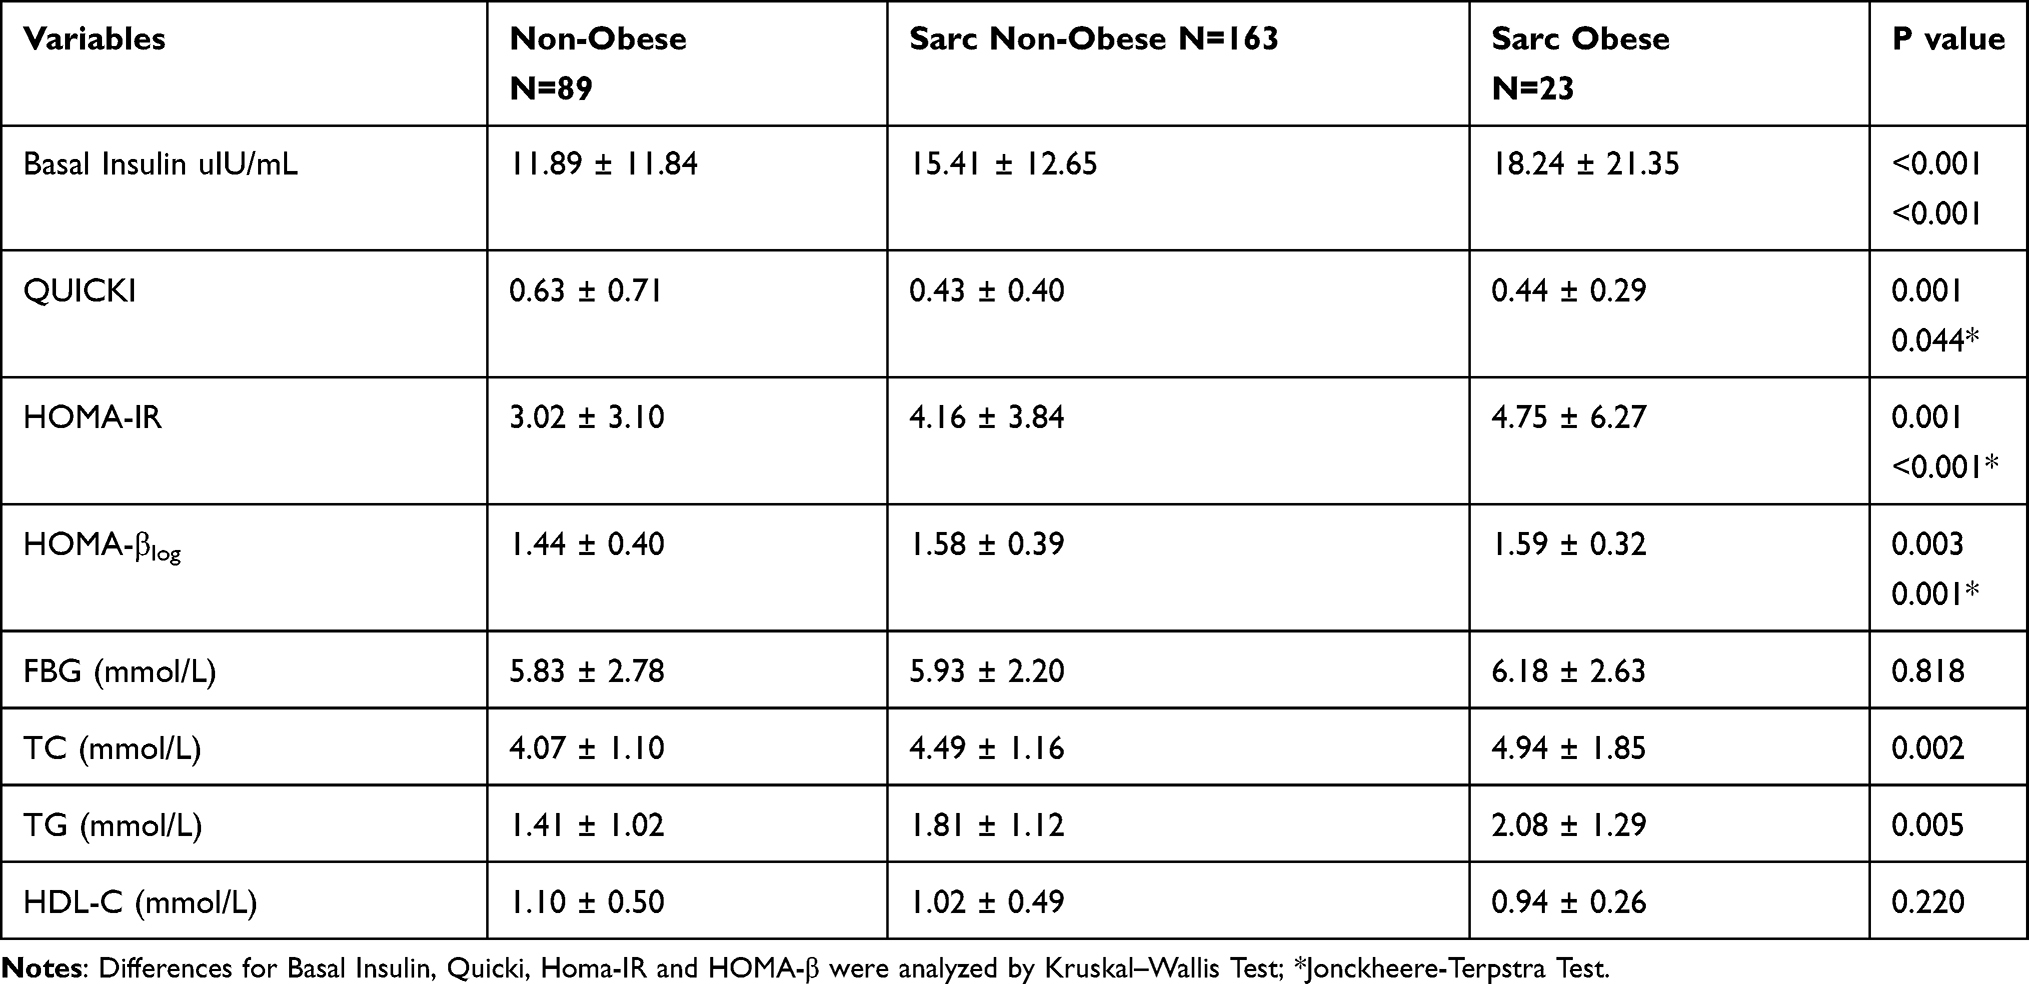 |
Table 3 Comparison of Insulin Resistance and Sensitivity Indices Between Non-Obese, Obese Without Sarcopenia and Obese with Sarcopenia (Sarcopenia Class 2 [<7.46]) |
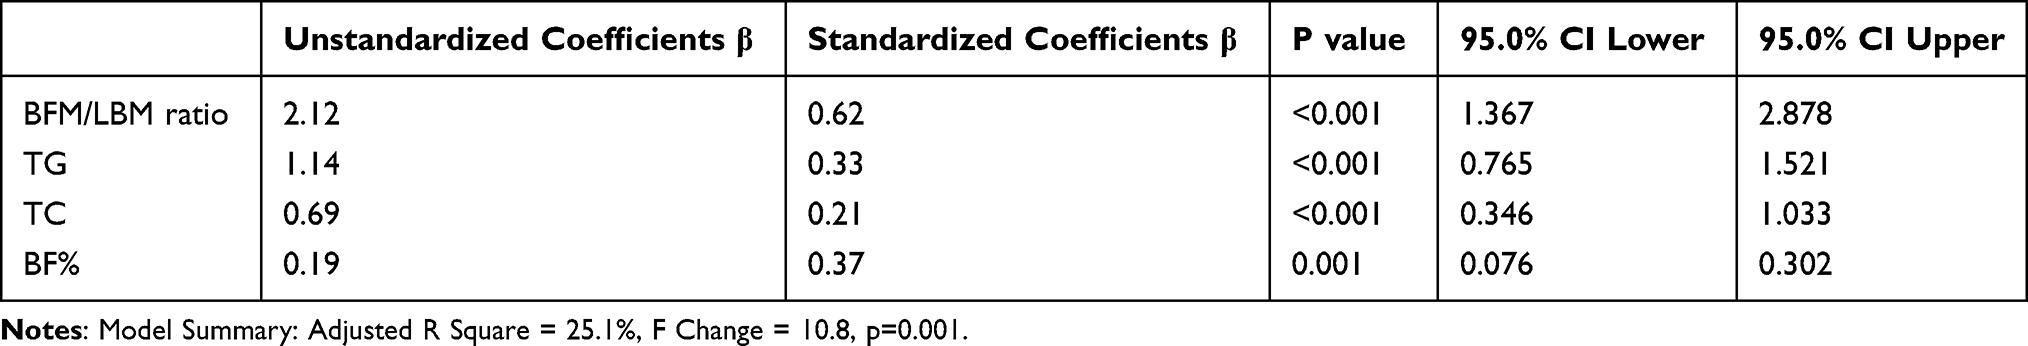 |
Table 4 Linear Regression Model with HOMA-IR as Dependent Variable |
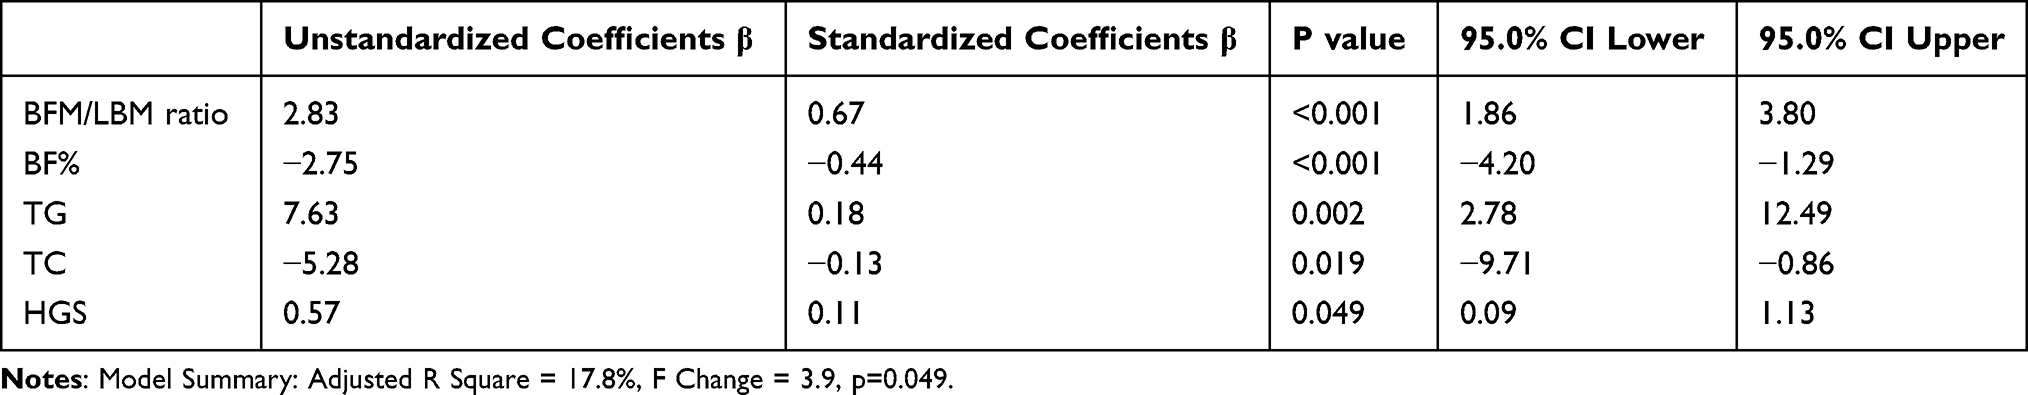 |
Table 5 Linear Regression Model with HOMA-β as Dependent Variable |
Discussion
In this cross-sectional analysis we observed that individuals with sarcopenic obesity present with significantly high insulin resistance and metabolic dysregulation compared to obese subjects without sarcopenia. These observations confirmed our hypothesis that the ObS subjects have high insulin resistance, beta cell stress and dyslipidemia. Our study supports the findings of Srikanthan et al16 who reported the effects of sarcopenia and sarcopenic obesity on insulin resistance and dyslipidemia. It was found that sarcopenia, by itself can lead to glucose metabolic dysregulation and people with less than 60 years of age are more vulnerable to prediabetic and diabetic states. These effects have an independent relationship apart from obesity and adiposity indices. It has been proposed that ObS patients have a higher atherosclerosis risk with a higher prevalence of MetS and T2DM compared to ObNonS or those having sarcopenia alone per se. All these reports and observations support the findings of our study.17,18 Since the prevalence of obesity is rising and usually sarcopenia associated with obesity is not taken into consideration we need ling term prospective studies that would specifically target and aim at sarcopenia prevention strategies, to prevent sarcopenic obesity and its metabolic consequences through exercise and diet programs.16 Skeletal muscle mass makes the major proportion of body organs responsible for glucose disposal after meals. They even become independent to insulin for glucose disposal when they are in exercising state. Skeletal muscle mass obviously decreases with advancing age and definitely can cause diminished insulin mediated glucose disposal which is independent of increased adiposity as mentioned earlier.19,20 Regular exercise starting at an early age can delay and sometime prevent this loss of muscle mass. The important changes in body composition associated with aging are a decline in skeletal muscle mass and an increase in body fat. Body fat distribution also changes with age; subcutaneous fat decreases and visceral abdominal fat increase, which contributes to numerous cardiometabolic diseases such as T2DM, dyslipidemia, and cardiovascular disease (CVD). A vicious cycle between the loss of muscle and the accumulation of ectopic fat might be associated with cardio metabolic diseases via an intricate interplay of factors including proinflammatory cytokines, oxidative stress, mitochondrial dysfunction, insulin resistance, dietary energy, physical activity, mitochondrial dysfunction, and other factors that have yet to be identified.20
Skeletal muscles are composed of both type 1 and type 2 fibers. However, it is well known that type II muscle fibers, are more resistant to metabolic actions and functions of insulin.21 These are actually lost to a greater extent than type I fibers with age related muscle mass decline and atrophies.22 In obese subjects at older ages there is greater lipid accumulation in skeletal muscles,23 which will concomitantly be is associated with increased skeletal muscle insulin resistance.24 This explains the reason that just sarcopenia cannot cause protection from a poor glycemic control state and diabesity in obese older adults which is not the case in non obese older adults. Our study shows that one of the major components of insulin resistance in metabolic syndrome and obesity is determined by sarcopenia which is aggravated by associated high adiposity. Thus sarcopenic obesity needs to be considered in the evaluation and management plans of obesity and T2DM. We have previously reported that excess adiposity measured by body composition analysis is associated with disturbed adipokines levels and poor metabolic control that increases cardiovascular risk in both normoglycemic subjects and patients with type 2 DM.25,26 The aging mechanisms that lead to tissue dysfunctions are related to, lipid accumulation in cells, intracellular dysfunctions in mitochondrial activities, proinflammatory states, high oxygen reactive species and free radicals causing oxidative stress, dysfunction of insulin sensitivity regulatory enzymes and autophagy.27 Intramyocellular involvement and sarcopenia is also associated with all the above mentioned mechanisms and exacerbates insulin resistance with its consequences. Therefore, during skeletal muscle aging there will be an increase in insulin resistance that leads to T2DM. An interesting study by Seo et al28 reported relationship of fat to skeletal muscle mass ratio with insulin resistance indices and MetS. Similar to our observations there was a significant association of this ratio with insulin resistance and it could be a novel marker for detecting MetS, both in normal weight and obese people. High ratio was associated with increase in cardiometabolic risk markers. Research studies are targeting at preventing sarcopenia and exercise regimes like low load blood flow restricted resistance exercise has been shown to provide an effective approach to increases long term muscle protein turnover, ribosomal activation, hypertrophy and gaining muscle strength.29,30 We observed that HOMA-B was significantly higher in both ObNonS and ObS subjects compared to Non Obese individuals. The possible reasons for it could be that beta cell responses vary considerably as they face stress of dysglycemia with super added effects of obesity indices and skeletal muscle mass. In other words the beta cells are stressed more to compensate for the higher insulin resistance.31 In a study by Chung et al the sarcopenic obese group was more closely associated with HOMA-IR, MetS, and CVD risk factors than any other group in this elderly population. The prevalence of sarcopenic obesity was 18.4% in men. Serum insulin level, HOMA-IR and TG levels were the highest in the sarcopenic obese group in both men and women, whereas HDL-C and 25-hydroxyvitamin D (25(OH)D) levels were the lowest in the sarcopenic obese group.32 Kim et al reported that the sarcopenic obese subjects had significantly higher risk of CVD by ≥20%, with an increased 10 year CVD risk than the non-sarcopenic non-obese group.33 The metabolic dysregulation is attributed to adipose tissue (AT) composition in obesity, which accumulate pro-inflammatory cells and have dysregulated production of various adipokines that create a local pro-inflammatory status due to excessive cytokines and chemokines release. Moreover, Obese AT store intramuscular lipids that induce mitochondrial dysfunction characterized by impaired β-oxidation capacity and increased reactive oxygen species formation providing lipotoxic environment and high insulin resistance. Also they lead to secretion of some pro-inflammatory myokines which induce muscle dysfunction which make an overall process of establishing a detrimental vicious circle maintaining AT and skeletal muscle inflammation, thus triggering and supporting OBS development. Thus, this process is a sarcopenia leading to obesity along with obesity leading to sarcopenia.34 Insulin resistance can induce an imbalance in glucose metabolism on one hand that triggers oxidative stress and causes an inflammatory response that leads to cell damage, while on the other hand it leads to dyslipidemic triad of high serum triglycerides, low levels of high-density lipoprotein, and increase in low-density lipoproteins.35,36 Thus sarcopenic obese individuals are having multifaceted syndrome that might have aggressive clinical outcomes. There is an urgent need to develop and implement effective strategies both at primary prevention and management levels for fighting against obesity associated with low muscle mass.
Strengths and Limitations
Our study focuses on the same gender and ethnic population which decreases the bias due to these factors. Our study highlights the importance of body composition indices in predicting metabolic dysregulation that might be sometime missed in routine clinical examinations. The cross-sectional nature of the study limits our ability to draw causal inferences from the relationships observed. Secondly our population sample was relatively small and subjects in sarcopenic group were few which make it difficult to draw a strong conclusion from our results.
Conclusions
Our study shows that when obesity is associated with sarcopenia, there is significantly greater insulin resistance and dyslipidemia than sarcopenia or obesity alone, in Saudi adult men. Thus sarcopenic obesity might be an independent risk factor for metabolic disease progression specially dysglycemia, in both normal weight and obese individuals.
Recommendations
Obesity associated with sarcopenia is sometime the hidden picture of metabolic dysregulation therefore we recommend body composition analysis at earlier stages of disease. Moreover, we need early and long term interventions programs to increase muscle mass in younger ages and preventing loss of muscle mass in older ages that may have the potential beneficial effect to reduce type 2 diabetes risk. Further research at large scale with prospective designs is required to explore the true pathophysiology and metabolic basis of the associations between sarcopenia, obesity and insulin resistance. This will lead to development of effective means to prevent sarcopenic obesity and its metabolic consequences.
Abbreviations
ALM, appendicular lean mass; BIA, bioelectrical impedance analysis; BMI, body mass index; BF%, body fat percentage; BFM, body fat mass; FFM, fat free mass; ALM, appendicular lean mass; TBW, total body water; FFMI, fat free mass index; TC, total cholesterol; TG, triglycerides; HDL-C, high density lipoprotein cholesterol; BI, basal Insulin, FBG, fasting blood glucose; QUICKI, Quantitative Insulin Sensitivity Check Index; HOMA-IR, homeostasis model assessment for insulin resistance.
Ethical Approval
The present study was approved by institutional review board (IRB) committee of King Saud University: IRB no. E-18-3381. The study is in accordance with 1964 Helsinki declaration and its ethical standards.
Informed Consent
Informed consent was obtained from all individual participants included in the study.
Acknowledgments
The authors are highly grateful to all Community Development Commissions of Riyadh districts who contributed to the study by contacting the older population of the community and hosting data collection. We also thank Research Support and Services Unit at Deanship of Scientific Research at KSU for the technical support.
Disclosure
The authors report no conflicts of interest for this work.
References
1. Alberti KG, Eckel RH, Grundy SM, et al. Harmonizing the metabolic syndrome: a joint interim statement of the international diabetes federation task force on epidemiology and prevention; national heart, lung, and blood institute; American heart association; world heart federation; international atherosclerosis society; and international association for the study of obesity. Circulation. 2009;120:1640–1645. doi:10.1161/CIRCULATIONAHA.109.192644
2. Romeo GR, Lee J, Shoelson SE. Metabolic syndrome, insulin resistance, and roles of inflammation–mechanisms and therapeutic targets. Arterioscler Thromb Vasc Biol. 2012;32:1771–1776. doi:10.1161/ATVBAHA.111.241869
3. Koh KK, Han SH, Quon MJ. Inflammatory markers and the metabolic syndrome: insights from therapeutic interventions. J Am Coll Cardiol. 2005;46:1978–1985. doi:10.1016/j.jacc.2005.06.082
4. Gami AS, Witt BJ, Howard DE, et al. Metabolic syndrome and risk of incident cardiovascular events and death: a systematic review and meta-analysis of longitudinal studies. J Am Coll Cardiol. 2007;49:403–414. doi:10.1016/j.jacc.2006.09.032
5. Cruz-Jentoft AJ, Baeyens JP, Bauer JM, et al. Sarcopenia: European consensus on definition and diagnosis: report of the European working group on sarcopenia in older people. Age Ageing. 2010;39(4):412–423. doi:10.1093/ageing/afq034
6. Chen L-K, Liu L-K, Woo J, et al. Sarcopenia in Asia: consensus report of the Asian working group for sarcopenia. J Am Med Dir Assoc. 2014;15(2):95–101. doi:10.1016/j.jamda.2013.11.025
7. Janssen I, Heymsfield SB, Wang Z, Ross R. Skeletal muscle mass and distribution in 468 men and women aged 18–88 years. J Appl Physiol. 2000;89(1):81–88. doi:10.1152/jappl.2000.89.1.81
8. Janssen I, Heymsfield SB, Ross R. Low relative skeletal muscle mass (sarcopenia) in older persons is associated with functional impairment and physical disability. J Am Geriatr Soc. 2002;50(5):889–896. doi:10.1046/j.1532-5415.2002.50216.x
9. Zhang H, Lin S, Gao T, et al. Association between sarcopenia and metabolic syndrome in middle-aged and older non-obese adults: a systematic review and meta-analysis. Nutrients. 2018;10:E364. doi:10.3390/nu10030364
10. Yakout SM, Alkahtani SA, Al-Disi D, et al. Coexistence of pre-sarcopenia and metabolic syndrome in Arab men. Calcif Tissue Int. 2019;104:130–136. doi:10.1007/s00223-018-0477-2
11. Alkahtani SA. A cross-sectional study on sarcopenia using different methods: reference values for healthy Saudi young men. BMC Musculoskelet Disord. 2017;18:119. doi:10.1186/s12891-017-1483-7
12. Pietrobelli A, Rubiano F, St-Onge MP, Heymsfield SB. New bioimpedance analysis system: improved phenotyping with whole-body analysis. Eur J Clin Nutr. 2004;58:1479–1484. doi:10.1038/sj.ejcn.1601993
13. Habib SS. Body mass index and body fat percentage in assessment of obesity prevalence in Saudi adults. Biomed Environ Sci. 2013;26:94–99. doi:10.3967/0895-3988.2013.02.003
14. Wallace TM, Levy JC, Matthews DR. Use and abuse of HOMA modeling. Diabetes Care. 2004;27(6):1487–1495. doi:10.2337/diacare.27.6.1487
15. Salgado AL, Carvalho L, Oliveira AC, Santos VN, Vieira JG, Parise ER. Insulin resistance index (HOMA-IR) in the differentiation of patients with non-alcoholic fatty liver disease and healthy individuals. Arq Gastroenterol. 2010;47(2):165–169. doi:10.1590/S0004-28032010000200009
16. Srikanthan P, Hevener AL, Karlamangla AS. Sarcopenia exacerbates obesity-associated insulin resistance and dysglycemia: findings from the national health and nutrition examination survey III. PLoS One. 2010;5(5):e10805. doi:10.1371/journal.pone.0010805
17. Maliszewska K, Adamska-Patruno E, Krętowski A. The interplay between muscle mass decline, obesity, and type 2 diabetes. Pol Arch Intern Med. 2019;129(11):809–816. doi:10.20452/pamw.15025.
18. Mesinovic J, Zengin A, De Courten B, Ebeling PR, Scott D. Sarcopenia and type 2 diabetes mellitus: a bidirectional relationship. Diabetes Metab Syndr Obes. 2019;12:1057–1072. doi:10.2147/DMSO.S186600
19. Kim TN, Choi KM. The implications of sarcopenia and sarcopenic obesity on cardiometabolic disease. J Cell Biochem. 2015;116(7):1171–1178. doi:10.1002/jcb.25077
20. Polyzos SA, Margioris AN. Sarcopenic obesity. Hormones. 2018;17(3):321–331. doi:10.1007/s42000-018-0049-x
21. Nader GA, Esser KA. Intracellular signaling specificity in skeletal muscle in response to different modes of exercise. J Appl Physiol. 2001;90:1936–1942. doi:10.1152/jappl.2001.90.5.1936
22. Doherty TJ. Invited review: aging and sarcopenia. J Appl Physiol. 2003;95:1717–1727. doi:10.1152/japplphysiol.00347.2003
23. Goodpaster BH, Theriault R, Watkins SC, Kelley DE. Intramuscular lipid content is increased in obesity and decreased by weight loss. Metabolism. 2000;49:467–472. doi:10.1016/S0026-0495(00)80010-4
24. Petersen KF, Befroy D, Dufour S, et al. Mitochondrial dysfunction in the elderly: possible role in insulin resistance. Science. 2003;300:1140–1142. doi:10.1126/science.1082889
25. Habib SS, Al Regaiey KA, Al Dokhi L. Assessment of adipokines relationships with cardiovascular risk markers in relation to body indices in normoglycemic males. Pak J Med Sci. 2013;29(1):21–26. doi:10.12669/pjms.291.2913
26. Habib SS. Serum resistin levels in patients with type 2 diabetes mellitus and its relationship with body composition. Saudi Med J. 2012;33(5):495–499.
27. Shou J, Chen PJ, Xiao WH. Mechanism of increased risk of insulin resistance in aging skeletal muscle. Diabetol Metab Syndr. 2020;11(12):14. doi:10.1186/s13098-020-0523-x
28. Seo YG, Song HJ, Song YR. Fat-to-muscle ratio as a predictor of insulin resistance and metabolic syndrome in Korean adults. J Cachexia Sarcopenia Muscle. 2020;11(3):710–725. doi:10.1002/jcsm.12548.
29. Bjørnsen T, Wernbom M, Kirketeig A, et al. Type 1 muscle fiber hypertrophy after blood flow-restricted training in powerlifters. Med Sci Sports Exerc. 2019;51(2):288–298. doi:10.1249/MSS.0000000000001775
30. Sieljacks P, Wang J, Groennebaek T, et al. Six weeks of low-load blood flow restricted and high-load resistance exercise training produce similar increases in cumulative myofibrillar protein synthesis and ribosomal biogenesis in healthy males. Front Physiol. 2019;29(10):649. doi:10.3389/fphys.2019.00649
31. Chen ME, Chandramouli AG, Considine RV, Hannon TS, Mather KJ. Comparison of β-cell function between overweight/obese adults and adolescents across the spectrum of glycemia. Diabetes Care. 2018;41(2):318–325. doi:10.2337/dc17-1373
32. Chung JY, Kang HT, Lee DC, Lee HR, Lee YJ. Body composition and its association with cardiometabolic risk factors in the elderly: a focus on sarcopenic obesity. Arch Gerontol Geriatr. 2013;56(1):270–278. doi:10.1016/j.archger.2012.09.007
33. Kim JH, Cho JJ, Park YS. Relationship between sarcopenic obesity and cardiovascular disease risk as estimated by the Framingham risk score. J Korean Med Sci. 2015;30(3):264–271. doi:10.3346/jkms.2015.30.3.264
34. Kalinkovich A, Livshits G. Sarcopenic obesity or obese sarcopenia: a cross talk between age-associated adipose tissue and skeletal muscle inflammation as a main mechanism of the pathogenesis. Ageing Res Rev. 2017;35:200–221. doi:10.1016/j.arr.2016.09.008
35. Ormazabal V, Nair S, Elfeky O, Aguayo C, Salomon C, Zuñiga FA. Association between insulin resistance and the development of cardiovascular disease. Cardiovasc Diabetol. 2018;17(1):122. doi:10.1186/s12933-018-0762-4
36. Lin D, Qi Y, Huang C, et al. Associations of lipid parameters with insulin resistance and diabetes: a population-based study. Clin Nutr. 2018;37(4):1423–1429. doi:10.1016/j.clnu.2017.06.018
 © 2020 The Author(s). This work is published and licensed by Dove Medical Press Limited. The
full terms of this license are available at https://www.dovepress.com/terms
and incorporate the Creative Commons Attribution
- Non Commercial (unported, 3.0) License.
By accessing the work you hereby accept the Terms. Non-commercial uses of the work are permitted
without any further permission from Dove Medical Press Limited, provided the work is properly
attributed. For permission for commercial use of this work, please see paragraphs 4.2 and 5 of our Terms.
© 2020 The Author(s). This work is published and licensed by Dove Medical Press Limited. The
full terms of this license are available at https://www.dovepress.com/terms
and incorporate the Creative Commons Attribution
- Non Commercial (unported, 3.0) License.
By accessing the work you hereby accept the Terms. Non-commercial uses of the work are permitted
without any further permission from Dove Medical Press Limited, provided the work is properly
attributed. For permission for commercial use of this work, please see paragraphs 4.2 and 5 of our Terms.