Back to Journals » Journal of Pain Research » Volume 13
Sad Music Modulates Pain Perception: An EEG Study
Authors Guo S ![]() , Lu J, Wang Y
, Lu J, Wang Y ![]() , Li Y, Huang B, Zhang Y, Gong W, Yao D
, Li Y, Huang B, Zhang Y, Gong W, Yao D ![]() , Yuan Y, Xia Y
, Yuan Y, Xia Y
Received 26 May 2020
Accepted for publication 23 July 2020
Published 7 August 2020 Volume 2020:13 Pages 2003—2012
DOI https://doi.org/10.2147/JPR.S264188
Checked for plagiarism Yes
Review by Single anonymous peer review
Peer reviewer comments 3
Editor who approved publication: Dr Micheal Schatman
Sijia Guo1,2 ,* Jing Lu,1– 3,* Yufang Wang,2 Yuqin Li,2 Binxin Huang,2 Yuxin Zhang,2 Wenhui Gong,2 Dezhong Yao,1– 3 Yin Yuan,1 Yang Xia1– 3
1The Clinical Hospital of Chengdu Brain Science Institute, MOE Key Laboratory for Neuroinformation, University of Electronic Science and Technology of China, Chengdu, People’s Republic of China; 2Center for Information in BioMedicine, School of Life Science and Technology, University of Electronic Science and Technology of China, Chengdu, People’s Republic of China; 3Research Unit of NeuroInformation, Chinese Academy of Medical Sciences, 2019RU035, Chengdu, People’s Republic of China
*These authors contributed equally to this work
Correspondence: Yin Yuan; Yang Xia Email [email protected]; [email protected]
Background: Music has shown positive effects on pain management in previous studies. However, the relationship between musical emotional types and therapeutic effects remains unclear. To investigate this issue, this study tested three typical emotional types of music and discussed their neural mechanisms in relation to pain modulation.
Subjects and Methods: In this experiment, 40 participants were exposed to cold pain under four conditions: listening to happy music, listening to neutral music, listening to sad music and no sound. EEG and pain thresholds were recorded. The participants were divided into the remission group and the nonremission group for analysis. Differences among conditions were quantified by the duration of exposure to the pain-inducing stimulus in the remission group. EEG data were obtained using a fast Fourier transform (FFT) and then correlated with the behavioral data.
Results: We found that sad music had a significantly better effect on alleviating pain, as a result of brain oscillations in a higher beta band and the gamma band at the O2 and P4 electrodes. The comparison between the remission group and the nonremission group suggested that personality may affect music-induced analgesia, and dominance, liveliness and introvert and extrovert personality traits were associated with pain modulation by sad music. Additionally, in the network analysis, we compared brain networks under the three conditions and discussed the possible mechanisms underlying the better analgesic effect of sad music.
Conclusion: Sad music may have a better effect on alleviating pain, and its neural mechanisms are also discussed. This work may help understand the effects of music on pain modulation, which also has potential value for clinical use.
Keywords: pain, music-induced analgesia, personality, EEG, brain network
Introduction
Pain is a complex experience caused by tissue damage or other noxious stimuli, and it can bring unpleasant feelings and emotions. Usually, this experience is subjectively reported by humans. Pain perception varies widely among different populations,1 and studies have found that this specificity may be related to personality traits, such as extroversion being negatively correlated with perceived pain intensity.2 Searching for the appropriate methods of pain intervention is the current focus. As an experimental stimulus that can affect the emotional state and attention of subjects, music has been commonly applied in various experiments examining pain interventions.3 Although music-induced analgesia has not been universally agreed upon at present, some behavioral and clinical studies have confirmed it. For example, a study in cancer patients has shown that listening to music can improve the pain of patients, which was manifested in a report of subjective pain.4 Clinical studies on patients after surgery also found a similar phenomenon: subjects who listened to music had a decrease in pain and an increase in oxytocin levels in the blood, which may have been related to subjective relaxation.5,6 Neuroimaging studies examining brain mechanisms have also suggested that music interventions have positive effects on pain. Studies with fibromyalgia patients have shown that listening to music induced an increase in the amplitude of low-frequency fluctuations of blood oxygen level-dependent (BOLD) signals in the left angular gyrus of patients, which was related to the decreases in pain scores.7 Changes in the resting state functional connectivity in patients were significant before and after listening to music.8 The brain mechanisms underlying music-induced analgesia may involve the interaction of music with pain pathways.9 Dobek et al compared the two states of listening to pleasant music and resting. Brain regions associated with music listening (amygdala, hippocampus, etc.) and the pain modulatory pathway (dorsal gray matter of the spinal cord, periaqueductal gray and rostral ventromedial medulla) were activated.3
Cognitive and emotional factors such as emotions and attention can affect pain perception.10 Specifically, there are very large emotional influences on pain. Clinical research on emotional effects on pain perception has shown that anxiety can exacerbate the pain experience, and patients with anxiety about injections feel more pain and have a longer duration of pain than less anxious patients.11 Conducting distracting activities is one of the most commonly used methods for relieving pain; diverting attention from pain to other stimuli is effective for controlling pain and may involve competition among information processing resources.12 In a study supporting this opinion, the effects of distraction on pain were explored by manipulating the attention of subjects in experiments examining the induction of pain. The results indicated that attention competition was helpful for reducing pain.13 Changes in cognitive and emotional effects could be reflected by gamma neural oscillations in parietal and occipital regions.14,15 Studies on pain induced by external stimulation and nociceptive input have found that parietal and occipital regions have specific EEG activity patterns. These studies may reveal the underlying effects and brain mechanisms of music’s influence on pain perception. Furthermore, event-related potential (ERP) research has suggested that happy music resulted in subjects allocating their attentional resources more diffusely, which indicated that music-induced emotions broadened the scope of auditory attention.16 These studies have indicated that music-induced analgesia may be secondary to cognitive and emotional effects that arise from listening to music.17 Cognitive, emotional and auditory factors are considered as a whole, which promotes pain relief when people listen to music, and musical emotional types may be an important factor in this process. In daily life, people may enjoy the feelings induced by sad music.18 They can feel some degree of pleasure from sadness, which may be why research on music-induced analgesia shows that listening to a sad melody can modulate pain.19 The mixture of positive and negative emotions caused by sad music may have unique effects on pain relief. Thus, to find evidence for the efficacy of listening to sad music for analgesia and explore the role of musical emotional types as well as the related brain mechanisms, we used three emotional types of music, namely, happy, neutral and sad, to intervene in cold-induced pain. In addition, people may have different pain perception and experience for different musical emotional types due to individual characteristics. We divided the subjects into the remission group and the nonremission group based on pain tolerance times, which may be more conducive to our exploration of mechanisms of music-induced analgesia. This study provides new insight into music-induced analgesia and provides evidence for selecting musical stimuli in research on pain interventions.
Subjects and Methods
Participants
Forty healthy adults (28 males, ages: 24.58±1.73 years), right-handed, with normal hearing were recruited in the experiment. All participants had only primary music education, without neurological, psychiatric or other health problems, and they had not been on medication in the previous three months. The Sixteen Personality Factor Questionnaire (16PF) was completed before the experiment. EEG data were collected during the task, which required the participants to immerse their hands in cold water for as long as possible, and the participants could sometimes listen to music through headphones during this process.
The study was approved by the Ethics Committee of the School of Life Science and Technology at the University of Electronic Science and Technology of China and conducted in accordance with the Declaration of Helsinki. All participants were paid for participation, and they provided informed consent before the experiment.
Stimulus
Pain was induced with cold water maintained at 6 (±0.1)°C, which was continuously circulating in a cryogenic cycle instrument (DX-208, Beijing Coolium Scientific Instruments Co., Ltd, Beijing). To ensure that each subject perceived the maximal pain induced by the low temperature, we did not place a limit on the time that the subjects immersed their hands in the cold water and told them to keep their hands in the water as long as possible. In addition, to restore the baseline state, the participants immersed their hands in normal temperature water after each trial ended.
In the current study, happy, neutral and sad musical pieces were randomly selected from the Chinese Affective Music Mood System (CAMS), which provides a standard set of music stimuli for emotional research with Chinese participants.20 The music in CAMS was selected by professional musicians and had a fixed loudness that was comfortable for participants. Six pieces of music that were sixty seconds in length were included for each musical emotional type. In addition, no sound was used as a control condition. The scores of indexes of musical stimuli used in the experiment are provided in Supplementary 1.
Experimental Tasks
In the experiment, we selected six happy, six neutral and six sad musical pieces. These pieces were divided into six groups, and each group included one happy, one neutral, and one sad piece of music. Each participant was seated in a comfortable chair in a sound-attenuated, brightly lit, temperature-controlled (25–27°C) room. The subjects were asked to carefully read the instructions on the screen and to place their left hand on the edge of the cryogenic cycle instrument, and their right hand was responsible for pressing the keyboard. Before the experiment, the participants were instructed to avoid strong head movements. When the subjects were ready, they could press any key to start the experiment. The experimental session comprised six trials corresponding to the six groups of musical stimuli, and each trial included four conditions (happy music, neutral music, sad music and no sound) that were randomly presented across subjects. When the instruction appeared on the screen, the subjects needed to immerse their left hands in cold water at 6 (±0.1)°C while listening to music through headphones. During this process, the subjects were instructed to stare at the cross in the center of the screen. In addition, this process lasted as long as the duration that the subjects kept their hands in the water; the subjects were not allowed to take their hands out of the water until they thought the pain had become unbearable. The subjects needed to press a key to record the duration when they removed their hands from the water, and the duration was defined as the index that represents pain tolerance. The participants with pain tolerance times that were too high or low may have pain tolerance levels affected by other factors; thus, we excluded the participants whose pain tolerance time was below 0.5 minutes or above 2 minutes. Additionally, to restore the baseline state, the subjects were required to put their hands in 25–27°C water between the end of one condition and the beginning of the next condition. Before the experiment, the subjects completed the 16PF. E-prime 3.0 (Psychology Software Tools, PA, Pittsburgh) was used for programming the experimental tasks (Figure 1).
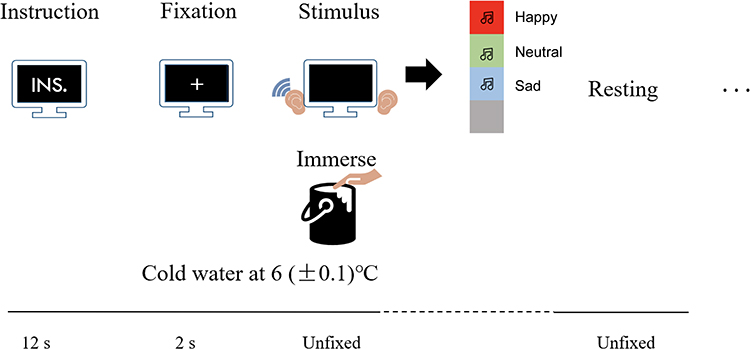 |
Figure 1 The instructions were presented on the screen for 12 s, which introduced the whole experimental task to the subjects. After fixation on a cross for 2 s, the subjects placed their left hands in 6 (±0.1)°C cold water in the cryogenic cycle instrument and randomly listened to music (one of four conditions) through headphones at the same time. |
EEG Data Acquisition
EEG recording was performed with 64 Ag/AgCl electrodes (ANT Neuro, Germany). These electrodes were positioned according to the extended 10–20 system, and the data were recorded at a sampling rate of 1000 Hz. The bandpass filter was set between 0.5 and 100 Hz, and CPz was used as a reference electrode. Vertical and horizontal electrooculograms (EOGs) to monitor eye movements were recorded from 2 additional channels located on the right side of the right eye and below the left eye. During the entire experimental task, the impedances of the electrodes were kept below 20 kΩ.
Methods
The Sixteen Personality Factor Questionnaire (16PF)
The 16PF is a widely used self-report personality questionnaire.21 It includes sixteen scales, such as warmth (A), reasoning (B), emotional stability (C), dominance (E), liveliness (F), etc. Furthermore, it includes eight secondary-level scales, such as adaptation and anxiety (X1), introvert and extrovert (X2), etc. These scales represent personality traits. On the 16PF, sixteen primary personality traits are evaluated by using a score from 1 (low) to 10 (high), where three and below are considered low scores, while eight and above are considered high scores.22 The eight secondary-level personality traits are calculated based on the sixteen primary personality traits.
EEG Data Preprocessing
Task-related EEGs were preprocessed with the following procedures. We first chose the 21-channel EEG datasets (FP1, FPz, FP2, F7, F3, Fz, F4, F8, T7, C3, Cz, C4, T8, P7, P3, Pz, P4, P8, O1, O2, Oz)23,24 and re-referenced the raw EEG data sets to a neutral reference by using REST (Reference Electrode Standardization Technique).25,26 Next, to reduce low-frequency drift and high-frequency noise, the re-referenced data sets were subjected to offline bandpass filtering in the frequency range of 1–45 Hz. We segmented the filtered data into 2-s epochs. Finally, a threshold of ± 80 µV was used to exclude fragments contaminated with high amplitude artifacts.
Spectrum Analysis
The participants were divided based on pain tolerance times into the remission group (RG; pain tolerance time while listening to music > pain tolerance time with no sound, which indicated that the music intervention was effective) and the nonremission group (NG; pain tolerance time while listening to music ≤ pain tolerance time with no sound, which indicated that the music intervention was ineffective). Then, we analyzed the frequency spectrum of the preprocessed EEG signals by using fast Fourier transform (FFT). Considering that the gamma band may play an important role in pain relief, we focused on the gamma band. In addition, we divided the beta band into beta-1 (13–20 Hz) and beta-2 (20–30 Hz), which was helpful for exploring high-frequency activities in relation to the pain intervention. Spectrum amplitudes were calculated and compared across six conditions (RG: happy music vs no sound, neutral music vs no sound, sad music vs no sound; NG: happy music vs no sound, neutral music vs no sound, sad music vs no sound) at six frequency bands, ie, delta (1–4 Hz), theta (4–8 Hz), alpha (8–13 Hz), beta-1 (13–20 Hz), beta-2 (20–30 Hz) and gamma (30–45 Hz). Furthermore, the same calculation was performed for the nonremission group, and the two groups were compared. A paired t-test was used for comparison between the two conditions (Pain+Music & Pain, p<0.05), and the two-sample t-test was used to compare the difference between the two groups (remission group and nonremission group, p<0.05). Cohen’s d was used to measure the effect size, which is defined as the difference between two means divided by the SD of the data. Correlation analyses for the remission group were computed between the spectrum amplitudes and pain tolerance times and between personality traits scores and pain tolerance times.
Coherence Network
Coherence networks are important indicators of functional networks in EEG research. It is a kind of spectral analysis that reflects the linear correlation between two signals at a certain frequency. In this study, we employed coherence to measure the cooperative, synchrony-defined neuronal assemblies at each frequency bin. The coherence coefficient between signals x and y was formulized as follows:
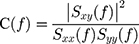
where C(f) denotes the coherence coefficient of signals x(t) and y(t); Sxy(f) is the cross-spectrum of signals x(t) and y(t); and Sxx(f) and Syy(f) are the autospectra of signals x(t) and y(t), respectively.
Thereafter, based on the coherence networks constructed in the beta-2 and gamma bands, we calculated the difference map of the coherence networks in the conditions in which the RG listened to music or no sound.
Results
Spectrum Differences of the Remission Group
Twenty and eighteen subjects were divided into the remission group and the nonremission group, respectively, based on the pain tolerance time when they listened to sad music. Spectral differences are illustrated in Figure 2A between the condition of the RG listening to sad music and the condition of no sound (Pain). The O2 electrode showed significant FFT differences in the beta-2 and gamma bands (beta-2: t=1.992, p=0.031, d=0.446; gamma: t=2.017, p=0.029, d=0.451), and the P4 electrode showed significant FFT differences in the gamma band (t=1.756, p=0.048, d=0.393). Additionally, the nonremission group showed no difference in the O2 and P4 electrodes in the beta-2 (20–30 Hz) and gamma (30–45 Hz) bands (Supplementary 2).
Correlations Between Pain Tolerance Times and FFT Amplitudes
Additionally, in the gamma band at the P4 electrode, there were positive correlations between the spectrum amplitude and the pain tolerance time in the RG listening to sad music and RG no sound conditions (r pain+sad music =0.608, p pain+sad music =0.004; r pain =0.475, p pain =0.034) (Figure 2B). In the beta-2 and gamma bands at the O2 electrode, there were positive correlations between the spectra amplitudes and the pain tolerance time in the no sound condition (r=0.502, p=0.024; r=0.517, p=0.020, respectively) (Figure 2B). There were no significant correlations between the spectra amplitudes and the pain tolerance times in other conditions (Supplementary 3).
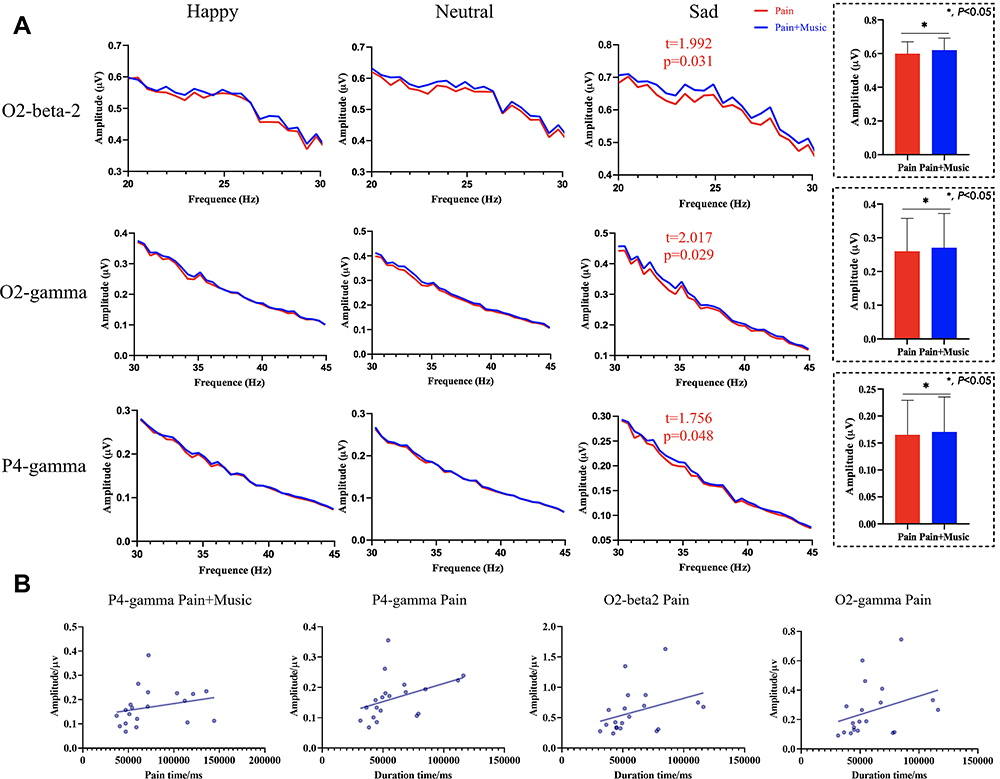 |
Figure 2 Spectral differences and correlations between pain tolerance times and FFT amplitudes. (A) The spectral amplitudes at the O2 and P4 electrodes in the beta-2 (20–30 Hz) and gamma (30–45 Hz) bands. Blue and red lines denote the remission group listening to music (Pain+Music) condition and no sound (Pain) condition, respectively. (B) Correlation analysis between the spectra amplitudes and the pain tolerance times. There were positive correlations between the spectra amplitudes and pain tolerance times in the two conditions (remission group listening to sad music, Pain+Sad Music; remission group with no sound, Pain) in the gamma (30–45 Hz) band at the P4 electrode. There were positive correlations between spectra amplitudes and pain tolerance times in the no sound (Pain) condition in the beta-2 (20–30 Hz) and gamma (30–45 Hz) bands at the O2 electrode. |
Spectral Differences Between the Remission and Nonremission Groups
Furthermore, we calculated the difference between the remission and nonremission groups in the conditions of no sound (Pain) and listening to sad music (Pain+Music). In the condition of no sound, the results showed that there was no difference between the two groups (Supplementary 4A), while the P4 electrode showed a marginal significant difference in the gamma band in the condition of listening to sad music (t=1.347, p=0.093, d=0.438, Supplementary 4B).
Correlations Between Personality Traits and FFT Amplitudes
In the following step, we explored whether personality had an influence on FFT amplitudes in the beta-2 and gamma bands. We computed correlation analyses between personality trait scores and FFT amplitudes. The analysis of sixteen main personality traits and eight secondary-level personality traits showed no significant differences between the RG and the NG (Supplementary 5).
In the RG listening to sad music (Pain+Sad Music) and the no sound (Pain) conditions, there were significant correlations between the spectrum amplitudes at the P4 electrode and pain tolerance times (r pain =0.608, p pain =0.004; r pain+sad music =0.475, p pain+sad music =0.034; Figure 2B). Therefore, the correlations between the spectra amplitudes at P4 and personality trait scores were analyzed (Supplementary 6 and Supplementary 7). The results showed that there were negative correlations between dominance (r=−0.467, p=0.038), liveliness (r=−0.509, p=0.022), and introvert and extrovert (r=−0.489, p=0.029) personality factors and spectra amplitudes in the RG listening to sad music condition. There were negative correlations between dominance (r=−0.477, p=0.034), liveliness (r=−0.486, p=0.030), and introvert and extrovert (r=−0.477, p=0.033) personality factors and spectra amplitudes in the no sound condition (Figure 3). People with high dominance (E) scores are dominant, forceful, and assertive, while those with low dominance (E) scores are deferential and cooperative and avoid conflict. People with high liveliness (F) scores are enthusiastic, animated, and spontaneous, while those with low liveliness (F) scores are serious, restrained, and careful. People with high introvert and extrovert (X2) scores are extroverted and socially participating, while those with low introvert and extrovert (X2) scores are introverted and socially inhibited. Our results showed that the scores of the subjects were mostly between five and eight, which were slightly high.
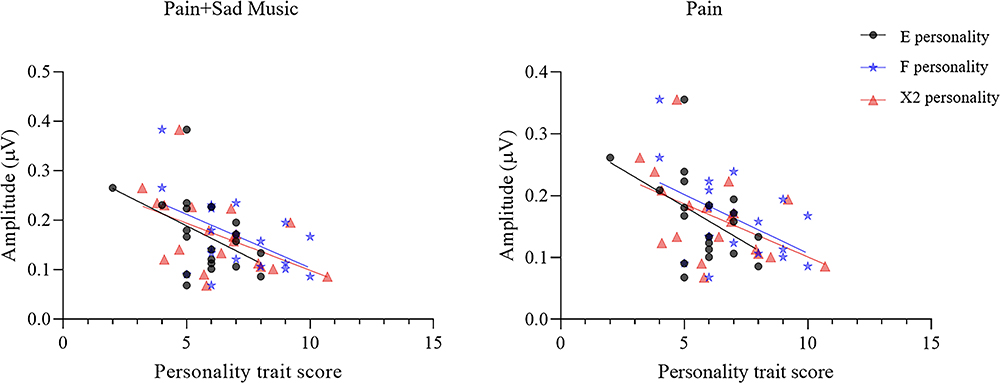 |
Figure 3 Correlation analyses between personality trait scores and spectra amplitudes at the P4 electrode in the gamma band (30–45 Hz). There were negative correlations between spectral amplitudes and dominance (E, r=−0.467, p=0.038), liveliness (F, r=−0.509, p=0.022), and introvert and extrovert (X2, r=−0.489, p=0.029) personality factors in the condition of listening to sad music (Pain+Sad Music) in the remission group, as well as between spectra amplitudes and dominance (E, r=−0.477, p=0.034), liveliness (F, r=−0.486, p=0.030), and introvert and extrovert (X2, r=−0.477, p=0.033) personality factors in the condition of no sound (Pain). |
Coherence Network
The difference maps of the coherence networks in the RG listening to music condition and no sound condition are illustrated in Figure 4. The topological differences showed that the functional connectivity of the RG listening to happy or neutral music was significantly lower than that of the RG with no sound. However, for the RG listening to sad music, the numbers of connections showing enhancement and attenuation were similar, indicating that the brain had different patterns when the RG listened to sad music (false discovery rate (FDR)-uncorrected p<0.05).
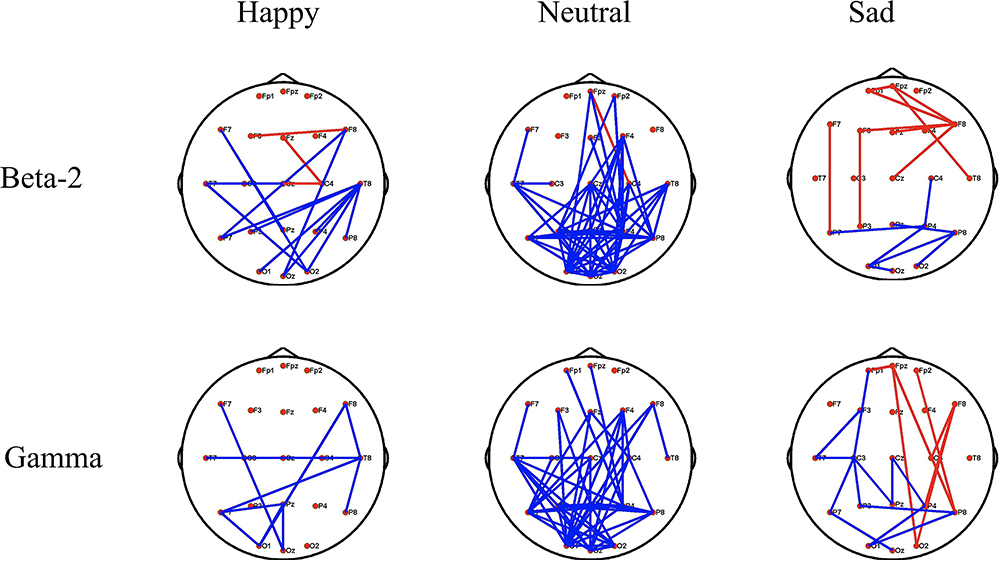 |
Figure 4 Topological differences in the beta-2 (20–30 Hz) and gamma (30–45 Hz) bands between the remission group listening to music (Pain+Music) and no sound (Pain) conditions. The red solid lines denote that the functional connectivity of Pain+Music is higher than that of Pain, and the blue solid lines denote that the functional connectivity of Pain+Music is lower than that of Pain (FDR-uncorrected p < 0.05). |
Discussion
Music-induced analgesia has been demonstrated in some studies, although it is not universally accepted.9,27 Difference may be because music has different influences and analgesic effects in different people. Therefore, the current study tried to divide subjects into the remission group and the nonremission group based on pain tolerance times. To explore which emotional type of music had a better effect on pain relief and its neural mechanism, we evaluated EEG data from the remission group and compared the FFT amplitudes between the two groups.
According to the FFT results, the remission group while listening to sad music showed that O2 and P4 electrodes had a higher FFT amplitude in the gamma (30–45 Hz) and beta-2 (20–30 Hz) bands than when there was no sound. Previous studies have noted that noxious stimuli do not activate a single pain center but a widespread network of brain regions that involve the parietal region.28 Researchers have suggested that nociceptive pain could induce specific patterns of neural activity in the parietal and occipital regions.23 Parietal region injury might induce less marked pain sensitivity,14 and a clinical study suggested that occipital nerve field stimulation could not only treat migraine but also have a potential intervention effect on fibromyalgia.29 These data supported the notion that the parietal and occipital regions might have an important influence on pain perception. Painful stimuli might alter the cognitive and emotional status of humans.30 Studies have found that cognitive tasks, which increased or decreased subjects’ emotions by exposure to emotional pictures, could lead to increased gamma oscillations in the parietal region.31 The occipital region’s changes in the power of posterior neural oscillations in the gamma (40–100 Hz) band are associated with selective attention,15 which may imply competition between music and pain. Many studies have suggested that the gamma band is closely related to pain perception.9 Thus, these findings may reflect the underlying mechanism by which music interferes with pain.
Our results are similar to the aforementioned studies, which focused on high-frequency bands, such as beta-2 and gamma. Thus, the higher FFT amplitudes in the occipital and parietal regions may have also reflected the effects of music on cognitive and emotional states. The effects may eventually lead to analgesia, which can be derived from the correlation between EEG and behavioral data, namely, higher FFT amplitudes induced longer pain tolerance times. Higher amplitudes as well as the correlation with the behavioral data appeared only in the condition of listening to sad music. Studies have shown that humans often feel pleasure when they listen to sad music. The reason may be that sad music induces negative and positive feelings simultaneously.32 However, in our experiment, the nonremission group showed no difference between the two conditions. Researchers suggest that the result of having a pleasurable experience may be related to personality traits, social context and current mood; ie, it is related to individual characteristics.33 To explore the difference between the remission group and the nonremission group, we compared the FFT amplitudes between the two groups in the conditions of no sound (Pain) and listening to sad music (Pain+Sad music). The results showed that there was no difference in FFT amplitudes between the two groups in the condition of no sound (Pain). However, FFT amplitudes in the remission group at P4 electrodes in the gamma band were higher than those in the nonremission group in the condition of listening to sad music. Sad music is different from other types of music, and its features usually include a lower pitch, slower tempo and darker timbre.34 Although the dominant emotion of sad music is sadness, other feelings, such as peacefulness and nostalgia, are also important.35 It may appeal to people who have an intense response to it as well as to those who are more sensitive to the beauty of sad music.18 This result suggested that the difference between the two groups may be associated with the aesthetic value of sad music. The remission group may have had different experiences when they listened to sad music, which was related to their personality. Previous research has shown that extraversion is negatively related to the perceived intensity of pain,2 and extroverts were also less sensitive to pain.36 However, our study showed different results, which suggested that higher dominance (E), liveliness (F), and introvert and extrovert (X2) personality scores lead to lower pain tolerance. Personality plays an important role in music-induced emotions. According to the five-factor personality model, subjects who scored high in openness in experience and low in extroversion liked sad music.2,18 A study on sad music suggested that sad moods could promote an increase in a more detail-oriented and enhanced engagement with music.37 In other words, sad music enhanced the process and the behavioral immersion in the music of the remission group. Neuroimaging studies have also found some evidence that could support this opinion, such as negative information having a greater influence on evaluations in the brain than positive information.38,39 Parietal gamma activity during the task with increased emotions was greater than that in the task with decreased emotions.31 Thus, negative information processing induced by sad music may result in a more readily changed emotional state because subjects in the remission group may be more likely to be immersed in the music. Additionally, people with higher dominance (E), liveliness (F), and introvert and extrovert (X2) personality scores may have lower empathy for sad music than people with introverted personalities, and they cannot effectively divert attention from pain to other stimuli. Further research is needed to explore the relationships between personality and pain tolerance.
In summary, we suggest that the higher amplitude in the parietal region (P4) in the gamma band is related to changes in sad mood, and the amplitude in the occipital region (O2) in the gamma band is due to selective attention. Compared with happy and neutral music, sad music is more attractive for the remission group, and sad mood engages the subjects more, which leads to a better analgesic effect. In addition to the gamma band, the FFT amplitude in the occipital region was higher in the beta-2 band. Some pain-related studies have found that pain was specifically associated with an increase in beta activities,40,41 and beta activity has been demonstrated to reflect cognitive processes.42 Since the beta-2 band is close to the gamma band, we believe that the increase in FFT amplitude in the occipital region in these two bands may be based on a similar principle, namely, selective attention. Moreover, comparisons between the remission group and the nonremission group, as well as correlations between personality traits and FFT amplitudes, suggest that sad music can influence pain perception and that the effect may be related to the personality of subjects. Additionally, our results showed right lateralization. Previous studies have found that unilateral brain damage to the right hemisphere impaired the perception of negative moods.43 Thus, we inferred that it might be related to the dominance of the right hemisphere for negative moods.44,45
In the network analysis, we compared the coherence networks in the beta-2 and gamma bands between the remission group listening to music and no sound conditions. When the subjects listened to happy or neutral music, the coherence network showed a greater reduction in connections in both frequency bands compared with no sound. However, the coherence network showed a partial increase in connections, mainly in the prefrontal, parietal and occipital regions, when the remission group listened to sad music. This result suggested that sad music not only increased activity in the parietal and occipital regions but also led to increased functional connectivity. It has been demonstrated that the prefrontal cortex (PFC) is the basis of emotional regulation.46 In particular, the PFC plays an important role in the cognitive control of negative emotions.47 Activation in the parietal and occipital regions may have been associated with emotion and attention when the remission group listened to sad music. Thus, increased connectivity in the network that includes the PFC, parietal and occipital regions might be related to negative emotional processing and selective attention in this process. Cognitive and emotional processing may compete with pain perception and lead to a better effect of sad music on pain. However, the results were not corrected for FDR, and perhaps more subjects in future experiments will make this feature more apparent.
Limitations
There are some limitations in this work. First, pain was induced by cold stimulation, and although using a long stimulus is helpful for faithfully simulating clinical pain, other types of stimulation, such as tenderness, should also be considered. Second, adding the self-rated pain scale in the experimental task may have caused the subjects to consider rating the pain when they were listening to the stimuli, which would have distracted them and affected their pain perception. Thus, we divided the subjects into the remission group and the nonremission group based on the pain tolerance time. Although this is intuitive and objective, it may be better to use a subjective approach in the experiment. In addition, there was no difference in the personality trait scores between the remission group and the nonremission group, and the results of the network analysis were not corrected for FDR, which we think may be related to sample sizes; thus, larger sample sizes should be adopted in future studies.
Disclosure
The authors report no conflicts of interest for this work.
References
1. Hu L, Iannetti GD. Neural indicators of perceptual variability of pain across species. Proc Natl Acad Sci. 2019;116(5):1782–1791. doi:10.1073/pnas.1812499116
2. Ramírez-Maestre C, Martínez AEL, Zarazaga RE. Personality characteristics as differential variables of the pain experience. J Behav Med. 2004;27(2):147–165. doi:10.1023/b:jobm.0000019849.21524.70
3. Dobek CE, Beynon ME, Bosma RL, Stroman PW. Music modulation of pain perception and pain-related activity in the brain, brain stem, and spinal cord: a functional magnetic resonance imaging study. J Pain. 2014;15(10):1057–1068. doi:10.1016/j.jpain.2014.07.006
4. Warth M, Kessler J, van Kampen J, Ditzen B, Bardenheuer HJ. “Song of Life”: music therapy in terminally ill patients with cancer. BMJ Support Palliat Care. 2018;1–4. doi:10.1136/bmjspcare-2017-001475
5. Huang ST, Good M, Zauszniewski JA. The effectiveness of music in relieving pain in cancer patients: a randomized controlled trial. Int J Nurs Stud. 2010;47(11):1354–1362. doi:10.1016/j.ijnurstu.2010.03.008
6. Nilsson U. Soothing music can increase oxytocin levels during bed rest after open-heart surgery: a randomised control trial. J Clin Nurs. 2009;18(15):2153–2161. doi:10.1111/j.1365-2702.2008.02718.x
7. Garza-Villarreal EA, Jiang ZG, Vuust P, et al. Music reduces pain and increases resting state fMRI BOLD signal amplitude in the left angular gyrus in fibromyalgia patients. Front Psychol. 2015;6:1051. doi:10.3389/fpsyg.2015.01051
8. Pando-Naude V, Barrios FA, Alcauter S, et al. Functional connectivity of music-induced analgesia in fibromyalgia. Sci Rep. 2019;9:1. doi:10.1038/s41598-019-51990-4
9. Lu XJ, Thompson WF, Zhang LB, Hu L. Music reduces pain unpleasantness: evidence from an EEG study. J Pain Res. 2019;12:3331–3342. doi:10.2147/JPR.S212080
10. Peters ML. Emotional and cognitive influences on pain experience. Pain Psych Disord. 2015;30:138–152. doi:10.1159/000435938
11. Van Wijk AJ, Hoogstraten J. Anxiety and pain during dental injections. J Dent. 2009;37(9):700–704. doi:10.1016/j.jdent.2009.05.023
12. Johnson MH. How does distraction work in the management of pain? Curr Pain Headache Rep. 2005;9(2):90–95. doi:10.1007/s11916-005-0044-1
13. Chayadi E, McConnell BL. Gaining insights on the influence of attention, anxiety, and anticipation on pain perception. J Pain Res. 2019;12:851–864. doi:10.2147/jpr.s176889
14. Berlucchi G, Vallar G. The history of the neurophysiology and neurology of the parietal lobe. Handb Clin Neurol. 2018;151:3–30. doi:10.1016/B978-0-444-63622-5.00001-2
15. Marshall TR, den Boer S, Cools R, Jensen O, Fallon SJ, Zumer JM. Occipital alpha and gamma oscillations support complementary mechanisms for processing stimulus value associations. J Cogn Neurosci. 2018;30(1):119–129. doi:10.1162/jocn_a_01185
16. Putkinen V, Makkonen T, Eerola T. Music-induced positive mood broadens the scope of auditory attention. Soc Cogn Affect Neurosci. 2017;12(7):1159–1168. doi:10.1093/scan/nsx038
17. Garza-Villarreal EA, Wilson AD, Vase L, et al. Music reduces pain and increases functional mobility in fibromyalgia. Front Psychol. 2014;5:90. doi:10.3389/fpsyg.2014.00090
18. Vuoskoski JK, Thompson WF, McIlwain D, Eerola T. Who enjoys listening to sad music and why? Music Percept. 2012;29(3):311–317. doi:10.1525/mp.2012.29.3.311
19. Zhao HX, Andrew CN, Happy B. Sad melodies modulate tonic human heat pain. J Pain. 2009;10(9):953–960. doi:10.1016/j.jpain.2009.03.006
20. Li DD, Cheng ZB, Dai RN, Wang F, Huang YX. Preliminary establishment and assessment of affective music system. Chin Mental Health J. 2012;26:552–556.
21. Bolton B. Discriminant analysis of Holland’s occupational types using the sixteen personality factor questionnaire. J Vocat Behav. 1985;27(2):210–217. doi:10.1016/0001-8791(85)90034-x
22. Yan LR, Wang Y, Ding CH, Liu MT, Yan FW, Guo KH. Correlation among behavior, personality, and electroencephalography revealed by a simulated driving experiment. Front Psychol. 2019;10:1524. doi:10.3389/fpsyg.2019.01524
23. Chang PF, Arendt-Nielsen L, Chen ACN. Differential cerebral responses to aversive auditory arousal versus muscle pain: specific EEG patterns are associated with human pain processing. Exp Brain Res. 2002;147(3):387–393. doi:10.1007/s00221-002-1272-9
24. Si YJ, Li FL, Duan KY, et al. Predicting individual decision-making responses based on single-trial EEG. NeuroImage. 2019;206:116333. doi:10.1016/j.neuroimage.2019.116333
25. Yao DZ. A method to standardize a reference of scalp EEG recordings to a point at infinity. Physiol Meas. 2001;22(4):693–711. doi:10.1088/0967-3334/22/4/305
26. Dong L, Li FL, Liu Q, et al. MATLAB Toolboxes for Reference Electrode Standardization Technique (REST) of scalp EEG. Front Neurosci. 2017;11:601. doi:10.3389/fnins.2017.00601
27. Lunde SJ, Vuust P, Garza-Villarreal EA, Vase L. Music-induced analgesia: how does music relieve pain? Pain. 2018;160(5):989–993. doi:10.1097/j.pain.0000000000001452
28. Garcia-Larrea L. The posterior insular-opercular region and the search of a primary cortex for pain. Neurophysiologie Clinique/Clinical Neurophysiology. 2012;42(5):299–313. doi:10.1016/j.neucli.2012.06.001
29. Ahmed S, Plazier M, Ost J, et al. The effect of occipital nerve field stimulation on the descending pain pathway in patients with fibromyalgia: a water PET and EEG imaging study. BMC Neurol. 2018;18:191. doi:10.1186/s12883-018-1190-5
30. Villemure C, Bushnell CM. Cognitive modulation of pain: how do attention and emotion influence pain processing? Pain. 2002;95(3):195–199. doi:10.1016/s0304-3959(02)00007-6
31. Kang JH, Ahn HM, Jeong JW, et al. The modulation of parietal gamma oscillations in the human electroencephalogram with cognitive reappraisal. NeuroReport. 2012;23(17):995–999. doi:10.1097/wnr.0b013e32835a6475
32. Juslin PN. From everyday emotions to aesthetic emotions: towards a unified theory of musical emotions. Phys Life Rev. 2013;10(3):235–266. doi:10.1016/j.plrev.2013.05.008
33. Sachs ME, Damasio A, Habibi A. The pleasures of sad music: a systematic review. Front Hum Neurosci. 2015;9:404. doi:10.3389/fnhum.2015.00404
34. Juslin PN, Petri L. Expression, perception, and induction of musical emotions: a review and a questionnaire study of everyday listening. J New Music Res. 2004;33(3):217–238. doi:10.1080/0929821042000317813
35. Zentner M, Grandjean D, Scherer KR. Emotions evoked by the sound of music: characterization, classification, and measurement. Emotion. 2008;8(4):494–521. doi:10.1037/1528-3542.8.4.494
36. Haier RJ, Robinson DL, Braden W, Williams D. Evoked potential augmenting-reducing and personality differences. Pers Individ Dif. 1984;5(3):293–301. doi:10.1016/0191-8869(84)90068-0
37. Sizer L. Sad songs say so much: the paradoxical pleasures of sad music. J Aesth Art Crit. 2019;77(3):255–266. doi:10.1111/jaac.12659
38. Ito TA, Larsen JT, Smith NK, Cacioppo JT. Negative information weighs more heavily on the brain: the negativity bias in evaluative categorizations. J Pers Soc Psychol. 1998;75(4):887–900. doi:10.1037/0022-3514.75.4.887
39. Carretié L, Mercado F, Tapia M, Hinojosa JA. Emotion, attention, and the “negativity bias”, studied through event-related potentials. Int J Psychophysiol. 2001;41(1):75. doi:10.1016/s0167-8760(00)00195-1
40. Jensen MP, Hakimian S, Sherlin LH, Fregni F. New insights into neuromodulatory approaches for the treatment of pain. J Pain. 2008;9(3):193–199. doi:10.1016/j.jpain.2007.11.003
41. Chang PF, Arendt-Nielsen L, Graven-Nielsen T, Svensson P, Chen ACN. Different EEG topographic effects of painful and non-painful intramuscular stimulation in man. Exp Brain Res. 2001;141(2):195–203. doi:10.1007/s002210100864
42. Wexler BE, Warrenburg S, Schwartz GE, Janer LD. EEG and EMG responses to emotion-evoking stimuli processed without conscious awareness. Neuropsychologia. 1992;30(12):1065–1079. doi:10.1016/0028-3932(92)90099-8
43. Mandal MK, Tandon SC, Asthana HS. Right brain damage impairs recognition of negative emotions. Cortex. 1991;27(2):247–253. doi:10.1016/s0010-9452(13)80129-3
44. Killgore WDS, Yurgelun-Todd DA. The right-hemisphere and valence hypotheses: could they both be right (and sometimes left)? Social Cognit Affective Neurosci. 2007;2(3):240–250. doi:10.1093/scan/nsm020
45. Rodway P, Wright L, Hardie S. The valence-specific laterality effect in free viewing conditions: the influence of sex, handedness, and response bias. Brain Cognition. 2003;53(3):452–463. doi:10.1016/S0278-2626(03)00217-3
46. Kaya S, McCabe C. What role does the prefrontal cortex play in the processing of negative and positive stimuli in adolescent depression? Brain Sci. 2019;9(5):104. doi:10.3390/brainsci9050104
47. Compare A, Brugnera A, Adorni R, Sakatani K. Effects of positive and negative mood induction on the prefrontal cortex activity measured by near infrared spectroscopy. Adv Exp Med Biol. 2016;923:151–157. doi:10.1007/978-3-319-38810-6_20
 © 2020 The Author(s). This work is published and licensed by Dove Medical Press Limited. The
full terms of this license are available at https://www.dovepress.com/terms
and incorporate the Creative Commons Attribution
- Non Commercial (unported, 3.0) License.
By accessing the work you hereby accept the Terms. Non-commercial uses of the work are permitted
without any further permission from Dove Medical Press Limited, provided the work is properly
attributed. For permission for commercial use of this work, please see paragraphs 4.2 and 5 of our Terms.
© 2020 The Author(s). This work is published and licensed by Dove Medical Press Limited. The
full terms of this license are available at https://www.dovepress.com/terms
and incorporate the Creative Commons Attribution
- Non Commercial (unported, 3.0) License.
By accessing the work you hereby accept the Terms. Non-commercial uses of the work are permitted
without any further permission from Dove Medical Press Limited, provided the work is properly
attributed. For permission for commercial use of this work, please see paragraphs 4.2 and 5 of our Terms.