Back to Journals » International Journal of Nanomedicine » Volume 18
ROS Generative Black Phosphorus-Tamoxifen Nanosheets for Targeted Endocrine-Sonodynamic Synergistic Breast Cancer Therapy
Authors Wang J, Chen W, Du W, Zhang H, Ilmer M ![]() , Song L, Hu Y, Ma X
, Song L, Hu Y, Ma X
Received 16 February 2023
Accepted for publication 28 April 2023
Published 9 May 2023 Volume 2023:18 Pages 2389—2409
DOI https://doi.org/10.2147/IJN.S406627
Checked for plagiarism Yes
Review by Single anonymous peer review
Peer reviewer comments 2
Editor who approved publication: Dr Yan Shen
Jing Wang,1,* Weijian Chen,1,2,* Wenxiang Du,2 Hongjie Zhang,2 Matthias Ilmer,3 Lei Song,2 Yuan Hu,2 Xiaopeng Ma1
1Department of General Surgery, The First Affiliated Hospital of USTC, Division of Life Sciences and Medicine, University of Science and Technology of China, Hefei, Anhui, 230001, People’s Republic of China; 2State Key Laboratory of Fire Science, University of Science and Technology of China, Hefei, Anhui, 230026, People’s Republic of China; 3Department of General, Visceral, and Transplantation Surgery, Ludwig-Maximilians-University (LMU), Campus Grosshadern, Munich, 81377, Germany
*These authors contributed equally to this work
Correspondence: Yuan Hu; Xiaopeng Ma, Email [email protected]; [email protected]
Introduction: Tamoxifen (TAM) has proven to be a therapeutic breakthrough to reduce mortality and recurrence in estrogen receptor-positive (ER+) breast cancer patients. However, the application of TAM exhibits low bioavailability, off-target toxicity, instinct and acquired TAM resistance.
Methods: We utilized black phosphorus (BP) as a drug carrier and sonosensitizer, integrated with TAM and tumor-targeting ligand folic acid (FA) to construct TAM@BP-FA for synergistic endocrine and sonodynamic therapy (SDT) of breast cancer. The exfoliated BP nanosheets were modified through in situ polymerization of dopamine, followed by electrostatic adsorption of TAM and FA. The anticancer effect of TAM@BP-FA was evaluated through in vitro cytotoxicity and in vivo antitumor model. RNA-sequencing (RNA-seq), quantitative real-time PCR, Western blot analysis, flow cytometry analysis and peripheral blood mononuclear cells (PBMCs) analysis were performed for mechanism investigation.
Results: TAM@BP-FA had satisfactory drug loading capacity, the TAM release behavior can be controlled through pH microenvironment and ultrasonic stimulation. An amount of hydroxyl radical (∙OH) and singlet oxygen (1O2) were as expected generated under ultrasound stimulation. TAM@BP-FA nanoplatform showed excellent internalization in both TAM-sensitive MCF7 and TAM-resistant (TMR) cells. Using TMR cells, TAM@BP-FA displayed significantly enhanced antitumor ability in comparison with TAM (7.7% vs 69.6% viability at 5μg/mL), the additional SDT further caused 15% more cell death. RNA-seq unraveled the TAM@BP-FA antitumor mechanisms including effects on cell cycle, apoptosis and cell proliferation. Further analysis showed additional SDT successfully triggering reactive oxygen species (ROS) generation and mitochondrial membrane potential (MMP) reduction. Moreover, PBMCs exposed to TAM@BP-FA induced an antitumor immune response by natural killer (NK) cell upregulation and immunosuppression macrophage reduction.
Conclusion: The novel BP-based strategy not only delivers TAM specifically to tumor cells but also exhibits satisfactory antitumor effects through targeted therapy, SDT, and immune cell modulation. The nanoplatform may provide a superior synergistic strategy for breast cancer therapy.
Keywords: black phosphorus, breast cancer, sonodynamic therapy, tamoxifen, PBMC, combination therapy
Introduction
Breast cancer is the most common cancer in women and accounts for 30% of all newly diagnosed cancers.1 Approximately 70% of breast cancers are classified as estrogen receptor (ER+);2 therefore, endocrine/hormonal target therapies that block endogenous estrogen have shown to reduce the risks of recurrence and death in breast cancer patients. The first clinical endocrine therapy, tamoxifen (TAM), which competes with estrogen to block estrogen signaling pathway, is considered as the standard first-line endocrine therapy, particularly in premenopausal women.3,4 However, oral TAM therapy faces problems including poor bioavailability and rapid clearance. What is more, long-term administration exerts undesirable toxicity and carcinogenic effects,5 including a risk of developing venous thromboembolism6 and secondary cancers,7,8 injuries to the central nervous system,9 negative impacts on bone growth. Moreover, approximately 20–30% of patients eventually acquire resistance during or after treatment,10 which cause a major hurdle for TAM clinical benefits. Therefore, it is essential to improve TAM therapeutic applications by strategies including increasing target specificity, improving therapeutic pharmacokinetics and reducing dose-dependent toxicity.
Nanomaterials have been applied in the field of cancer research by providing strategies to achieve desired drug accumulation in tumors and minimize side effects on normal cells. Black phosphorus (BP) has demonstrated great potential in biomedical applications due to its good biocompatibility and unique inherent properties. BP degradation products include hypophosphite and phosphate ions, which serve as physiological buffering agents.11 Due to the intense intracellular oxidative stress and altered energy metabolism rates in cancer cells, BP may exhibit distinct degradation behavior in cancer cells in comparison with normal cells.12,13 Increased phosphate anion levels in the cytoplasm could affect cell fate by modifying ATP hydrolysis,14 programmed cell death15 and cancer cell proliferation.16 With the unique structure and physicochemical properties, BP has exceptional performance in photothermal conversion and electron transfer during photothermal/photodynamic/sonodynamic processes.17–19 Apart from their application as delivery platform or therapeutic agents, BP nanoparticles have the potential to trigger inflammatory response.20 To address the relevant question of cross-species, this is the first time to our knowledge to employ human peripheral blood mononuclear cells (PBMCs) for potential immunomodulatory mechanism investigation.
Reactive oxygen species (ROS)-based nanotechnology is a promising strategy by targeting ROS metabolic processes, ultimately lead to tumor cell death. A variety of methods have shown to elevate ROS production, such as photodynamic therapy (PDT), sonodynamic therapy (SDT), chemodynamic therapy (CDT), or delivery chemicals directly into cells. Nowadays, many progresses have been made to improve therapeutic outcomes. A recent study developed dual-sensitive polymeric micelle incorporated with photosensitizer for immunogenic cell death induction and PD-L1 antibody for anti-cancer immunity improvement.21 Likewise, co-delivery of the sonosensitiser and PD-L1 antibody to a lipid-based micellar nanocarrier successfully achieved a synergistic immuno-sonodynamic therapy.22 On the other hand, as most of intracellular ROS is produced in the mitochondria, many recent researches have focused on mitochondrial modulation by siRNA-mediated to selectively amplify ROS generation in cancer cell, provided a novel way for precise cancer therapy.23,24
Herein, we designed a TAM@BP-FA delivery platform integrated BP with TAM and folic acid (FA) receptors which overexpress on the membranes of various tumor cells.25 TAM@BP-FA nanocomposites rapidly internalized into breast cancer cells, exhibited distinct cytotoxicity in both TAM-sensitive and TAM-resistant cells. RNA-seq illustrated the underlying mechanisms, including cell cycle arrest, inhibition of cell proliferation, and apoptosis induction. In addition, the combined SDT treatment caused reactive oxygen species (ROS) generation as well as mitochondrial membrane potential (MMP) reduction to induce mitochondrial damage, leading to further cancer cell elimination without notable off-target toxicity. Additionally, we employed PBMCs from patients to evaluate the effect of nano-TAM nanocomposites on ex vivo immune cell regulation. TAM@BP-FA promoted nature killer (NK) cell infiltration and immunosuppression by macrophage depletion to potentially activate antitumor immune responses. The integration of TAM into the BP-based nanoparticles (BPNPs), combined with SDT, exhibits strong therapeutic effects in both TAM-sensitive and TAM-resistant cells, providing a potential synergistic strategy for breast cancer therapy (Scheme 1).
 |
Scheme 1 (A) Preparation of the designed nanocomposites and (B) tumor accumulation after intravenous injection of nanocomposites. (C) Synergistic sonodynamic/hormone therapy, molecule mechanisms and potentiating affection on immune cells. |
Materials and Methods
Materials
Indocyanine green (ICG), dopamine hydrochloride, PEG-FA and PEG polymers (Mw 2000) were purchased from Aladdin Reagent Co. Ltd. (Shanghai, China). Tamoxifen (TAM) was purchased from Sigma-Aldrich Co. (Missouri, USA). Bulk black phosphorus (BP) nanosheets were synthesized and exfoliated as described in the literature.26 RPMI-1640 and fetal bovine serum (FBS) were obtained from Gibco (New York, USA). Cell counting kit-8 (CCK-8), fluorescein diacetate (FDA), 4’,6-diamidino-2-phenylindole (DAPI), TRIzol reagent, cell cycle and apoptosis analysis kit, BCA assay kit, calcein/PI assay kit, 2’,7’-dichlorofluorescin diacetate (DCFH-DA, ROS probe), and mitochondrial membrane potential assay kit with JC-1 were purchased from Beyotime Institute of Biotechnology (Shanghai, China). MCF7 cells were from Prof. Zhu in our institution with cell-line authentication report. The cDNA synthesis kit and SYBR Green Master Mix were obtained from Vazyme Biotech Co., Ltd. (Nanjing, China). The nitrocellulose blotting membrane and Amersham ECL Western Blotting Detection System were purchased from GE Healthcare Life Sciences (Pittsburgh, USA). The primary antibodies against cleaved caspase 3, cyclin D1, and tubulin were from Bimake (Houston, USA), Bcl2 and Bax were obtained from Cell Signaling Technology (Frankfurt am Main, Germany), goat anti-rabbit IgG-HRP was obtained from Absin Bioscience Inc. (Shanghai, China). α-Tubulin Rabbit Recombinant mAb (Cat.No: A5032), Cyclin D1 Rabbit Recombinant mAb (Cat.No: A5035), Caspase-3 p12 Rabbit Recombinant mAb (Cat.No: A5357) were bought from Biomake Co. Ltd. Female BALB/c nude mice (5 weeks old) were purchased from Vital River Laboratory Animal Technology Co. Ltd. (Beijing, China). Matrigel was obtained from BD Biosciences (California, USA). 17β-estradiol was purchased from Innovative Research of America (Florida, USA). All other reagents are commercially available.
Synthesis and Characterization
TAM@BP-FA was prepared by a modified synthesis method. First, BP nanosheets (24 mg) and TAM (48 mg) were ultrasonically dispersed in ethanol (24 mL), followed by the addition of sodium hydroxide (20 mg/mL, 0.2 mL). The mixture was stirred for 4 h at room temperature and then purified via three rounds of centrifugation (7000 rpm, 10 min) to remove free TAM and salt. Then, the precipitate was dispersed in ethanol (20 mL), followed by the addition of sodium hydroxide (20 mg/mL, 0.5 mL) and dopamine hydrochloride (150 mg/mL, 0.2 mL). The mixture was stirred slowly overnight. Finally, the final product TAM@BP was purified through three rounds of centrifugation (5000 rpm, 10 min) and dispersed into ultrapure water to remove unencapsulated polymeric PDA. The harvested TAM@BP-PDA was ultrasonically dispersed into ultrapure water (20 mL), followed by the addition of FA-PEG-NH2 (4 mg/mL, 5 mL). Then, the mixture was shaken (120 rpm) at 37°C overnight, followed by freeze-drying to harvest TAM@BP-FA. The dried TAM@BP-FA was dissolved and then quantified using a UV-vis spectrophotometer (Hitachi). TAM@BP-PEG without FA was prepared simultaneously by replacing FA-PEG-NH2 with PEG-NH2.
Drug Loading Capacity Evaluation and in vitro Release Behavior
For evaluation of the in vitro drug loading capacity, groups with various primary mass ratios of TAM/BP (0.25, 0.5, 1.0, 2.0, and 4.0) were prepared. The preparation method was consistent with that of TAM@BP-FA. Quantitative analysis was performed with reference to a standard curve of TAM through UV-vis spectroscopy. Loading capacity (LC) and loading efficiency (LE) are defined and calculated according to the following equations.27–29
LC = Wloading TAM / WBP x 100%
LE = Wloading TAM/ Wfed / x 100%
Where Wloading TAM is TAM mass of nanosystem after loading; WBP is BP mass of nanosystem after loading; Wfed is the initial mass of fed TAM.
Similarly, vious groups were designed to study in vitro TAM release. In brief, the harvested TAM@BP-FA (5 mg) was transferred into dialysis bags (MWCO 3500 Da) containing PBS (1 mL, pH 7.4 or pH 5.6). Then, the dialysis bags were immersed in PBS (24 mL, pH 7.4 or pH 5.6), followed by slow stirring at room temperature. At predetermined intervals (0, 1, 2, 4, 6, 12, 24, 36, and 48 h), 1 mL of dialysis medium was collected and replaced with an equal amount of fresh medium. The collected 1 mL of medium was freeze-dried, then redissolved in ethanol (0.7 mL) and the absorption intensity was subsequently measured using a Hitachi 3600 UV-vis spectrophotometer (Hitachi). Simultaneously, TAM release in PBS (24 mL, pH 5.6) treated with ultrasound (1.5 W/cm2, 10 min) was also recorded at predetermined timepoints (0 h, 1, 2, 4, 6, 6.16, 12, 12.16, 24, 24.16, 36, 36.16, 48, and 48.16 h) for detection of the absorption intensity.
In vitro Sonodynamic Capacity
The sonodynamic ability of BP-FA was determined by measuring ROS production using a specific probe.30,31 In brief, 4 mL of solution containing 100 μg/mL BP-FA and 20 μg/mL ABDA as the single oxygen (1O2) probe or 50 μg/mL PTA as the hydroxyl radical probe was ultrasonicated at various conditions (0, 0.75, 1.0, 1.5, 2.0, 2.25, 2.5 W/cm2) for 3 min. The fluorescence intensity at specific wavelengths (ie, 408 nm for ABDA and 421 nm for PTA) were recorded at predetermined time points (0, 0.5, 1, 1.5, 2, 2.5, and 3 min) and then the corresponding F/F0 at specific wavelength was quantified for comparing. In addition, the corresponding fluorescence intensity of various materials (ie, PBS, PDA, BP-PEG and BP-FA) with the same concentrations (ie, 100 μg/mL) was measured with an FP-9600 instrument (Hitachi) at predetermined time points (0, 0.5, 1, 1.5, 2, 2.5 and 3 min). The corresponding F/F0 was quantified for comparing. To detect the fluorescence intensity of ABDA, the excitation wavelength was 380 nm, and emission wavelengths from 400 nm to 600 nm were collected. Simultaneously, to detect the fluorescence intensity of PTA, the excitation wavelength was 315 nm, and emission wavelengths from 350 nm to 600 nm were collected.
Cell Culture
MCF7 cells were maintained in RPMI 1640 medium containing 10% FBS and a 1% penicillin/streptomycin mixture in a humidified incubator at 37°C with 5% CO2. MCF7 TAM-resistant cells (TMR) were constructed by culturing parental cell lines with gradually increasing concentrations of TAM and then kept at 5 μg/mL TAM for at least three months. For TAM treatment, cells were precultured in phenol red-free RPMI 1640 with 10% hormone-deprived serum for one week.
Cellular Uptake of Nanocomposites
Cells were cultivated on cover slips in 6-well plates overnight, and the medium was changed to fresh medium containing rhodamine 6G labeled TAM@BP-FA and TAM@BP for various durations (0 h, 0.5 h, 1 h, 2 h, and 4 h). Then, the cells were washed with PBS three times and stained with DAPI for 10 min. The cellular uptake was examined by confocal laser scanning microscopy (ZEISS710).
Cell Cytotoxicity Assay
Cells were seeded in 96-well plates and incubated overnight. The medium was changed on the following day, and an increased concentration of either free TAM or TAM@BP-FA (1.25, 2.5, 5, or 10 μg/mL) was added; the cells were then incubated for 24 h. For nanocarrier toxicity assessment, BP-FA was added at 12.5, 25, 50, or 100 μg/mL for 24 h. For SDT, cells were treated with TAM@BP-FA at 1.25, 2.5, 5, or 10 μg/mL for 3 h and then subjected to ultrasound irradiation (1.0MHz, 1.5 W/cm2, 10 min). Cell viability was calculated after continuous culture for 24 h. Untreated cells were used as a control. CCK8 was used to measure the number of viable cells. The medium was changed again, and 10 μL of CCK-8 in 100 μL fresh medium was added. Afterwards, the cells were incubated for another 1–2 h at 37°C. The absorbance at 450 nm and reference at 650 nm were measured by a plate reader.
RNA-Seq and Bioinformatic Analysis
Total RNA was extracted using TRIzol reagent, and paired-end libraries were synthesized using the TruSeq RNA Sample Preparation Kit (Illumina) according to the manual. Library construction and sequencing were performed by Sinotech Genomics Co., Ltd. (Shanghai, China). Gene expression was analyzed by the R package edgeR, and differentially expressed genes were identified with a cutoff of | log2 (FoldChange) | >1.0 and q <0.05. Kyoto Encyclopedia of Genes and Genomes (KEGG) enrichment pathway analyses were used to further analyze the differential gene expression and the involved pathways.
Quantitative Real-Time PCR
Total RNA was isolated via TRIzol reagent, and complementary DNA (cDNA) was reverse-transcribed using the cDNA Synthesis Kit according to the manufacturer’s instructions. Real-time PCR was performed using SYBR Green Master Mix. The primers used are listed in Table S1.
Western Blot Analysis
Total protein was extracted using RIPA lysis buffer and quantified with a BCA assay kit. Equal amounts from all samples were separated by SDS-PAGE and transferred onto nitrocellulose membranes. Afterwards, the membranes were probed with primary specific antibodies overnight at 4°C and then incubated with secondary antibodies. An Amersham ECL reaction system was used to evaluate protein band intensities. Tubulin was used as a loading control.
Cell Cycle Analysis
Cells were cocultured with 5 μg/mL free TAM or TAM@BP-FA for 48 h. Cells were collected and then fixed with 70% (v/v) precooled ethanol at 4°C for 24 h. Afterwards, the cells were washed with PBS and stained with propidium iodide (1X) containing RNase A (1X) for 30 min at room temperature. Flow cytometry analysis was performed on a BD Fortessa flow cytometer.
Clonogenic Survival Assay
A total of 1000 MCF7 or TMR cells were seeded in triplicate into 6-cell plates and incubated for 14 days. After incubation, the cells were washed briefly with PBS and fixed with 4% paraformaldehyde for 20 min. Afterwards, the cells were stained with 0.5% crystal violet for 10 min and washed again. Clusters with 50 cells or more were counted as colonies.
Live/Dead Staining and Detection of Intracellular ROS and MMP
Cells were precultured on a 6-well plate and incubated overnight. The medium was discarded, and new medium containing BP-FA and TAM@BP-FA (5 μg/mL) was added. After incubation for 3 h, the cells were subjected to US irradiation (1.0 MHz, 1.5 W/cm2, 10 min, 50% duty cycle) in a specially designed tank. After US treatment, the medium was exchanged, and the cells were washed. For live/dead staining, cells were stained with calcein-AM and PI according to the manufacturer’s instructions. For intracellular ROS detection, cells were cocultured with DCFH-DA (10 μM) for 30 min in the dark. For MMP, cells were stained with JC-1 working solution according to the manufacturer’s instructions. Afterwards, the cells were washed to remove excess dye, and fluorescence images were recorded through a fluorescence microscope (NIB610-FL).
Isolation of PBMCs
Peripheral blood samples from ER+ breast cancer patients were collected to EDTA-tubes. PBMCs were isolated using Ficoll-Paque density gradient protocol. Briefly, blood samples were diluted 1:1 with PBS, tubes were centrifuged 30 min at 450×g at 20 °C to separate the PBMC layer. PBMC layer was collected into a fresh tube, a final volume of 15 mL PBS was added before cells were centrifuged 10 min at 300×g. After a second washing step, cells were suspended in RPMI 1640 for subsequent proceedings.
PBMCs Stimulation
For stimulations, TMR cells were treated with PBS, BP, TAM, TAM@BP-FA for 24h, respectively. The medium from the above treatment was collected and filtered with 0.22μm filter unit. PBMCs from each donor were resuspended in above collected culture medium for 48 h at 37° C in 5% CO2 on Ultra-Low attachment surface-plates (Corning, Costar).
Flow Cytometry Analysis of PBMCs
PBMCs from above stimulation were collected and washed with PBS for twice. The cells were then treated with blocker and incubated on ice for 15 min. Samples were stained with antibodies and incubated in the dark at 4°C for 20 min. Afterwards, cells were washed with PBS and then centrifuged again. After centrifugation, the cells were re-suspended with PBS and ready for FACS analysis. The antibodies were used as follows: APC-750-CD45, PC7-CD11b, PE-CY5-HLA-DR, APC-CD11C, FITC-CD206, PE-CD80, PC7-CD19, BV510-CD56, APC-CD3, FITC-CD4, PE-CD8 (BioLegend, San Diego, CA.).
In vivo Distribution and Antitumor Effect
Briefly, 2×10⁶ TMR cells mixed 1:1 with Matrigel were injected into the right flank of the mice. A slow-release pellet containing 17β-estradiol was subcutaneously implanted into the back of each mouse. TMR-bearing BALB/c nude mice were intravenously injected with various nanomaterials containing PBS, indocyanine green (ICG) or ICG@BP-FA. Then, in vivo fluorescence imaging at predetermined times (ie, 0, 1, 2, 6, 12, 24, 36, 48, 72 h) was recorded through the living imaging system (IVIS Spectrum) to determine the optimal treatment time after anesthesia with isoflurane. After 72 h, the mice were sacrificed, the main organs were collected, and the ex vivo distribution was quantitatively compared.
Similarly, TMR-bearing BALB/c nude mice were prepared to evaluate the antitumor effects. Specifically, tumor growth profiles were constructed by recording the tumor volume. The tumor volume (V) was calculated every 2 days according to the following equation: V = (L x W2)/2, where L and W are the longest and shortest dimension of the tumor, respectively. When the tumor volume reached almost 50 mm3, the mice were randomly divided into 7 groups and treated with a variety of nanomaterials with or without ultrasound to evaluate the antitumor efficacy of the treatments. Subsequently, various nanomaterials (PBS; TAM; BP+US; BP-FA+US; TAM@BP+US; TAM@BP-FA; TAM@BP-FA+US) were intravenously injected at a mass-equivalent dose of 10 mg/kg on day 0. The ultrasound time was 3 min at a density of 1.5 W/cm2 at 6 h post injection for each group. The body weights and tumor sizes were recorded every two days. At 14 days post administration, the mice were sacrificed, and the tumors and major organs were collected for H&E and Ki67 staining, which was conducted at Aike Biological Technology Co., Ltd. The resulting images were collected using fluorescence microscopy. The experimental protocol was approved by the University of Science and Technology of China (USTCACUC202301002). All animal experiments followed the Regulations for the Administration of Affairs Concerning Experimental Animals (Hefei, China).
Statistical Analysis
GraphPad Prism was used for statistical analysis. All experiments were repeated at least 3 times. Differences were analyzed using unpaired Student’s t-tests, and P < 0.05 was considered statistically significant. *p < 0.05, **p < 0.01, ***p < 0.001, and ****p < 0.0001.
Results
Synthesis and Characterization of TAM@BP-FA Nanocarriers
Through the gas phase transfer method, bulk BP was harvested. To successfully exfoliate bulk BP, nitrogen was charged into N-methylpyrrolidone (NMP) to remove dissolved oxygen. After exfoliation, BP-NPs were prepared, and TEM imaging showed that the diameter of the NPs was 168±72 nm (Figure S1). The TAM loading BP-FA was 423±65 nm, as shown in Figure 1A, displaying an obvious interface between the BP and the polymeric shell. Moreover, as shown in Figure 1A and Figure S2A, the hydrodynamic diameter of BP nanosheets was 195.8±2.6 nm, which has low polydispersity index (PDI=0.135). After TAM loading, PDA growth and PEG-FA encapsulation, the hydrodynamic diameter became larger and the hydrodynamic diameters of TAM@BP-PDA and TAM@BP-FA were 573.44±96.2 nm and 583.01±85.3 nm, respectively. Obviously, the PDI of TAM@BP-PDA and TAM@BP-FA reached up to 0.243 and 0.285, respectively, mainly ascribing to in situ PDA growth and the existence of PEG and FA corona. In addition, Fourier transform infrared (FTIR) technology was used to further characterize materials in Figure 1B, absorption peaks were observed at 1520, 1617, and 3423 cm−1; these peaks can be ascribed to the shearing vibration of N–H in the amide group, aromatic rings and –OH in catechol groups, respectively. For TAM, the absorption peaks at 699, 1038, 1242 and 1605 cm−1 correspond to monosubstituted aromatic benzene, C-N stretching vibration, N-H stretching vibration and aromatic vibration, respectively.32 For nanocomposites, specific peaks of composites appeared except for that of N-H at 1605 cm−1, mainly due to electrostatic interactions between TAM and BP. The absorbance in Figure 1C confirmed the existence of TAM. Meanwhile, the (0 2 0), (0 2 1), (0 4 0) and (0 6 0) lattice planes of BP were observed in the nanocomposites (Figure 1D), which indicated that the structure of the host BP crystal was not altered. In particular, the appearance of the characteristic diffraction peak at 35.1° corresponding to the (1 1 1) crystal plane confirmed that the bulk BP was successfully exfoliated into few-layered nanosheets.
 |
Figure 1 Synthesis and characterization of TAM@BP-FA nanocarriers. (A) TEM of TAM@BP-FA nanocomposites. (B) Fourier transform infrared spectroscopy (FTIR) of various nanomaterials. (C) UV-vis absorption of various nanomaterials. (D) X-ray powder diffraction (XRD) and (E) Raman spectra of bulk BP, BP and BP-PDA. (F–I) XPS survey spectra of TAM@BP-FA, high-resolution C 1s spectra, and high-resolution P 2p XPS spectra, high-resolution O 1s XPS spectra of TAM@BP-FA respectively. |
Similarly, as shown in Figure 1E, three Raman vibration modes located at 360.4, 437.1 and 465.4 cm−1 were observed, ascribed to the A1 g, B2g and A2 g modes, respectively. These modes are shifted slightly toward higher wavenumbers (by approximately 2–3 cm−1) compared with those observed for bulk BP due to the ultrathin thickness of the material, as reported in previous reports,17,33 which showed that the bulk material was successfully exfoliated into few-layered BP nanosheets. After drug loading, XPS survey spectra is shown in Figure 1F, XPS spectra of C1s, P2p, O1s appeared at special location, respectively. In detail, characteristic peaks (ie, P02p) in the high-resolution P2p spectra indicate the presence of the BP structure (Figure 1H). In addition, the characteristic absorption peaks attributed to C-N bonds can be found in the high-resolution C1s (Figure 1G) spectra; these were attributed to the presence of C-N bonds in polymeric PDA. The results indicated the successful loading of TAM on the surface of BP nanosheets as well as the presence of the PDA coating. As shown in Figure 1I, the high-resolution O1s spectra exhibited typical peaks C-O, O-P-O and O-P=O, indicating the presence of PEG and POx. The appearance of the weak peak assigned to the POx bond indicated that BP was slightly oxidized. However, this slight oxidation had no obvious influence on the physicochemical properties of BP. In addition, after modification by FA, the zeta potential increased from −3.5±0.36 mV, as shown in Figure S2, indicating that the targeting group was modified on the surface of the nanocomposites.
In vitro Drug Loading and Release Behavior
As shown in Figure 2A, a variety of mass ratios were prepared to evaluate the drug loading capacity of BP through the standard curve in Figure S3. The results indicated that the relative mass ratio of the constructed nanocomposites could reach up to 105% when the primary mass ratio of TAM/BP was 4:1, which was ascribed to the electrostatic interaction between TAM and BP (Table S2). However, the drug loading efficiency decreased from 43.6% to 26.4% as the primary ratio increased, owing to the limited loading surface of BP and electrostatic interaction.34 However, compared with those of micelles and vesicles, the drug loading capacity and drug loading efficiency show satisfactory results. BP is a superior alternative for drug delivery in terms of drug loading capacity. The cumulative drug release behavior at various pH values was also studied, as shown in Figure 2B. The total TAM release reached to 37.13% at pH 7.4 without ultrasonic treatment, this result indicated that some of TAM could escape from the gap of PDA. In comparison, the cumulative TAM release reached 57.9% at pH 5.6 with ultrasonic treatment, benefiting from electrostatic interactions between TAM and BP at the micro acid environment. Excitingly, at pH 5.6, the drug release behavior was enhanced after treatment with ultrasound. After five times of treatment with ultrasonic treatments, the cumulative TAM release reached up to 63.7%, an increase of 5% compared with the release at pH 5.6 without ultrasound. However, the cumulative TAM release at pH 5.6 with ultrasonic treatment increased over 21.1% compared with that at pH 7.4 with ultrasonic treatment. Specifically, significant oxidation occurred after ultrasonic treatment as shown in Figure S1B, which could contribute to further degradation and drug release. In short, ultrasound disturbs the balanced interaction between TAM and BP. These satisfactory results inspired us to further research the antitumor effects and mechanisms of the material.
 |
Figure 2 In vitro drug release behavior. (A) Drug loading capacity and loading efficiency evaluation and (B) TAM release after treatment with ultrasound (1.5 W/cm2, 3 min). |
In vitro Sonodynamic Performance of BPNPs
ROS play an essential role in metabolism, especially in aerobic respiration in the mitochondria. Singlet oxygen (1O2) and hydroxyl radicals (•OH) are important components of SDT. In vitro sonodynamic therapy was applied in the dish, as shown in Figure 3A. The power and time of ultrasonication were studied. As shown in Figure 3B, the F/F0 decreased strongly in the first 30s but slightly in the last 60s, especially after treatment with stronger ultrasonic power (eg, 1.5 W/cm2). This phenomenon was ascribed to oxygen-dependent ROS conversion. The quantitative analysis of F/F0 in Figure 3C indicated that stronger ultrasonic power could promote SO production. Then, the SO production of various materials was also compared, as shown in Figure 3D. There was no obvious decrease in fluorescence after treatment with ultrasound in PBS or PDA group. In comparison, BP-PDA exhibited a clear decrease in fluorescence intensity, which was further surpassed by BP-PEG, mainly due to different contents of BP and the encapsulated PDA layer reducing the linkage between BP and the reactive matrix. The quantitative results showed that the relative fluorescence intensity of BP-FA decreased by 0.57, while that of BP-PEG decreased by nearly 0.76, as shown in Figure 3G. The detection results of •OH were consistent with those of 1O2. However, •OH production was independent of the environment and had a certain linear relationship with ultrasound time, as shown in Figure 3E and F. These results were attributed to production methods that originated from water according to reported articles.35,36 Moreover, the results showed that BP-PEG could produce more •OH under ultrasound than BP-FA, as shown in Figure 3H and I. These results indicated that BP-PEG not only produced enough ROS to result in cellular toxicity but also realized the goal of controllable drug release through ultrasonic treatment.
 |
Figure 3 In vitro SDT. (A) Illustration of the detection of ROS with specific probes. (B) Detection of singlet oxygen (1O2) using ABDA as a specific probe after application of ultrasound at various powers and (C) the corresponding quantitative analysis of fluorescence intensity after ultrasound. (D) Detection of 1O2 using ABDA as a specific probe with various nanomaterials and (E) the corresponding quantitative analysis of fluorescence intensity after ultrasound. (F) Detection of hydroxyl radicals (•OH) using PTA as a specific selective probe after application of ultrasound at various powers and (G) the corresponding quantitative analysis of fluorescence intensity after ultrasound. (H) Detection of •OH using PTA as a specific selective probe with various nanomaterials and (I) the corresponding quantitative analysis of fluorescence intensity. The corresponding mass concentrations of PDA, BP-PEG and BP-FA tested to detect nanomaterial-dependent ROS production were 100 μg/mL. |
In vitro Cytotoxicity and Cellular Internalization
To evaluate the cytotoxicity of BPNPs against both TAM-sensitive and TAM-resistant breast cancer cells, the TAM-resistant MCF7 breast cancer cells (TMR) were established as described in Materials and Methods (Figure S4). Colony formation ability was used to reveal that TMR cells formed more and larger colonies than parental cells, indicating the successful establishment of TAM resistance (Figure S5). To evaluate the anticancer effects of the developed nanoparticles, the cytotoxicity of free TAM and TAM@BP-FA was determined in both MCF7 and TMR cells. Compared with TAM, TAM@BP-FA exerted stronger cytotoxicity effects at all the doses tested. TAM (5 μg/mL) caused 47.7% of MCF7 cell death, whereas the same amount of TAM@BP-FA led to 83.6% of cell death (Figure 4A). TAM barely caused TMR cell death until 10 μg/mL. As shown in Figure 4B, compared with 7.7% cell death in 5 μg/mL TAM group, an equal concentration of TAM@BP-FA resulted in 69.6% of TMR cell death. We next evaluated the cytotoxicity of BPNPs in MCF7 and TMR cells. As illustrated in Figure 4C, after co-culture with up to 50 μg/mL BPNPs for 24 h, there was no obvious toxicity for either MCF7 or TMR cells, demonstrating good biocompatibility and low biotoxicity of BPNPs.
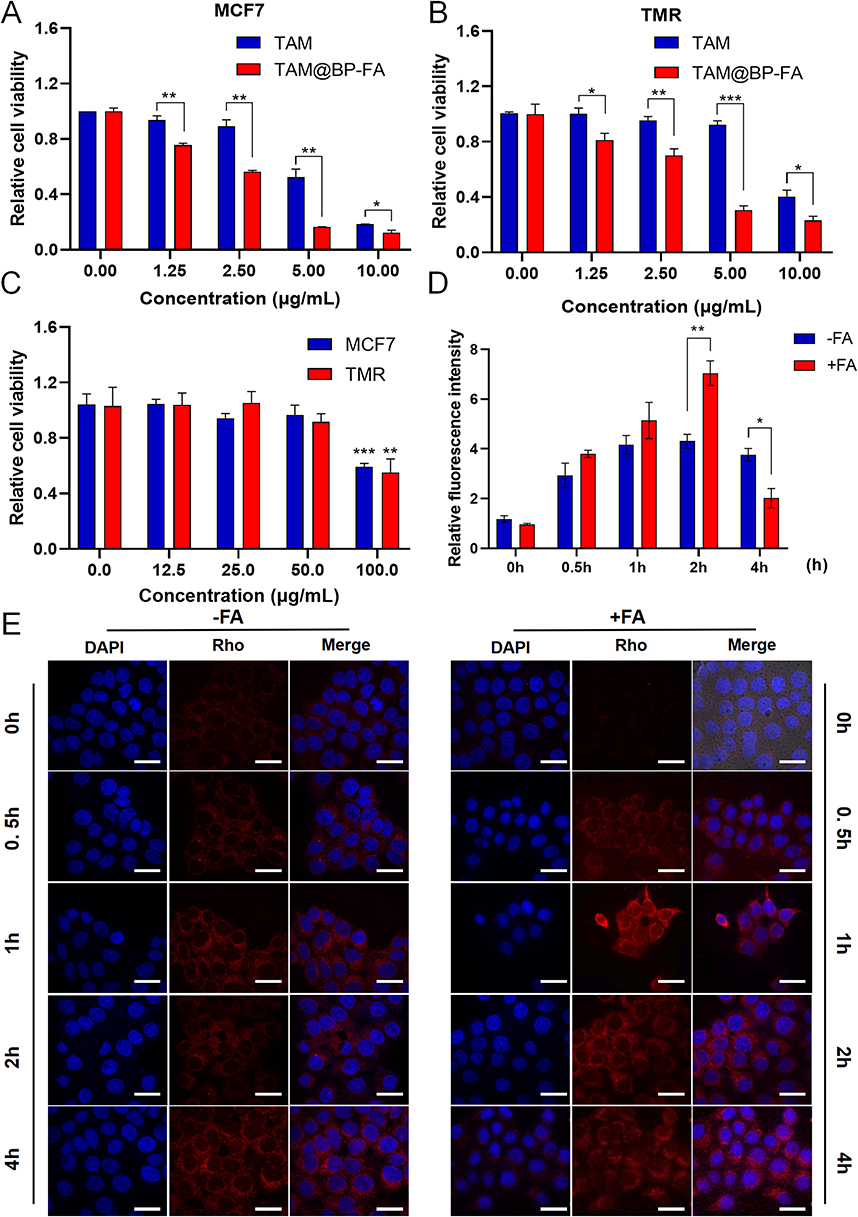 |
Figure 4 Cytotoxicity assays and cellular internalization. Cell viability of (A) MCF7 and (B) TMR cells exposed to free TAM or TAM@BP-FA at different concentrations. (C) Biotoxicity of BPNPs in MCF7 and TMR cells treated with doses from 0–100 μg/mL. (D) Quantification of fluorescence intensity in (E). (E) Fluorescence imaging of TMR cells incubated with Rho labeled TAM@BP-FA and TAM@BP, Nuclei were stained with DAPI. Data are means ± SD (n = 3). *p < 0.05, **p < 0.01, ***p < 0.001. |
We then compared the targeting ability of TAM@BP-FA with TAM@BP using TMR cells. It was evaluated on the basis of the red fluorescence emitted by rhodamine-labeled nanocomposites and blue fluorescence emitted by DAPI-labeled nuclei. Cells were co-cultured with 5 μg/mL Rhodamine-labeled TAM@BP-FA NPs or TAM@BP. The signal intensity illustrated effective internalization of TAM@BP-FA increased in a time-dependent manner in early process (Figure 4D). Confocal images showed obviously higher intensity in the second hours in FA-conjugated group in comparison with non-FA conjugated group (Figure 4E).
Mechanisms Underlying the Enhanced Antitumor Effects of TAM@BP-FA
To fully explore the underlying mechanisms of TAM@BP-FA on TMR cell death, next-generation RNA sequencing (RNA-seq) was performed to show the detailed gene expression profiling. Figure 5A presented a heatmap of hierarchical clustering analysis of TMR treated with free TAM and TAM@BP-FA, which showed distinct gene expression profiles between two groups. As illustrated in Figure S6, the gene expression profiles were analyzed to identify differentially expressed genes (DEGs). Representative genes enriched in related pathways are shown in Figure 5B. The KEGG enrichment analysis revealed that the top pathways that were active in TMR cells including cell cycle, cellular senescence, apoptosis and homologous recombination, among others (Figure 5C and Table S3). We focused on cell cycle and apoptosis regulation, as a comparison of previously well-known TAM mechanisms.37 Several key factors in cell cycle and apoptosis were analyzed. As illustrated in Figure 5D, TAM@BP-FA significantly reduced the mRNA levels by 44.5% for CCND1 and 55% for MYC in comparison with free TAM. Similar effects could be observed in MCF7 cells (Figure S7). In TMR cells, cyclin D1 mRNA and protein expression were significantly downregulated by TAM@BP-FA, while they maintained the same despite TAM treatment. Apart from gene expression analysis, we next investigated protein expression of commonly used biomarkers including Bcl-2, Bax and cleaved caspase-3. Compared with free TAM, TAM@BP-FA significantly raised Bax and cleaved caspase-3 expression, reduced Bcl2 expression in TMR cells, which is consistent with the previous reported TAM anticancer mechanisms38,39 (Figure 5E). Furthermore, we analyzed cell cycle alteration of TMR cells treated with TAM and TAM@BP-FA. The results in Figure 5F revealed that subG1 phase was 6.75% in the TAM@BP-FA group, obviously higher than that in free TAM group (0.68%). TAM@BP-FA caused higher G1 arrest (79.61% vs 72.43%) and less S phase accumulation (9.35% vs 12.98%) in TMR than free TAM (Figure 5G). Flow cytometric analysis revealed that TAM@BP-FA arrested a greater percentage of TMR cells in the Sub G1 and G1 phase. Both analysis of cell cycle and apoptosis showed that TAM@BP-FA can induce TMR cell death much effectively and furthermore, potentially prevent cells from developing TAM resistance.
 |
Figure 5 Mechanism underlying the enhanced antitumor effects of TAM@BP-FA (A) Heatmap of the gene expression in TMR treated with free TAM and TAM@BP-FA, based on RNA-seq data. (B) Genes enriched in related pathways. (C) KEGG enrichment analysis of the top 10 key pathways unique to TAM@BP-FA. (D) The gene expression of CCND1 and MYC in TMR cells treated with free TAM or TAM@BP-FA. (E) Protein analysis of TMR cells after the above treatments (n = 2). (F and G) Cell cycle analysis of TMR with above treatments. Data are means ± SD (n = 3). *p < 0.05, ***p < 0.001 and ****p < 0.0001. |
In vitro SDT-Enhanced Activity and Mechanism Analysis
As BPNPs can serve as suitable sensitizer, we tested the synergetic anticancer effects of TAM@BP-FA in combination with SDT. A special tank was designed to facilitate the use of US irradiation and simultaneously dissipate the heat caused by US (Figure S8). As shown in Figure 6A and B, TAM@BP-FA was cytotoxic against both MCF7 and TMR cells in a dose-dependent manner with and without US stimulation. TAM@BP-FA (5 μg/mL) caused an 83.58% reduction in cell number, while the addition of US caused 8% more cell death in MCF7 cells. The TMR survival rate was 30.44% in the TAM@BP-FA group and 15.30% in TAM@BP-FA plus US group. The antitumor effects of TMR were further confirmed by calcein-AM and propidium iodide (PI) staining, which labeled live cells green and dead cells red. Compared to the control group, BP-FA nanocomposites barely exhibited red fluorescence, indicating no obvious cytotoxicity. Both BP-FA+US and TAM@BP-FA groups caused a moderate red signal. As expected, remarkable red fluorescence was observed in the TAM@BP-FA+US group, indicating the most conspicuous cell lethality through synergistic therapy (Figure 6C).
 |
Figure 6 In vitro SDT study. (A) Relative cell viabilities of MCF7 after incubation with TAM@BP-FA with or without US irradiation for 24h (1.0 MHz, 1.5 W/cm2, 10 min, 50% duty cycle). (B) Relative cell viabilities of TMR after incubation with TAM@BP-FA with or without US irradiation for 24h (1.0 MHz, 1.5 W/cm2, 10 min, 50% duty cycle). (C) Fluorescence microscope images of calcein-AM (green, live cells) and PI (red, dead cells) staining, DCFDA staining (green, ROS detection), JC-1 staining (MMP detection) in TMR cells in the above-mentioned groups. Data are means ± SD (n = 3). *p < 0.05, **p < 0.01, ***p < 0.001 and ****p < 0.0001. |
We then sought to investigate ROS production by TAM@BP-FA under US excitation. 2’-7’-dichlorofluorescein diacetate (DCFH-DA) was applied to detect intracellular ROS level. In Figure 6C, TMR cells treated with BP-FA NPs alone or TAM@BP-FA group exhibited no obvious green fluorescence, similar to that of control group. Comparatively, medium green fluorescence was shown in BP-FA group under US stimulation, implying a certain amount of ROS generation. Inspiringly, TMR cells treated with TAM@BP-FA under ultrasonic stimulation showed apparent fluorescence intensity, indicating markedly ROS elevation. Furthermore, we examined the MMP to evaluate mitochondrial damage after US excitation. As shown in Figure 6C, an intense red signal and weak green signal were observed in the control group and BP-FA group, indicating relatively healthy mitochondria. In contrast, the cells treated with either BP-FA followed by US irradiation or TAM@BP-FA displayed a weaker red signal and stronger green signal, suggesting certain damage to the mitochondria. TMR cells in the TAM@BP-FA+US group exhibited severe mitochondrial dysfunction, as indicated by strongest green fluorescence and weakest red signal. Quantitative analysis of ROS and MMP confirmed the above results (Figures S9 and 10). Taken together, these results revealed that TAM@BP-FA under US treatment contributed to sufficient ROS production and mitochondrial dysfunction induction, effectively leading to tumor cell death.
In vitro Immune Responses of TAM@BP-FA
To explore the immunoregulatory effects of TAM@BP-FA on immune cells in the absence of any immune stimulants, PBMCs derived from patients with ER positive breast cancer patients were isolated and ex vivo functional evaluation of immune cell components was studied. The changes of individual immune cell populations were assessed by flow cytometry analysis. After 48 hours of co-culture, we detected changes of PBMC cell lineages constitution, which showed a notable induction in NK cells and a deduction of macrophages, especially macrophages M2 type (Figure 7A). The percentage of NK cells (CD45+, CD56+) in the TAM@BP-FA group was approximately 2.75-fold and 2.57-fold higher than that in the free TAM and BP groups. Population of NK cells in TAM@BP-FA group was the highest among the groups, 2.32-fold higher than that in PBS group. Moreover, compared with those of the control group, remarkable downregulation of macrophages was observed in the TAM@BP-FA group. The number of macrophages and macrophages M2 type in TAM@BP-FA group was approximately 0.22- and 0.24-fold lower than those of the control group, respectively. The analysis of CD4+T cells/CD8+T cells in PBMCs showed no preference among the groups. The B cells identified as CD45+ CD19+ were not impacted as well (Figure 7B and Figure S11B). Collectively, our analysis demonstrated that TAM@BP-FA promotes NK cell induction and immunosuppressive macrophages depletion to potentially maximize antitumor immune responses.
 |
Figure 7 In vitro immune responses. Gating strategy was provided in Figure S11A. (A) Relative changes in NK cells Macrophages and Macrophages type 2 were analyzed following PBMCs co-culture with medium from various materials and TMR for 48h. (B) Graphic representation of distributions and numbers of above-mentioned immune cells among the cohorts. Data are means ± SD (n = 3). ns no significance, *p < 0.05, **p < 0.01, ***p < 0.001 and ****p < 0.0001. |
In vivo Distribution
To investigate the tumor accumulation and tissue distribution of nanocomposites, TMR-bearing BALB/c nude mouse were intravenously injected with free ICG, ICG loaded BP-FA and in vivo fluorescence intensity distribution was recorded. As shown in Figure 8A. the fluorescence intensity of free ICG in the blood circulation reached maximum at 1 h post-injection and was detectable after 12 h; however, it disappeared after 72 h. In contrast, the ICG@BP-FA accumulated in the tumor site with the fluorescence intensity reaching maximum at 6 h post-injection and can be detected even after 72 h, indicating that the designed nanocomposites could persist in the tumor site through the enhanced permeation and retention (EPR) effect. Moreover, ex vivo organ and tumor imaging, as shown in Figure 8B, indicated that a strong fluorescence signal in the lung and kidney, ascribed to slow metabolism and organ retention of nanocomposites in vivo. The fluorescence signal at tumor sites remained outstanding and two times stronger than that in the lung as shown in Figure 8C. The results showed that ICG@BP-FA could accumulate into tumors than in other organs, indicating good tumor targeting efficiency.
 |
Figure 8 Biodistribution of BPNPs in TMR tumor-bearing BALB/c nude mice. (A) In vivo distribution after intravenous injection of PBS, ICG and ICG@BP-FA. (B) Ex vivo distribution in main organs and tumors at 72 h post-injection of PBS, ICG and ICG@BP-FA. (C) Quantitative analysis of fluorescence intensity in the main organs and tumors. Data are means ± SD (n = 3). |
In vivo Synergistic Antitumor Effect
To evaluate the antitumor effect, a mouse model was established to investigate the therapeutic efficacy of BP-based TAM compared to free TAM. Mice-bearing TMR tumor cells were randomly divided into seven groups marked with G1-G7. The process is shown in Figure 9A. As illustrated in Figure 9B and C, TAM showed no obvious antitumor effects, which was similar to that treated with PBS. TAM@BP-FA with US treatment showed a higher tumor suppression ability than TAM@BP with US treatment, revealing that targeting FAR receptor enhanced antitumor effect. In addition, compared with the non-US group (TAM@BP-FA), the tumor growth of the TAM@BP-FA+US group was almost totally inhibited, demonstrating its excellent synergistic therapeutic efficacy of SDT. Fortunately, we found that ultrasonic stimulation displayed an enhanced tumor growth inhibition effect, no matter tumors treated with BP, TAM@BP or TAM@BP-FA. Consistent with the above results, H&E staining indicated that more tumor cell death after treatment of TAM@BP-FA with US stimulation, Ki67 was expressed at lower levels in the tumor treated with synergistic therapy (Figure 9D). Collectively, these observations suggested that TAM@BP-FA effectively suppressed tumor growth and the addition of SDT further eliminated tumor cells.
 |
Figure 9 In vivo synergistic antitumor effect (A) Treatment illustration. (B) Tumor growth curves in various groups with various treatments. (C) Tumor weight and digital photos of tumors from various groups after sacrifice (D) H&E staining and Ki67 staining of tumor tissues of various groups. G1-G7 represent mice treated with PBS, TAM, BP+US, BP-FA+US, TAM@BP+US, TAM@BP-FA and TAM@BP-FA+US respectively. |
The main organs were collected to determine induced organ lesions. H&E staining of the heart, liver, spleen, lung, and kidneys of the mice at day 14 post therapy was compared with each group. As shown in Figure 9D, no obvious histological damage was observed in any group. In addition, no obvious differences in body weight were found among all groups (Figure S12). These results confirmed the superior biocompatibility of BP-based targeted therapy, indicating its likely safety in tumor treatment.
Discussion
It is well known that TAM therapy benefits survival time and reduces recurrent events in breast cancer patients.40 Despite the beneficial therapeutic effects, many other less favorable properties still exist, such as low aqueous solubility (0.04 µg/mL), high first-pass metabolism in liver.41,42 Moreover, approximately 30–40% of patients finally relapse or progress to disease progression within 15 years of follow-up.43 Therefore, TAM resistance associated with advanced metastatic stages is still a significant clinical challenge.
The application of nanotechnology offers numerous strategies for diagnosis, treatment, and prevention of multiple cancers.44 With unique properties of small size, shape, active and passive targeting, nanoparticles help to deliver drugs with enhanced efficacy and reduced toxicity, thus improving anticancer activity. Since the first nanoparticle platform, a PEGylated liposomal doxorubicin (trade name: Doxil®) has been FDA-approved 20 years ago,45 an increasing number of studies have focused on cancer nanotechnology strategies. Nanomaterials loaded with TAM (“nano TAM”) can easily penetrate the leaky blood vessels that surround cancer cells and tissues, thereby enhancing TAM delivery in the tumor location.37,46 In previous studies, multiple TAM nano-delivery materials were reported, including liposomes, graphene oxide, polylactide-coglycolide (PLGA), polymeric micelles.47–50 An in vitro study concerning TAM-loaded solid lipid nanoparticles achieved optimum drug loading capacity with equivalent cytotoxicity of TAM to breast cancer cell lines.51 Another literature reported solid lipid nanoparticles could overcome the acquired TAM resistance. However, both studies did not demonstrate the tumor growth inhibition in vivo experiments.52 What is more, many of other products have been proven to reduce side effects, but not improve efficiency.53 Other challenges include low drug capacity and stability, or high costs.54
In the present study, we synthesized and characterized FA receptor-targeting black phosphorus-based nanoplatform. RNA-seq illustrated possible molecular mechanism proposed for anticancer effects of TAM@BP-FA, we focused on cell cycle and apoptosis regulation, as a comparison of previously well-known TAM mechanisms.55 CCND1 has been identified as a major factor in cell cycle phase transitions and regulates cell survival and proliferation in breast cancer.56 Cyclin D1, encoded by CCND1, is required to bind and activate cell cycle-dependent protein kinases four and six (CDK4/6) for further cell cycle progression at the G1/S. In TMR cells, cyclin D1 mRNA and protein expression were significantly downregulated by TAM@BP-FA, while they maintained the same despite TAM treatment. Flow cytometric analysis revealed that TAM@BP-FA arrested a greater percentage of TMR cells in the Sub G1 and G1 phase. Also, commonly used apoptosis biomarkers were investigated. The protooncogene MYC affects multiple cellular functions, including cell proliferation, apoptosis, growth, differentiation and metabolism.57 In our study, TAM@BP-FA effectively induces TMR cells apoptosis through the downregulation of anti-apoptotic genes MYC and protein Bcl-2, overexpression of apoptotic protein (bax and caspase3). Both analysis of cell cycle and apoptosis showed that TAM@BP-FA can induce TMR cell death much effectively and furthermore, potentially prevent cells from developing TAM resistance.
Nowadays, multifunctional nanoplatforms hold great promise for cancer therapy as powerful alternatives to mono-traditional therapy. We next explore the potential combination therapy based on the unique BP properties. The sonodynamic sensitizer BP has the ability to efficiently generate ROS under ultrasound stimulation, and therefore induce serve cytotoxicity in cancer cells.18 Additionally, unlike other therapeutics that may eventually lead to drug resistance in cancer cells, ROS simultaneously cause damage to a variety of molecules and structures that are essential for cell functions, which limits the ability of cancer cells to develop resistance mechanisms.58 The newly formulated TAM@BP-FA caused cytotoxicity of TMR cells, therefore effectively avoids the possibility of cells to develop into a more aggressive resistance phenotype.
Breast cancer models originating from 4T1 cells are commonly used in the studies of BP immune modulation.59–62 As nanoparticles normally tested on immunodeficient animal models of human tumors, the potential immunomodulatory mechanism is a relevant question for cross-species. Therefore, we isolated human PBMCs from breast cancer patients to assess nano-TAM induced immune cell regulation. The analysis of immune cells demonstrated that TAM@BP-FA potentially activate antitumor immune responses by NK cell induction and immunosuppressive macrophage depletion. Overall, the novel formulated TAM@BP-FA resulted in significantly increased anti-cancer efficacy and potentially reduce the possibility to develop TAM resistant by combination target therapy, SDT and immune modulation.
Conclusion
In summary, we developed BP-based nanocomposites integrating FA and TAM, achieved high affinity for both TAM-sensitive MCF7 and TAM-resistant TMR breast cancer cells. TAM@BP-FA presented a significant improvement over free TAM in inhibiting in vitro breast cancer cells and in vivo tumor growth. Additionally, based on the role of BP as a sonosensitizer, SDT was used to generate toxic ROS to cause further cell death. Moreover, PBMCs were applied to assess the immunoregulatory effects, which showed higher NK cell infiltration and reduced immunosuppression macrophages. Altogether, the multifunctional BP-based nanocomposite combined with SDT represents a synergistic strategy to improve endocrine therapy and antitumor immune response.
Abbreviations
MMP, mitochondrial membrane potential; TAM, tamoxifen; TAM-resistant, TMR; PBMC, Human peripheral blood mononuclear cells; FA, folic acid; BPNP, black phosphorus nanoparticle; NK cell, natural killer cell; ROS, reactive oxygen species; SDT, sonodynamic therapy; ER, estrogen receptor; PDA, polydopamine; PEG, Polyethylene glycol; TMR, tamoxifen resistant; next-generation RNA sequencing, RNA-seq; DEG, differentially expressed genes; ERE, estrogen response element.
Acknowledgments
This work was supported by the Anhui Province in 2022 Innovation and Entrepreneurship Support Plan Project (2022LCX031), Fundamental Research Funds for the Central Universities (No. WK9110000151, No. YD9110002042) and Beijing Health Promotion Association (No. 2020-CHPASLP-01). Schematic illustration was created using software 3D max 2019, Autodesk Inc.
Disclosure
The authors declare that they have no known competing financial interests or personal relationships that could have appeared to influence the work reported in this paper.
References
1. Siegel RL, Miller KD, Jemal A. Cancer statistics, 2018. CA Cancer J Clin. 2018;68(1):7–30. doi:10.3322/caac.21442
2. Musgrove EA, Sutherland RL. Biological determinants of endocrine resistance in breast cancer. Nat Rev Cancer. 2009;9(9):631–643. doi:10.1038/nrc2713
3. Chia S, Bryce C, Gelmon K. The 2000 EBCTCG overview: a widening gap. Lancet. 2005;365(9472):1665–1666. doi:10.1016/S0140-6736(05)66524-5
4. Fisher B, Redmond C, Brown A, et al. Influence of tumor estrogen and progesterone receptor levels on the response to tamoxifen and chemotherapy in primary breast cancer. J Clin Oncol. 1983;1(4):227–241. doi:10.1200/JCO.1983.1.4.227
5. Yang G, Nowsheen S, Aziz K, Georgakilas AG. Toxicity and adverse effects of Tamoxifen and other anti-estrogen drugs. Pharmacol Ther. 2013;139(3):392–404. doi:10.1016/j.pharmthera.2013.05.005
6. Meier CR, Jick H. Tamoxifen and risk of idiopathic venous thromboembolism. Br J Clin Pharmacol. 1998;45(6):608–612. doi:10.1046/j.1365-2125.1998.00733.x
7. Peters-Engl C, Frank W, Danmayr E, Friedl HP, Leodolter S, Medl M. Association between endometrial cancer and tamoxifen treatment of breast cancer. Breast Cancer Res Treat. 1999;54(3):255–260. doi:10.1023/A:1006126411210
8. Petinari L, Kohn LK, de Carvalho JE, Genari SC. Cytotoxicity of tamoxifen in normal and tumoral cell lines and its ability to induce cellular transformation in vitro. Cell Biol Int. 2004;28(7):531–539. doi:10.1016/j.cellbi.2004.04.008
9. Chen HY, Yang YM, Han R, Noble M. MEK1/2 inhibition suppresses tamoxifen toxicity on CNS glial progenitor cells. J Neurosci. 2013;33(38):15069–15074. doi:10.1523/JNEUROSCI.2729-13.2013
10. Nass N, Kalinski T. Tamoxifen resistance: from cell culture experiments towards novel biomarkers. Pathol Res Pract. 2015;211(3):189–197. doi:10.1016/j.prp.2015.01.004
11. Zhang T, Wan Y, Xie H, et al. Degradation chemistry and stabilization of exfoliated few-layer black phosphorus in water. J Am Chem Soc. 2018;140(24):7561–7567. doi:10.1021/jacs.8b02156
12. Zhou W, Pan T, Cui H, Zhao Z, Chu PK, Yu XF. Black phosphorus: bioactive nanomaterials with inherent and selective chemotherapeutic effects. Angew Chem Int Ed Engl. 2019;58(3):769–774. doi:10.1002/anie.201810878
13. Reuter S, Gupta SC, Chaturvedi MM, Aggarwal BB. Oxidative stress, inflammation, and cancer: how are they linked? Free Radic Biol Med. 2010;49(11):1603–1616. doi:10.1016/j.freeradbiomed.2010.09.006
14. Martin C, Schulz R, Rose J, Heusch G. Inorganic phosphate content and free energy change of ATP hydrolysis in regional short-term hibernating myocardium. Cardiovasc Res. 1998;39(2):318–326. doi:10.1016/S0008-6363(98)00086-8
15. Di Marco GS, Hausberg M, Hillebrand U, et al. Increased inorganic phosphate induces human endothelial cell apoptosis in vitro. Am J Physiol Renal Physiol. 2008;294(6):F1381–7. doi:10.1152/ajprenal.00003.2008
16. Spina A, Sapio L, Esposito A, Di Maiolo F, Sorvillo L, Naviglio S. Inorganic phosphate as a novel signaling molecule with antiproliferative action in MDA-MB-231 breast cancer cells. Biores Open Access. 2013;2(1):47–54. doi:10.1089/biores.2012.0266
17. Wang H, Yang X, Shao W, et al. Ultrathin black phosphorus nanosheets for efficient singlet oxygen generation. J Am Chem Soc. 2015;137(35):11376–11382. doi:10.1021/jacs.5b06025
18. Li Z, Zhang T, Fan F, Gao F, Ji H, Yang L. Piezoelectric materials as sonodynamic sensitizers to safely ablate tumors: a case study using black phosphorus. J Phys Chem Lett. 2020;11(4):1228–1238. doi:10.1021/acs.jpclett.9b03769
19. Zhang M, Wang W, Cui Y, Zhou N, Shen J. Near-infrared light-mediated photodynamic/photothermal therapy nanoplatform by the assembly of Fe(3)O(4) carbon dots with graphitic black phosphorus quantum dots. Int J Nanomedicine. 2018;13:2803–2819. doi:10.2147/IJN.S156434
20. Qin H, Chen J, Li Y, Gao L, Sun Z. Inflammatory response induced by black phosphorus nanosheets in mice and macrophages. Sci Total Environ. 2021;146860. doi:10.1016/j.scitotenv.2021.146860
21. Su Z, Xiao Z, Huang J, et al. Dual-Sensitive PEG-sheddable nanodrug hierarchically incorporating PD-L1 antibody and zinc phthalocyanine for improved immuno-photodynamic therapy. ACS Appl Mater Interfaces. 2021;13(11):12845–12856. doi:10.1021/acsami.0c20422
22. Huang J, Xiao Z, An Y, et al. Nanodrug with dual-sensitivity to tumor microenvironment for immuno-sonodynamic anti-cancer therapy. Biomaterials. 2021;269:120636. doi:10.1016/j.biomaterials.2020.120636
23. Huang J, Zheng C, Xiao H, et al. A polymer‑calcium phosphate nanocapsule for RNAi-induced oxidative stress and cascaded chemotherapy. J Control Release. 2021;340:259–270. doi:10.1016/j.jconrel.2021.10.030
24. Yuan Y, Wang Y, Huang H, Tao S, Huang J. Fine-tuned polymer nanoassembly for codelivery of chemotherapeutic drug and siRNA. Macromol Biosci. 2023;23:e2200529. doi:10.1002/mabi.202200529
25. Assaraf YG, Leamon CP, Reddy JA. The folate receptor as a rational therapeutic target for personalized cancer treatment. Drug Resist Updat. 2014;17(4–6):89–95. doi:10.1016/j.drup.2014.10.002
26. Qiu S, Zhou Y, Zhou X, et al. Air-stable polyphosphazene-functionalized few-layer black phosphorene for flame retardancy of epoxy resins. Small. 2019;15(10):e1805175. doi:10.1002/smll.201805175
27. Peng L, Mei X, He J, et al. Monolayer nanosheets with an extremely high drug loading toward controlled delivery and cancer theranostics. Adv Mater. 2018;30(16):e1707389. doi:10.1002/adma.201707389
28. Gabellone S, Piccinino D, Filippi S, et al. Lignin nanoparticles deliver novel thymine biomimetic photo-adducts with antimelanoma activity. Int J Mol Sci. 2022;23(2):915. doi:10.3390/ijms23020915
29. Zhou W, Cui H, Ying L, Yu XF. Enhanced cytosolic delivery and release of CRISPR/Cas9 by black phosphorus nanosheets for genome editing. Angew Chem Int Ed Engl. 2018;57(32):10268–10272. doi:10.1002/anie.201806941
30. Planas O, Macia N, Agut M, Nonell S, Heyne B. Distance-dependent plasmon-enhanced singlet oxygen production and emission for bacterial inactivation. J Am Chem Soc. 2016;138(8):2762–2768. doi:10.1021/jacs.5b12704
31. Ishibashi KI, Fujishima A, Watanabe T, Hashimoto K. Detection of active oxidative species in TiO2 photocatalysis using the fluorescence technique. Electrochem commun. 2000;2(3):207–210. doi:10.1016/S1388-2481(00)00006-0
32. Altmeyer C, Karam TK, Khalil NM, Mainardes RM. Tamoxifen-loaded poly(L-lactide) nanoparticles: development, characterization and in vitro evaluation of cytotoxicity. Mater Sci Eng C Mater Biol Appl. 2016;60:135–142. doi:10.1016/j.msec.2015.11.019
33. Zhang X, Xie H, Liu Z, et al. Black phosphorus quantum dots. Angew Chem Int Ed Engl. 2015;54(12):3653–3657. doi:10.1002/anie.201409400
34. Liu F, Lin L, Zhang Y, et al. Two-dimensional nanosheets with high curcumin loading content for multimodal imaging-guided combined chemo-photothermal therapy. Biomaterials. 2019;223:119470. doi:10.1016/j.biomaterials.2019.119470
35. Miyaji A, Kohno M, Inoue Y, Baba T. Hydroxyl radical generation by dissociation of water molecules during 1.65 MHz frequency ultrasound irradiation under aerobic conditions. Biochem Biophys Res Commun. 2017;483(1):178–182. doi:10.1016/j.bbrc.2016.12.171
36. Milne L, Stewart I, Bremner DH. Comparison of hydroxyl radical formation in aqueous solutions at different ultrasound frequencies and powers using the salicylic acid dosimeter. Ultrason Sonochem. 2013;20(3):984–989. doi:10.1016/j.ultsonch.2012.10.020
37. Ventola CL. Progress in nanomedicine: approved and investigational nanodrugs. P T. 2017;42(12):742–755. doi:10.1155/2015/123756
38. Zhang GJ, Kimijima I, Onda M, et al. Tamoxifen-induced apoptosis in breast cancer cells relates to down-regulation of bcl-2, but not bax and bcl-X(L), without alteration of p53 protein levels. Clin Cancer Res. 1999;5(10):2971–2977.
39. Peng WX, Koirala P, Zhou H, et al. Lnc-DC promotes estrogen independent growth and tamoxifen resistance in breast cancer. Cell Death Dis. 2021;12(11):1000. doi:10.1038/s41419-021-04288-1
40. Cuzick J, Forbes JF, Sestak I, et al. International breast cancer intervention study, long-term results of tamoxifen prophylaxis for breast cancer--96-month follow-up of the randomized IBIS-I trial. J Natl Cancer Inst. 2007;99(4):272–282. doi:10.1093/jnci/djk049
41. Fontana G, Maniscalco L, Schillaci D, Cavallaro G, Giammona G. Solid lipid nanoparticles containing tamoxifen characterization and in vitro antitumoral activity. Drug Deliv. 2005;12(6):385–392. doi:10.1080/10717540590968855
42. Shete H, Chatterjee S, De A, Patravale V. Long chain lipid based tamoxifen NLC. Part II: pharmacokinetic, biodistribution and in vitro anticancer efficacy studies. Int J Pharm. 2013;454(1):584–592. doi:10.1016/j.ijpharm.2013.03.036
43. Davies C, Godwin J, Gray R, et al.; G. Early Breast Cancer Trialists’ Collaborative. Relevance of breast cancer hormone receptors and other factors to the efficacy of adjuvant tamoxifen: patient-level meta-analysis of randomised trials. Lancet. 2011;378(9793):771–784.
44. Chithrani BD, Stewart J, Allen C, Jaffray DA. Intracellular uptake, transport, and processing of nanostructures in cancer cells. Nanomedicine. 2009;5(2):118–127. doi:10.1016/j.nano.2009.01.008
45. Barenholz Y. Doxil(R)--The first FDA-approved nano-drug: lessons learned. J Control Release. 2012;160(2):117–134. doi:10.1016/j.jconrel.2012.03.020
46. Sharma A, Jain N, Sareen R. Nanocarriers for diagnosis and targeting of breast cancer. Biomed Res Int. 2013;2013:960821. doi:10.1155/2013/960821
47. Bhatia A, Kumar R, Katare OP. Tamoxifen in topical liposomes: development, characterization and in-vitro evaluation. J Pharm Pharm Sci. 2004;7(2):252–259.
48. Zhang YJ, Li BA, Li ZY, Xia N, Yu HY, Zhang YZ. Synthesis and characterization of Tamoxifen citrate modified reduced graphene oxide nano sheets for breast cancer therapy. J Photochem Photobiol B. 2018;180:68–71. doi:10.1016/j.jphotobiol.2017.12.017
49. Maji R, Dey NS, Satapathy BS, Mukherjee B, Mondal S. Preparation and characterization of Tamoxifen citrate loaded nanoparticles for breast cancer therapy. Int J Nanomedicine. 2014;9:3107–3118. doi:10.2147/IJN.S63535
50. Sandhu PS, Kumar R, Beg S, et al. Natural lipids enriched self-nano-emulsifying systems for effective co-delivery of tamoxifen and naringenin: systematic approach for improved breast cancer therapeutics. Nanomedicine. 2017;13(5):1703–1713. doi:10.1016/j.nano.2017.03.003
51. How CW, Rasedee A, Manickam S, Rosli R. Tamoxifen-loaded nanostructured lipid carrier as a drug delivery system: characterization, stability assessment and cytotoxicity. Colloids Surf B Biointerfaces. 2013;112:393–399. doi:10.1016/j.colsurfb.2013.08.009
52. Guney Eskiler G, Cecener G, Dikmen G, Egeli U, Tunca B. Solid lipid nanoparticles: reversal of tamoxifen resistance in breast cancer. Eur J Pharm Sci. 2018;120:73–88. doi:10.1016/j.ejps.2018.04.040
53. Caster JM, Patel AN, Zhang T, Wang A. Investigational nanomedicines in 2016: a review of nanotherapeutics currently undergoing clinical trials. Wiley Interdiscip Rev Nanomed Nanobiotechnol. 2017;9(1). doi:10.1002/wnan.1416
54. Day CM, Hickey SM, Song Y, Plush SE, Garg S. Novel tamoxifen nanoformulations for improving breast cancer treatment: old wine in new bottles. Molecules. 2020;25(5). doi:10.3390/molecules25051182
55. Dalvai M, Bystricky K. Cell cycle and anti-estrogen effects synergize to regulate cell proliferation and ER target gene expression. PLoS One. 2010;5(6):e11011. doi:10.1371/journal.pone.0011011
56. Li Z, Cui J, Yu Q, Wu X, Pan A, Li L. Evaluation of CCND1 amplification and CyclinD1 expression: diffuse and strong staining of CyclinD1 could have same predictive roles as CCND1 amplification in ER positive breast cancers. Am J Transl Res. 2016;8(1):142–153.
57. Duffy MJ, O’Grady S, Tang M, Crown J. MYC as a target for cancer treatment. Cancer Treat Rev. 2021;94:102154. doi:10.1016/j.ctrv.2021.102154
58. Holohan C, Van Schaeybroeck S, Longley DB, Johnston PG. Cancer drug resistance: an evolving paradigm. Nat Rev Cancer. 2013;13(10):714–726. doi:10.1038/nrc3599
59. Li WH, Wu JJ, Wu L, et al. Black phosphorous nanosheet: a novel immune-potentiating nanoadjuvant for near-infrared-improved immunotherapy. Biomaterials. 2021;273:120788. doi:10.1016/j.biomaterials.2021.120788
60. Nguyen HT, Byeon JH, Phung CD, et al. Method for the instant in-flight manufacture of black phosphorus to assemble core@shell nanocomposites for targeted photoimmunotherapy. ACS Appl Mater Interfaces. 2019;11(28):24959–24970. doi:10.1021/acsami.9b04632
61. Liang X, Ye X, Wang C, et al. Photothermal cancer immunotherapy by erythrocyte membrane-coated black phosphorus formulation. J Control Release. 2019;296:150–161. doi:10.1016/j.jconrel.2019.01.027
62. Zhang X, Tang J, Li C, Lu Y, Cheng L, Liu J. A targeting black phosphorus nanoparticle based immune cells nano-regulator for photodynamic/photothermal and photo-immunotherapy. Bioact Mater. 2021;6(2):472–489. doi:10.1016/j.bioactmat.2020.08.024
 © 2023 The Author(s). This work is published and licensed by Dove Medical Press Limited. The
full terms of this license are available at https://www.dovepress.com/terms
and incorporate the Creative Commons Attribution
- Non Commercial (unported, 3.0) License.
By accessing the work you hereby accept the Terms. Non-commercial uses of the work are permitted
without any further permission from Dove Medical Press Limited, provided the work is properly
attributed. For permission for commercial use of this work, please see paragraphs 4.2 and 5 of our Terms.
© 2023 The Author(s). This work is published and licensed by Dove Medical Press Limited. The
full terms of this license are available at https://www.dovepress.com/terms
and incorporate the Creative Commons Attribution
- Non Commercial (unported, 3.0) License.
By accessing the work you hereby accept the Terms. Non-commercial uses of the work are permitted
without any further permission from Dove Medical Press Limited, provided the work is properly
attributed. For permission for commercial use of this work, please see paragraphs 4.2 and 5 of our Terms.