")
Back to Journals » Open Access Journal of Contraception » Volume 11
Roles of Proximate Determinants of Fertility in Recent Fertility Decline in Ethiopia: Application of the Revised Bongaarts Model
Authors Ahmed Shallo S
Received 28 February 2020
Accepted for publication 17 May 2020
Published 3 June 2020 Volume 2020:11 Pages 33—41
DOI https://doi.org/10.2147/OAJC.S251693
Checked for plagiarism Yes
Review by Single anonymous peer review
Peer reviewer comments 2
Editor who approved publication: Professor Igal Wolman
Seifadin Ahmed Shallo
Department of Public Health, College of Medicine and Health Sciences, Ambo University, Ambo, Ethiopia
Correspondence: Seifadin Ahmed Shallo
Email [email protected]
Introduction: In Ethiopia, the fertility rate declined from 5.4 in 2005 to 4.6 by 2016. Many factors have been contributing to this decline. Understanding the factors contributing to the fertility decline and their level of fertility inhibiting effect has a paramount policy implication in any country. This study aimed to assess the contribution of the four proximate determinants of fertility, ie, contraception use, postpartum infecundity, marriage and abortion rate, to fertility decline in Ethiopia since 2005.
Methods: This study used publicly available data from the Ethiopia Demographic and Health Surveys (EDHS) of 2005, 2011 and 2016. The EDHS data were the representative data collected from the reproductive-age women through a cross-sectional study. The revised and fine-tuned Bongaarts model of proximate fertility determinants was used for data analysis. The components needed for the analysis were extracted from the full EDHS data using the STAT compiler. Finally, the analysis was done using Microsoft Excel.
Results: Of the four proximate determinants of fertility, postpartum insusceptibility contributed the highest fertility inhibiting effect in all three EDHS, and its level was also more prominent among the poorest women. While post partum infecundity, marriage and abortion had a relatively constant effect on fertility over the last 15 years, the fertility inhibiting effect of contraceptive use significantly increased from 15% to 37%.
Conclusion: In conclusion, fertility variation in Ethiopia is largely due to the three intermediate determinants of fertility. Over the last one and half decades, contraceptive use was the single most important determinant responsible for fertility decline in Ethiopia. To achieve fertility at replacement level, the country needs a contraceptive prevalence rate of 69%, an increment of nearly 100% from its current contraceptive prevalence rate.
Keywords: proximate determinants, Bongaarts revised model, Ethiopia
Background
It is believed that the rate of population growth implies economic growth of any given country. The recent fertility decline in many African countries is assumed to be one of the opportunities paving way for economic improvement. However, the rate of fertility decline is not equivalent with other continents. The demand for a high number of children is common in sub-Saharan Africa, and the United Nations Population Divisions estimated the TFR of the region to be 4.76 in 2017.1,2 Studies indicate that the fertility of a given community is affected by socio-demographic factors such as age at marriage, women’s literacy status, and contraceptive use.3,4
With the high-level efforts of governmental and non-governmental organizations’ promotion of contraceptive use6, there was an improvement in modern contraceptive prevalence in the last three decades in many sub-Saharan African countries.5 In Ethiopia, the prevalence of modern contraceptives increased from 14.7% in 2005 to 35% in 2016. However, with a total fertility rate of 4.6, the country has not achieved the TFR of 4 and contraceptive prevalence of 44% as targeted in population policy of the country formulated in 1993.6–8
In sub-Saharan Africa, nearly 50% of the women marry at the age of 18 and about 70% marry by the age of 20. The rate of early marriage is inversely related to the female literacy rate. Where there is a high literacy rate, the rate of early marriage is low. According to data from EDHS in 2016, the median age at marriage in Ethiopia was 16.6 years. Age at marriage affects the total fertility rate of a given population. This is because if a woman marries at an early reproductive age, she will have a long reproductive age duration. In addition, women who marry at an early age are less likely to be educated. This will result in low use of contraceptive methods. In Ethiopia, the women’s literacy rate is low. Only 17.2% of the women in the country attended an educational level of high school and above.7,9,10
In Ethiopia, the prevalence of premarital sexual engagement is increasing markedly. Studies indicated the prevalence of premarital sex reaches nearly 20–54% with incremental trends from time to time.11,12 In 2014, an anticipated 620,300 abortions were performed in Ethiopia. This corresponds to an annual rate of 28 abortions per 1000 women aged 15–49, an increase from 22 per 1000 in 2008.13
Davis and Blake (1956) suggested two types of factors mainly affect fertility: the direct or proximate determinants and indirect determinants or background factors. The proximate determinants (PD) of fertility are both biological and behavioral determinants that affect the fertility directly. The indirect factors such as socio-demographic and culture influence fertility through these proximate determinants but indirectly. If an intermediate fertility variable, such as the prevalence of contraception changes, then fertility necessarily changes (assuming the other intermediate fertility variables remain constant), while this is not necessarily the case for an indirect determinant such as income or education. If measured and modeled appropriately, PD can express the variability in fertility with relatively less or a few errors.14,15
In the mid-1950s Davis and Blake proposed eleven proximate determinants of fertility which include: the proportion of married women; prevalence of contraception; rate of induced abortion, frequency of sexual intercourse; sterility; and spontaneous intrauterine mortality and duration of the fertile period. The degree at which these different intermediate factors affect fertility varies between societies.15 In the late 1970s, John Bongaarts developed the modified set of proximate determinants of fertility containing four elements: marriage/cohabitation; induced abortion; contraception; and postpartum in-fecundity. Bongaarts believed that these four components were most important and believed to simplify the model for computing the fertility rate and the contribution of each PD. However, with a significant change in population reproductive behaviors and research recommendations in recent times, some original assumptions have become less accurate over time and necessitate modification. Accordingly, the existing assumptions developed by John Stover in 1998 were updated with some modifications in 2015 on three of the four components.14,16
Bongaarts Proposed Revisions
Marriage/Union/Sexual Exposure
In the previous model, it was considered that sexual activity and childbearing happens only among married women. But extra-marital sexual activity and childbearing are becoming common in both developing and developed countries. Based on this justification, Bongaarts proposed to estimate the number of women who are exposed to the risk of childbearing as the sum of married women and unmarried women. The name of the index was also changed to the index of sexual exposure instead of an index of marriage (Cm).14,17
Contraception Prevalence
In the model modified by John Stover, the assumption of the postpartum in-fecundity period overlaps with postpartum contraceptive use was ignored. But, the recent increment in contraceptive prevalence as a result of postpartum contraceptive promotion may result in the overlap and, if not taken into consideration, can significantly affect the model.17 In such cases, excluding the overlapping period should be considered. In addition, since the contraceptive prevalence varies with age, index of contraception should consider age-specific PD models rather than the aggregate approach.14 In addition to what Bongaarts has proposed, the total contraceptive prevalence rate should be considered instead of contraceptive prevalence among only married women/women in union.
Abortion
Estimates of the number of births averted by induced abortion are mainly based on numerical exercises using mathematical reproductive models. It is strongly influenced by the practice of family planning service use following induced abortion. In the absence of contraceptive use, induced abortion can reduce 0.4 births and with relatively effective contraceptive use, 0.8 births will be averted by induced abortion. For this concept, the following formula was developed:

Where b=is the number of births averted by induced abortion and u= ideally considered to be the proportion of protected women among induced abortion women.
The fertility reduction associated with a given level of the total abortion rate is calculated as:

Where TA=total abortion rate. A=the mean number of births averted per woman by the end of her reproductive age.14,16
The index of induced abortion is computed as the ratio of the observed total fertility rate, TFR, to the estimated total fertility rate without induced abortion, TFR + A,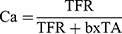
But, in the revised Bongaarts model, the formula is modified to:
 instead of b=0.4 (1+u) while the other formula is unchanged.14
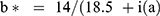
In the revised model, the number of births averted per abortion was considered to be the ratio of the mean reproductive time associated with abortion to the mean reproductive time associated with live birth, which is estimated to be 14 and 18.5, respectively, and added postpartum in-fecundity duration.14
In summary, there was one previously published article by Laelago et al on proximate determinants of fertility applying the unrevised Bongaarts model to the Ethiopian DHS of 2011 and 2016.18 However, it is likely that there are major errors in the above paper. For instance, even though it is clear that fertility in the country is decreasing over time, it was reported as if the TFR of the country increased from 4.04 (in 2011) to 4.14 (2016) which is not logical. The errors observed on the cumulative TFR were probably introduced on one or more of the indices. Such errors originated mainly from researchers’ mistakes rather than the model error. Therefore, this paper also fills these gaps. Furthermore, the contribution of each four PD index should also be identified as these have great policy implications for the country. Consequently, the objective of this paper was to assess the magnitude of the proximate determinants of fertility and their variation based on some selected socio-demographic factors.
Materials and Methods
Study Setting and Sources of Data
This study used publicly available data from the Ethiopian demographic and health surveys of 2005, 2011 and 2016. The EDHS data were representative data collected through a cross-sectional study from the reproductive-age women living in the nine regional states of the country and the two cities, ie, Addis Ababa and Dire Dawa. The data collection procedure, tools used, ethical issue and other detail were described in each EDHS. The total number of women participated in the study were 15,683, 16,515 and 14,070 in 2016, 2011 and 2005 EDHS, respectively. Of these, the sexually active unmarried women account 0.02, 0.03, and 0.01, respectively.6,7,19 The components needed for the current Bongaarts model analysis were extracted from the full EDHS data using the STAT compiler, and also with manual extraction in case the data not available directly from the STAT compiler. Finally, the data were analyzed using Microsoft excel.
Data Analysis Methods
The Bongaarts model justifies the reason why fertility cannot reach its potential maximum of 15.3. Bongaarts presented the principal proximate factors namely: effect of contraception; the effect of sexual exposure; the effect of induced abortion; and postpartum in-fecundity/insusceptibility. These four components are inhibiting the fertility of a given community from reaching its maximum theoretical fecundity rate of 15.3. The combinations of these four components were used to determine the fertility rate and the effect and contribution of each component on fertility reduction.16
In this study, the 2015 revised and fine-tuned Bongaarts model of proximate fertility determinant was used.14 Bongaarts proposed the total fertility rate (TFR) of a given community is the product of the four indexes and put the formula as follows:14,16
(1)
Where TFR=total fertility rate. Cm=index of marriage, Cc=index of contraception, Ci=index of postpartum infecundity, Ca= index of abortion, and ff=total fecundity rate, which is assumed to be 15.3.
The model treats each PD as a factor that inhibits fertility. Each index has values that range from 1 to 0 depending on the degree of fertility inhibition. The index equals 1 if it has no fertility inhibition effect, and zero when it has a 100% fertility inhibition effect. The measurements of each index are discussed below in detail.
Estimation of Index of Sexual Exposure (Cm)
This index measures the extent to which sexual exposure (includes formal marriage and cohabitation) is contributing to the fertility rate of a given community. If there is a high level of sexual exposure in the community, the fertility inhibiting effect of sexual exposure will be low and vice versa.
Accordingly, the index is calculated as follows:14
(2) (3)
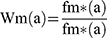
Where Cm (a) is the index of marriage, wm (a) is weighted age-specific marital fertility rate, and fm is the marital fertility rate. In a case where the age disaggregate data are not available, Bongaarts proposed the following model as a proxy measure for the marriage index:14,16
(4)
Or
(5)
Where m (a) = proportion married/in union and ex (a) =proportion of extramarital sexual exposure, TFR=total fertility rate, and TMFR= total marital fertility rate. In this paper, I compare all of the above and find a slight difference (max error of 0.01–0.04) in estimating the sexual exposure index.
Estimation of the Index of Contraception Use (Cc)
This index measures the fertility inhibition effect of contraceptive use, and it is the function of contraceptive prevalence and the effectiveness of each method used. If there is a high prevalence of contraceptives in a given community, the fertility inhibition effect will be also high and vice versa. In general, the contraceptive index is estimated as follows:14
(6)
Where: Cc=index of contraceptive use, u (a) =contraceptive prevalence (among sexually exposed women), O (a) =contraceptive use overlap with postpartum infecundability, e (a) =average contraceptive effectiveness, r (a) =fecundity adjustment.
For the computation of the index, the prevalence of contraceptive use among both married and unmarried women was used, mean contraceptive effectiveness was calculated for each user type of contraceptive and weighted, and the contraceptive use overlap with postpartum insusceptibility was considered to be zero, assuming that since the prevalence of contraceptive use is low in the country especially during the postpartum period, the effect of overlap is considered to be nil. The r (a) has already estimated (1.08) for some countries by Bongaarts.14
The contraceptive use effectiveness rates were obtained from previous studies by Trussell and Bongaarts as follows: sterilization (0.99), oral pill (0.91), Copper-based IUD (0.99), injectable (0.94), implants (0.99), male condom (0.82), rhythm/periodic abstinence (0.76), withdrawal (0.78), lactational amenorrhea and folk method (0.70).20,21 To find the mean contraceptive effectiveness rates, the proportion of women using a given method was multiplied by that specific method effectiveness. Finally, the weighted mean of the effectiveness was used.
Estimating Index of Postpartum infecundity (Ci)
This index estimates the fertility inhibition effect of postpartum infecundity due to lactational amenorrhea or postpartum sexual abstinence. In the absence of lactation, the infecund interval immediately after childbirth is on average about 1.5 months. The mean waiting time from the menses resume to conception to be 7.5 and the time added by intrauterine mortality equals approximately 2 months per birth interval. Without lactation, a typical mean birth interval can therefore be estimated to equal 1.5 + 7.5 + 2 + 9 (pregnancy period) =20 months, and with lactation it equals the mean total duration of the in-fecundity period (i) plus 18.5 months (7.5 + 2 + 9). The ratio of the mean birth intervals without and with lactation is called the index of lactational in-fecundity and calculated as follows:14,16
(7) (8)

Where i= average total duration of postpartum in-fecundity due to lactation or abstinence. It was estimated as the median duration of postpartum insusceptibility as extracted for EDHS data.
Index of Induced Abortion (Ca)
This index estimates the number of births averted by abortion and calculated using the formula:14
(9) (10) (11)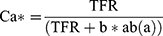

Where TFR =total fertility rate, b=births averted by induced abortion, ab(a)= abortion rate.
The value of 14 is the mean reproductive duration expected following abortion, 18.5+ i(a) is the average reproductive duration expected following live births, and i(a) represents the mean postpartum in-fecundity interval.14,16 For this model, all components were obtained from EDHS except the abortion rate which was obtained from the previous study.13
Results
Preliminary Data
Some data needed for calculating the four PD indexes were extracted and put in Table 1.
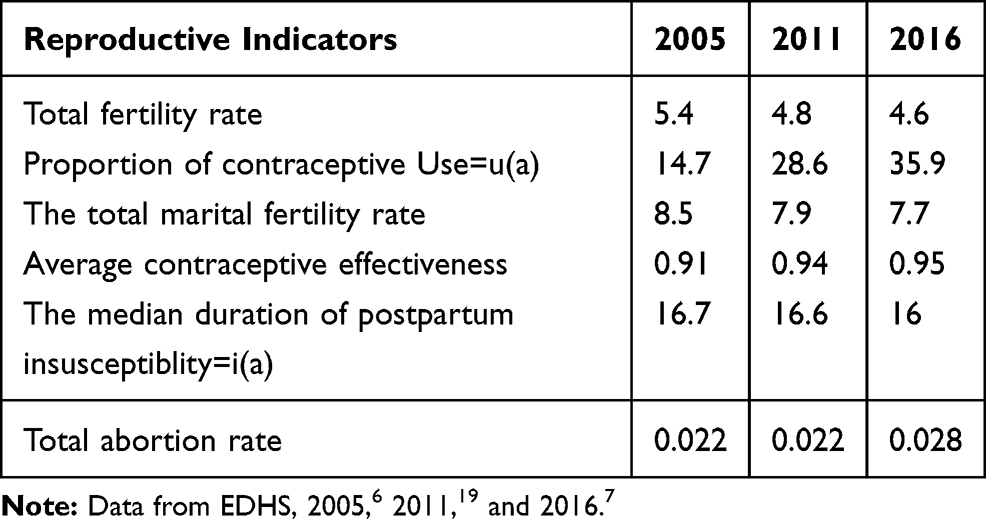 |
Table 1 Some Selected Reproductive Indicators from EDHS, 2005–2016, Ethiopia |
The Estimated Effect of the Proximate Determinants (PD)
The detail of all four indexes with their respective years is presented in Table 2. In this analysis, marriage delay/sexual non exposure inhibited fertility by 35% (Cm=0.65) and 37% (Cm=0.63), contraceptive use inhibited fertility by 29% (Cc=0.71), and by 37% (Cc=0.63) in 2011 and 2016, respectively.
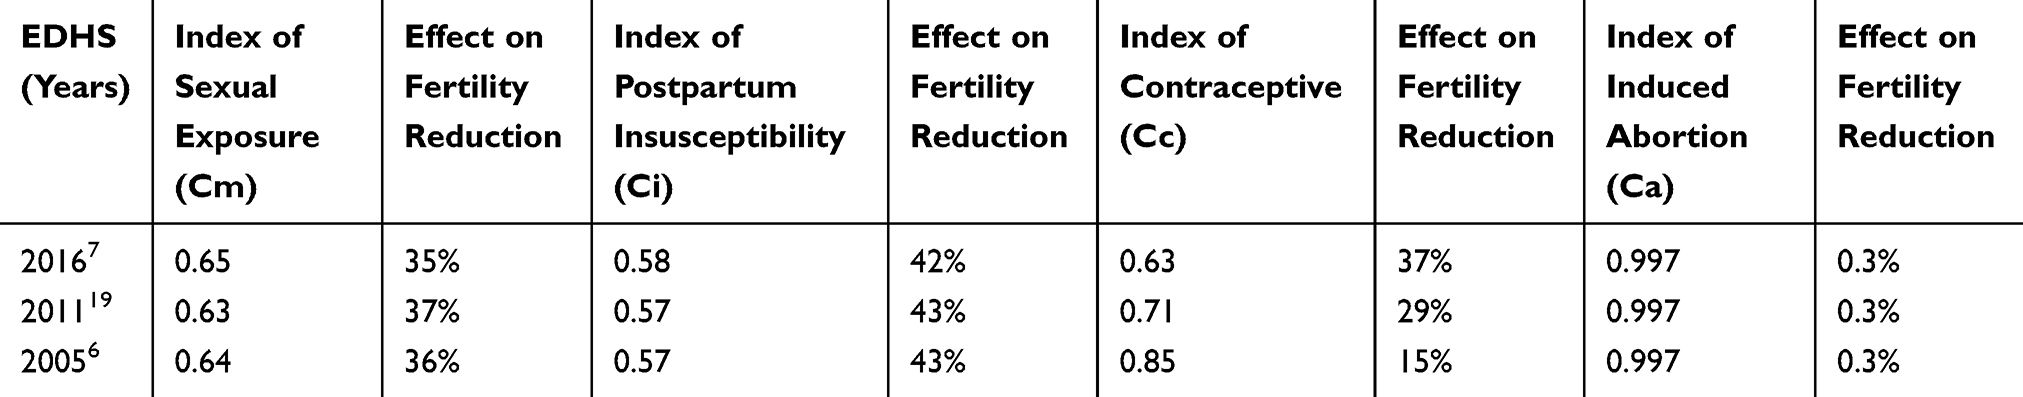 |
Table 2 Estimated Index of Proximate Determinants of Fertility and Their Fertility Reduction Effect in EDHS Data of 2005, 2011 and 2016 |
Overall, the postpartum in-fecundity had the highest (42%) fertility inhibiting effect followed by contraceptive use (reduced fertility by 37%) in 2016. Even though the degree of fertility inhibition varies, postpartum in-fecundity, contraceptive use, and delay in marriage/sexual exposure were ranked first, second and third respectively in the order of fertility inhibition effects.
In 2011 the fertility inhibiting effect of delay in marriage/sexual activity was higher than that of contraceptive use which was not uncommon in the country where contraceptive prevalence is a low and unmet need for family planning is high. But, the effect of contraceptive use on fertility reduction was increased from what it was in 2005 (15%) by 2016 (37%).
Fertility Differences by Some Selected Backgrounds
Since the most recent trends imply future planning, the analysis of the PD with different backgrounds was confined to the data extracted from EDHS 2016. As expected, there were fertility differences according to women’s level of education. As the level of education increase, the fertility rate decreases. This could be because the women who stay in school marry later in life resulting in low fertility duration. Both indices of sexual exposure (Cm=0.95, 5%), and contraceptive use (Cc=0.68, 32%) contributed to low fertility inhibiting effect among women with no education. In addition, the index of marriage/sexual delay also contributes less among women who attended higher education compared with women who had ever attended primary and/or secondary education. This could be because women who attended higher education are more likely to join marriage immediately after the completion of their education. Once they become married they will start to bear children as the desire to have children will be higher during this stage.
The differences in PD indexes were also observed among rural and urban residents. Sexual exposure has low fertility inhibiting effect among rural women, while postpartum in-fecundity has a higher fertility inhibiting effect among rural women. This could be because urban women are less likely to breastfeed for a long duration in contrast to rural women. Fertility reducing effect of contraception was highest among women in the fourth quintiles of wealth index and lowest among women of lowest wealth quintiles.
Since the disaggregated data on abortion rate for different population background was not available, country-level TAR was used in this paper, and the fertility reducing effect of abortion is almost similar among all segment of the population (Table 3).
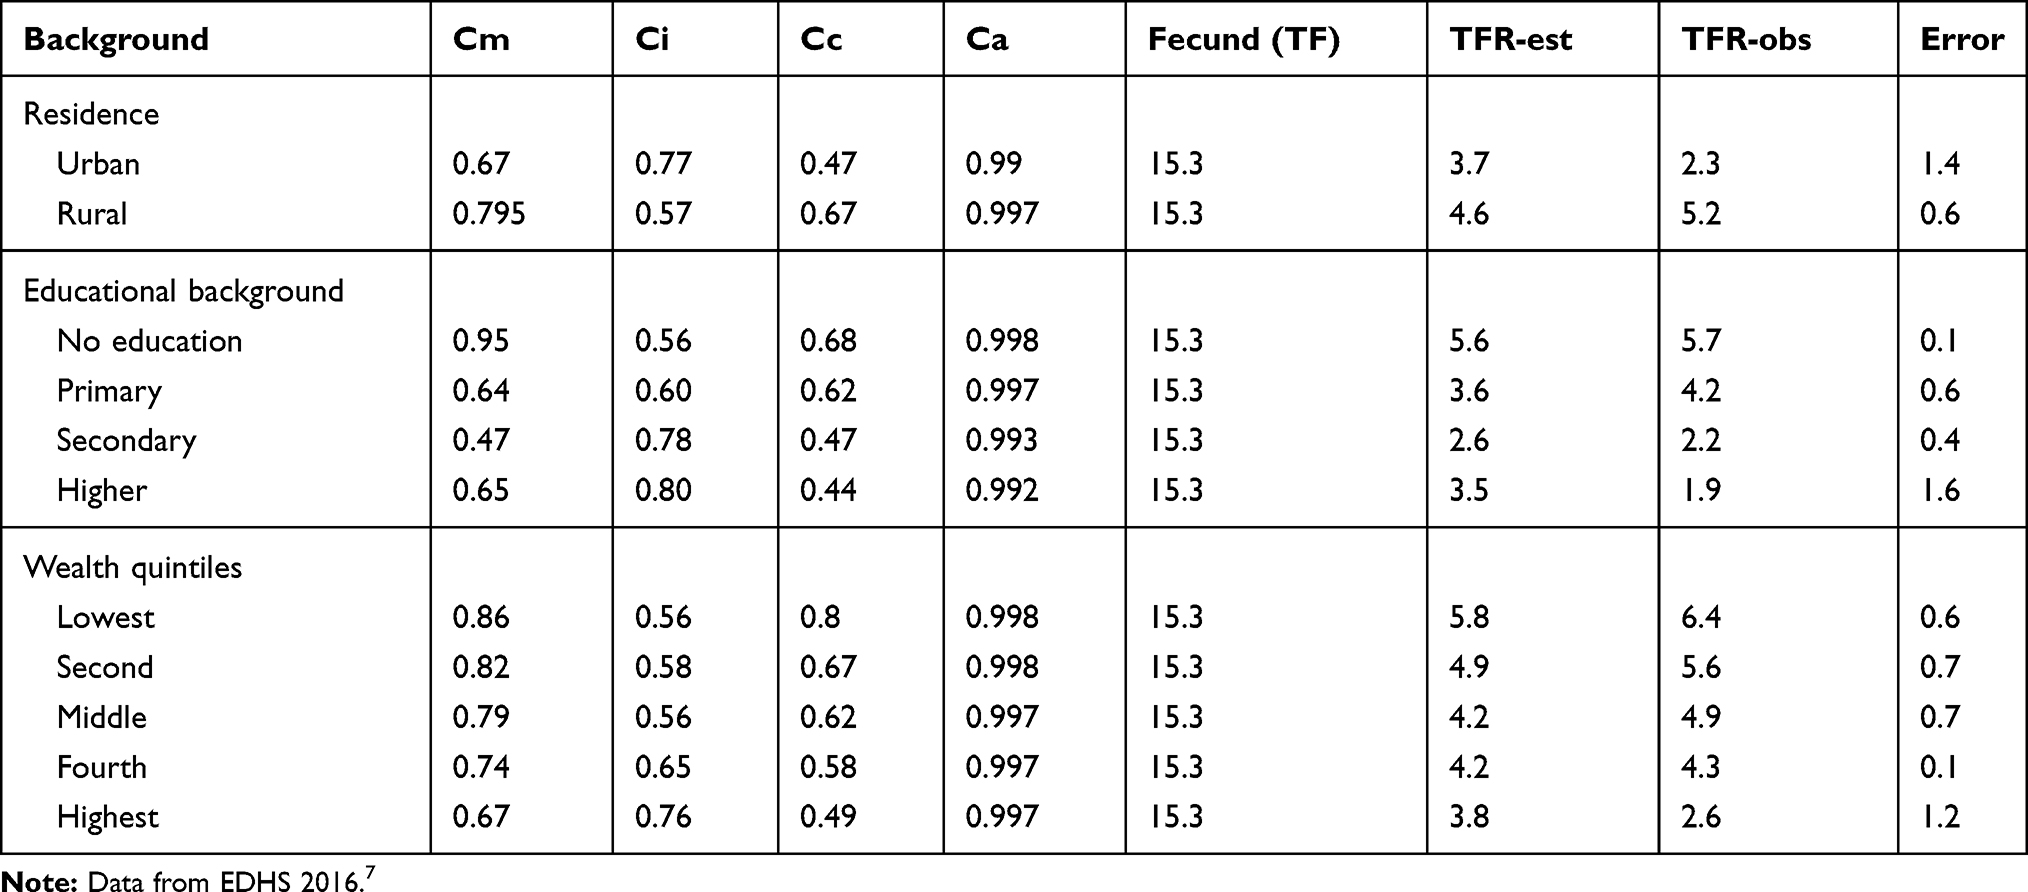 |
Table 3 Estimation of PD Index in Relation to Some Background |
Estimating the Total Fertility Rate
According to Bongaarts, variation in fertility rate among the population is due to the four factors namely: the proportion of sexual exposure; rate of induced abortion; duration of postpartum in-fecundity; and contraception use prevalence and it is a product of these four PD indexes and fecundity rate. The other remaining intermediate variables, which are considered less important, are represented in the model by the total fecundity rate (TF), which has values around 15.3 births per woman (Table 4).
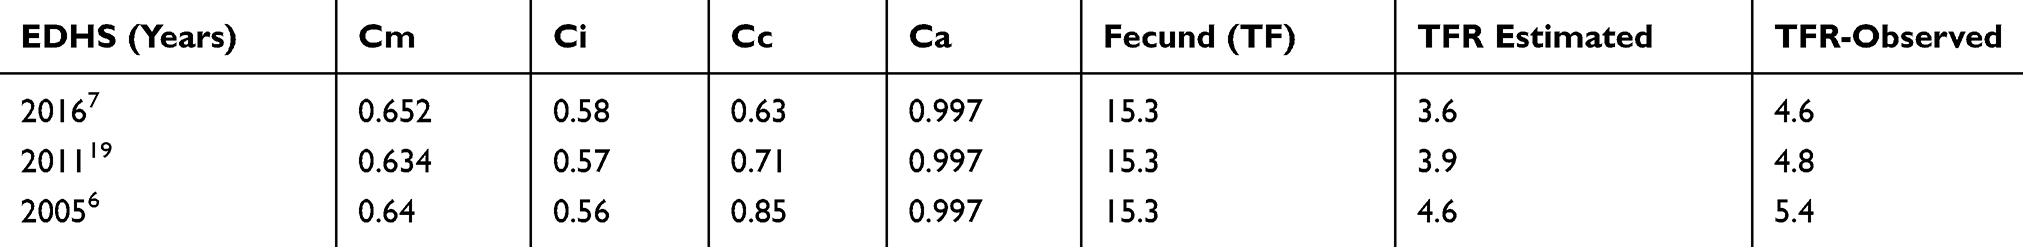 |
Table 4 Estimated Total Fertility Rate Using Bongaarts Revised Model EDHS 2005, 2011 and 2016 |
TFR = Cm *Cc *Ci *Ca *TF.
Accordingly, the estimated total fertility rate was 3.6, 3.9, and 4.2 in 2016, 2011 and 2005, respectively. All the estimated TFR as per the Bongaarts model were different from those observed in the EDHS report. These observed variations could be mainly due to the following reasons:
- There could be errors/variation during measuring the intermediate variables (proximate determinates of fertility) in EDHS.
- The total fecundity assumed was 15.3, which is the approximation. The TF, in general, is in the interval of 13 to 17. But, if we take the TF of 17, these variations become very low and so this may be the reason for the deviation from the observed total fertility rate in the model.20
- This difference may also have contributed by the modification done to the model.
In the fertility transition phase, Bongaarts proposed that there are four phases of fertility transition. In Phase I (TFR≥6), fertility transition is near natural fertility and if the fertility rate is in Phase IV (<3), it has completed fertility transition. In Ethiopia, the fertility transition is in Phase III (3≤TFR≤4.5), which is nearing to completion of fertility transition.
Future Projection of Fertility and Contraceptive Prevalence
From the Bongaarts model, we can project fertility in a certain period in the future or the contraceptive prevalence needed to reach on a certain fertility level. To do so, some assumptions and minor modifications are required. Such projection will help planners.
Assuming that we want to decide the fertility rate in the future. From the above analysis, of the four PD, except contraceptive index, three of them ie index of sexual exposure, postpartum in-fecundity and abortion index did not change significantly between the three DHS. Therefore, if we want to forecast what proportion of contraceptives is needed to achieve the replacement fertility level (TFR=2.1), we can do so with the following process.
Let TFR1 be the current fertility rate, TFR2 be the fertility replacement level we are intended to achieve, and Cc1 be the current contraceptive index and Cc2 be a contraceptive index in the future. Also, let u1 be the current contraceptive prevalence and u2 be the contraceptive prevalence we are interested to achieve the fertility replacement level.
Accordingly:
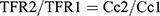
Which is equivalent with:
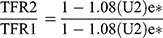
From the above formula, we can drive the contraceptive prevalence needed as in the future (u2) as follows:
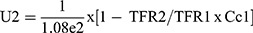

Accordingly, Ethiopia needs a contraceptive prevalence of 69%, which is almost double of the current contraceptive prevalence rate, to achieve the fertility replacement level.
Discussion
In this paper, the fertility inhibition effects of the four proximate determinants of fertility were assessed using the recently modified Bongaarts model. Compared with each other, postpartum in-fecundity contributes to the highest fertility inhibiting effect followed by contraceptive use. There were some probable justifications for this finding. One of the reasons could be that most women who participated in the study were from a rural setting where CPR was low. Studies on the determinants of fertility in Sudan also reported a similar finding.22 The rate of abortion has the least effect on all three EDHS. The effect of contraceptives significantly increased by 2016 from what it was in 2005. This change could probably be attributed to the increment in CPR of the country from 14.7% in 2005 to 36% in 2016.
The fertility inhibiting effect of the PD varies according to some backgrounds such as level of education, residence and wealth quintiles. The variation in fertility between urban and rural is mainly contributed to delay in sexual exposure/marriage and high contraceptive prevalence in urban compared to rural. The same finding was reported in Zambia.23 The fertility rate difference observed among women of different educational backgrounds also contributed to the fact that more educated women were also more likely to use contraceptives and delay marriage.5,24 Of all the PD fertility, postpartum in-fecundity contributed the highest fertility inhibiting effect among the poorest women in 2016.
By applying the fertility decomposing formula, it was observed that fertility decline between 2005 and 2016 was mainly contributed by the contraceptive use while the effect of the other indices relatively increased the fertility from what it was in 2005. The proportion of the fertility inhibiting effect of abortion between 2005 and 2016 was zero. This means the effect of abortion was constant throughout the decade. As indicated above, the proportion of marriage increased from what it was in 2005 by 2016. In Ethiopia, the age at marriage is increasing; however, the age at which sexual exposure first occurs is becoming earlier. A similar finding was reported in Zambia. In general, the trends of fertility and the effects of proximate determinants of fertility observed in Ethiopia were almost similar to the other Sub-Saharan African Countries.
In conclusion, over the last decades, contraceptive use was the single most important determinant responsible for fertility decline in Ethiopia. To achieve the fertility of replacement level, the country needs a contraceptive prevalence rate of 69%, an increment of nearly 100% from its current rate. To achieve the proposed CPR rate, meeting the unmet need for family planning is the key target to be focused on. This can be achieved by ensuring service availability and accessibility. Activities targeting controlling fertility, especially contraceptive availability, and accessibility issues, should give due attention to the poor, rural and uneducated women.
Some of the indices in the current finding significantly differed from the finding reported by Laelago et al,18 where they had applied the unrevised model. The variation was observed in postpartum in-fecundity and abortion indices. This resulted in variation of the overall fertility estimation of the model which is believed could mainly originate from the modification in the model. In addition, in a country like Ethiopia, where there is insufficient data on abortion rate or low prevalence of abortion, excluding the abortion index from the model does not affect the model’s fertility estimating power.
Limitation of the Study
There could be errors/variation during primary data collection which can directly or indirectly affect the intermediate variables (proximate determinates of fertility) in all EDHS. So, interpretation of the finding should put this into consideration.
Abbreviations
Ca, index of abortion; Cc, index of contraceptive use; Ci, index of postpartum insusceptibility; Cm, index of marriage; CPR, contraceptive prevalence rate; EDHS, Ethiopian Demographic AND Health Survey; TF, Total Fecundity; TFR, Total Fertility Rate.
Data Sharing Statement
All data generated or analyzed during this study were included in this published article. Also, the whole raw data of EDHS can be accessed online from STATcompiler.com.
Ethics and Consent
The consent to participate in the study was already assured during primary data collection in EDHS where both written and verbal informed consent was obtained from each respondent. The detailed ethical issues of the collected data were mentioned in all three EDHS from 2005–2016.
Acknowledgments
I would like to acknowledge the Ethiopian Central Statistical Agency for allowing me to access the raw data and USAID organization for enabling me to compile the data for this work.
Disclosure
The authors report no funding for this specific work and no conflicts of interest.
References
1. Beatty A (Population Readings) - Recent Fertility Trends in Sub-Saharan Africa: Workshop Summary.
2. Recent fertility trends in Sub-Saharan Africa - NCBI Bookshelf. Available from: https://www.ncbi.nlm.nih.gov/books/NBK350195/.
3. Adhikari R. Demographic, socio-economic, and cultural factors affecting fertility differentials in Nepal. BMC Pregnancy Childbirth. 2010;10(1):19. doi:10.1186/1471-2393-10-19
4. Chandiok K, Mondal PR, Mahajan C, Saraswathy KN. Biological and social determinants of fertility behavior among the jat women of Haryana state, India. J Anthropol. 2016;2016:1–6. doi:10.1155/2016/5463168
5. Emina JBO, Chirwa T, Kandala NB. Trend in the use of modern contraception in sub-Saharan Africa: does women’s education matter? Contraception. 2014;90(2):154–161. doi:10.1016/j.contraception.2014.02.001
6. Macro O; Agency/Ethiopia CS. Ethiopia Demographic and Health Survey 2005. 2006.
7. Central Statistical Agency (CSA) [Ethiopia] and ICF. 2016. Ethiopia Demographic and Health Survey 2016. Addis Ababa, Ethiopia, and Rockville, Maryland, USA: CSA and ICF.
8. Teller C, editorThe Demographic Transition and Development in Africa. Springer Science+ Business Media BV; 2011. doi:10.1007/978-90-481-8918-2
9. Singh S, Samara R. Early marriage among women in developing countries. Int Fam Plan Perspect. 1996;22(4):
10. Raj A, Saggurti N, Balaiah D, Silverman JG. Prevalence of child marriage and its effect on fertility and fertility-control outcomes of young women in India: a cross-sectional, observational study. Lancet. 2009;373(9678):1883–1889. doi:10.1016/S0140-6736(09)60246-4
11. Premarital sexual practice and its predictors among university students: institution based cross-sectional study. Available from: https://www.panafrican-med-journal.com/content/article/28/234/full/.
12. Bogale A, Seme A. Premarital sexual practices and its predictors among in-school youths of shendi town, west Gojjam zone, North Western Ethiopia. Reprod Health. 2014;11(1):49. doi:10.1186/1742-4755-11-49
13. Moore AM, Gebrehiwot Y, Fetters T, et al. The estimated incidence of induced abortion in Ethiopia, 2014: changes in the provision of services since 2008. Int Perspect Sex Reprod Health. 2016;42(3):111–120. doi:10.1363/42e1816
14. Bongaarts J. Modeling the fertility impact of the proximate determinants: time for a tune-up John Bongaarts. Demogr Res. 2015;33:535–560. doi:10.4054/DemRes.2015.33.19
15. Davis K, JB. Social structure and fertility: an analytic framework. Econ Dev Cult Chang. 1956;112–135.
16. Bongaarts J. A framework for analyzing the proximate determinants of fertility. Popul Dev Rev. 1978;4(1):105–132. doi:10.2307/1972149
17. Stover J. Proximate determinants of fertility Google Search; 1998. Available from: https://www.google.com/search?q=John+Stover+(1998)+proximate+determinants+of+ferrtlity&oq=John+Stover+(1998)+proximate+determinants+of+ferrtlity+&aqs=chrome.69i57j33.10880j1j1&sourceid=chrome¡UTF–8.
18. Tariku Laelago YH, SY. Proximate determinants of fertility in Ethiopia; an application of revised Bongaarts model. BMC Reprod Heal. 2019;16(13). doi:10.1186/s12978-019-0677-x
19. Central Statistical Agency [Ethiopia] and ICF International. 2012. Ethiopia Demographic and Health Survey 2011. Addis Ababa, Ethiopia and Calverton, Maryland, USA: Central Statistical Agency and ICF International.
20. Bongaarts J. The fertility-inhibiting effects of the intermediate fertility variables. Stud Fam Plann. 1982;13(6–7):179–189. doi:10.2307/1965445
21. Trussell J. Contraceptive failure in the United States. Contraception. 2004;70(2):89–96. doi:10.1016/j.contraception.2011.01.021
22. Fertility Determinan in Sudan. Analysis of multiple indicator cluster survey, 2014 Hassan populasi. Available from: https://jurnal.ugm.ac.id/populasi/article/view/44146/24001. Accessed January 3, 2020.
23. Chola M, Michelo C. Proximate determinants of fertility in Zambia: analysis of the 2007 Zambia demographic and health survey. Int J Popul Res. 2016;2016:1–7. doi:10.1155/2016/5236351
24. Tekelab T, Melka AS, Wirtu D. Predictors of modern contraceptive methods use among married women of reproductive age groups in Western Ethiopia: a community based cross-sectional study. BMC Womens Health. 2015;15(1):52. doi:10.1186/s12905-015-0208-z
 © 2020 The Author(s). This work is published and licensed by Dove Medical Press Limited. The full terms of this license are available at https://www.dovepress.com/terms.php and incorporate the Creative Commons Attribution - Non Commercial (unported, v3.0) License.
By accessing the work you hereby accept the Terms. Non-commercial uses of the work are permitted without any further permission from Dove Medical Press Limited, provided the work is properly attributed. For permission for commercial use of this work, please see paragraphs 4.2 and 5 of our Terms.
© 2020 The Author(s). This work is published and licensed by Dove Medical Press Limited. The full terms of this license are available at https://www.dovepress.com/terms.php and incorporate the Creative Commons Attribution - Non Commercial (unported, v3.0) License.
By accessing the work you hereby accept the Terms. Non-commercial uses of the work are permitted without any further permission from Dove Medical Press Limited, provided the work is properly attributed. For permission for commercial use of this work, please see paragraphs 4.2 and 5 of our Terms.