")
Back to Journals » International Journal of Nephrology and Renovascular Disease » Volume 10
Role of serum cystatin-C and beta-2 microglobulin as early markers of renal dysfunction in children with beta thalassemia major
Authors Behairy OG , Abd Almonaem ER, Abed NT, Abdel Haiea OM, Zakaria RM, AbdEllaty RI, Asr EH, Mansour AI, Abdelrahman AM, Elhady HA
Received 29 May 2017
Accepted for publication 8 August 2017
Published 11 September 2017 Volume 2017:10 Pages 261—268
DOI https://doi.org/10.2147/IJNRD.S142824
Checked for plagiarism Yes
Review by Single anonymous peer review
Peer reviewer comments 2
Editor who approved publication: Professor Pravin Singhal
Ola Galal Behairy,1 Eman Rateb Abd Almonaem,1 Neveen Tawfik Abed,1 Omima M Abdel Haiea,1 Rasha M Zakaria,1 Rania I AbdEllaty,1 Effat H Asr,1 Amira Ibrahim Mansour,2 Amira MN Abdelrahman,2 Hoda A Elhady3
1Pediatric Department, Benha Faculty of Medicine, Benha University, 2Clinical and Chemical Pathology Department, Benha Faculty of Medicine, Benha University, Benha, 3Clinical Pathology Department, General Organization of Teaching Hospitals and Institutes, Egypt
Background: Although advancements have been made in the management of thalassemic patients, many unrecognized complications have emerged, such as renal abnormalities.
Aim: To measure serum levels of cystatin-C and β-2 microglobulin in children with beta-thalassemia major (β-TM) and investigate their significance as early markers of glomerular and tubular dysfunctions.
Subjects and methods: The study was performed on 70 children with (β-TM) and 20 apparently healthy children matched for age and sex as a control group. For all the enrolled children, a comprehensive medical history was obtained and complete physical examination was performed, blood urea, serum creatinine, serum ferritin, estimated glomerular filtration rate (eGFR) by Schwartz formula and creatinine clearance, albumin/creatinine ratio in urine, serum cystatin-C levels and β-2 microglobulin were measured.
Results: Thalassemic children had significantly higher cystatin-C and β-2 microglobulin levels compared with control. In addition, serum cystatin-C and β-2 microglobulin were positively correlated with urea, creatinine, serum ferritin, albumin/creatinine ratio, duration of chelation therapy and frequency of blood transfusion/year and negatively correlated with creatinine clearance, hemoglobin, and eGFR. Our data demonstrated that cystatin-C and β-2 microglobulin had higher sensitivity and specificity (91.4%, 90.0%, and 85.7%, 100%, respectively) than serum creatinine and creatinine clearance (83.0%, 100% and 81.4%, 100%, respectively) for small changes in GFR.
Conclusion: Cystatin-C and β-2 microglobulin are specific and sensitive early biomarkers for monitoring glomerular and tubular dysfunction in children with β-TM.
Keywords: beta thalassemia, creatinine, sensitivity, specificity
Introduction
Beta-thalassemia major (β-TM) is an autosomal recessive hereditary anemia in which there is incomplete production of 1 globulin chain forming hemoglobin (Hb) molecule; usually, patients of beta thalassemia require blood transfusion in the first year of life.1 With advances in treatment and chelating agents of β-TM patients, new unrecognized complications have emerged, such as renal complications.2 Many factors contribute to the functional abnormalities found in β-TM patients such as decreased red cell life span, rapid iron turnover, and tissue deposition of excess iron and also, specific iron chelators can affect kidneys.3 β-TM patients usually suffer from several complications like cardiopulmonary, reticuloendothelial and other major systems dysfunctions.4 Chronic hypoxia, iron overload and desferrioxamine (DFO) toxicity are the main contributors to renal dysfunction in β-TM patients.5 Several studies have demonstrated that proximal tubular dysfunction, proteinuria, aminoaciduria, and low urine osmolarity are common complications among β-TM patients.6,7 Cystatin-C is low-molecular-weight non-glycosylated protein that can inhibit cysteine protease, synthesized and secreted by all human nucleated cells.8 Cystatin-C is a sensitive biomarker for glomerular filtration rate (GFR) and not secreted by the renal tubules or reabsorbed back into the serum. It is better than creatinine clearance in the diagnosis of renal function impairment, as it is not affected by height, sex, diet, and muscle mass.9 β-2 microglobulin is a low-molecular-weight protein that is freely filtered by glomeruli, reabsorbed by renal tubule and destroyed. The amount of serum β-2 microglobulin is very low in the healthy individuals, but its level increases in case of inflammatory, immunologic and neoplastic events.10 Although the early identification of patients at high risk of renal dysfunction is of great importance as it may allow specific measures to be taken to delay renal impairment, there are limited studies about renal dysfunction in pediatric thalassemic patients. In this study, we aimed to measure serum cystatin-C and β-2 microglobulin and investigate their significance as early markers of glomerular and tubular dysfunctions in children with β-TM.
Subjects and methods
Subjects
This case–control study was conducted on patients attending the hematology clinic of pediatrics department, Benha University Hospitals during the period April 2015 to April 2016. Two groups of children were enrolled: group I included 70 children diagnosed with β-TM, their diagnosis was based on standard criteria, including Hb electrophoresis, regularly transfused with packed RBCs and receiving chelation therapy in regular manner.11 The exclusion criteria included history suggestive of recurrent urinary tract infections or systemic diseases that affect the kidney, history of intake of nephrotoxic drugs and family history of hereditary renal diseases. Group II included 20 apparently healthy children matched for age and sex as a control group. The study was approved by the local ethical committee of the pediatrics department of Benha University. Informed written consent was obtained from the parents or caregivers of enrolled children after explanation of the study.
Methods
Enrolled children were subjected to:
- thorough history taking with stress on age at first transfusion, type of chelator, duration of chelation, compliance to chelation therapy and history of splenectomy,
- clinical examination, including the anthropometric measures, pubertal stage by Tanner’s classification, clinical evidence of complications of iron overload and skin hemosiderosis.
- laboratory investigations
Sampling
Blood sample
Venous blood 5 mL was drawn under complete aseptic conditions and distributed as follows:
- (a) whole blood 1 mL was taken in an EDTA vacutainer and mixed gently. This sample was used to measure complete blood count, which was performed by automated hematology system (Sysmex XE 5000; Sysmex America, Inc., Mundelein, IL, USA).12
- (b) samples of blood, 4 mL,were taken in plain test tubes without anticoagulant. The samples were allowed to clot for 30 mins at room temperature, then centrifuged for 15 mins at 1000× g. The serum was removed, aliquoted and stored at ≤−20°C until assayed. The separated serum was used for the following assays:
- serum creatinine and urea: using Biosystem A15 auto-analyzer (Biosystems S.A., Barcelona, Barcelona, Spain) by appropriate chemical principles
- estimated glomerular filtration rate (eGFR) was calculated using Schwartz formula for children13: eGFR (mL/min/1.73 m2)=height (cm)×constant/serum creatinine (mg/dL), where height was expressed in “cm” and constants were 0.44 (for children <2 years) and 0.55 (for children ≥2 years). Renal dysfunction was defined as eGFR <90 mL/min/1.73 m2
- serum ferritin (μg/dL) was estimated by enzyme-linked immunosorbent assay (ELISA;R&D Systems, Minneapolis, MN, USA)
- serum cystatin-C levels were measured using human ELISA (sandwich technique) kits provided by Sunbio, Donghu Hi-Tech, Shanghai, China (Cat. No. CSB-E08384h) with assay range (7.81–500 ng/mL)
- serum β-2 microglobulin was measured using human ELISA (sandwich technique) kits provided by IBL International, GMBH, Hamburg, Germany (ID: 59041) with assay range (0–2.5 mg/L)
Urine sample
- the second-morning midstream urine sample of 5 mL was obtained. The urine sample was centrifuged within 1 h of sampling and used for creatinine and albumin estimation. Albumin/creatinine ratio was estimated in urine according to the guidelines of the National Kidney Foundation14
- daily assessment of urine output: 24 h urine output measurement was performed by using plastic collection bag
Statistical methods
Statistical analysis was performed using SPSS version 16 software (Spaces Inc, Chicago, IL, USA). All results were expressed as mean and SD values for parametric data and median, Student’s t-test was used for mean values. Mann–Whitney test for non-parametric quantitative data and Chi-square test for comparing categorical variables. Pearson correlation and Spearman’s who were used for correlation in parametric and non-parametric data, respectively. A receiver operating characteristic (ROC) curve with a 95% CI was used for optimal cutoff point was chosen. For all analyses, the level of significance was set at P<0.05.
Results
The study was conducted on 90 children aged (3–18 years). They were divided into 2 groups: group I included 70 thalassemic children with a mean age (10.41±3.86 years); they were 47 (67.1%) males and 23 (32.9%) females. Group II included 20 apparently healthy children; age and sex matched as a control group, with a mean age (8.6±3.47 years), they were 11 (55%) males and 9 (45%) females. There were statistically significant increases in patients group regarding their family history of thalassemia, consanguinity and head circumference and statistically significant decreases in weight, height, and body mass index than the control group (Table 1). Clinical manifestations of the studied patients were as follows: the most presenting symptoms were moderate-to-severe degree of pallor and hepatomegaly in all patients 100%, jaundice in 95.7%, and splenomegaly in 75.7% with splenectomy performed in 14.3% of cases, the incidence of mongoloid features was 81.4%. The onset of first blood transfusion presented early in life (mean=0.71±0.43 years), age onset of iron chelation therapy was mean 2.71±0.43 years and it was as follows: 60% of cases were treated by deferoxamine (Dysferal) subcutaneous infusion, 32.9% were treated by deferasirox (Exjade) and 7.1% by Hydra.
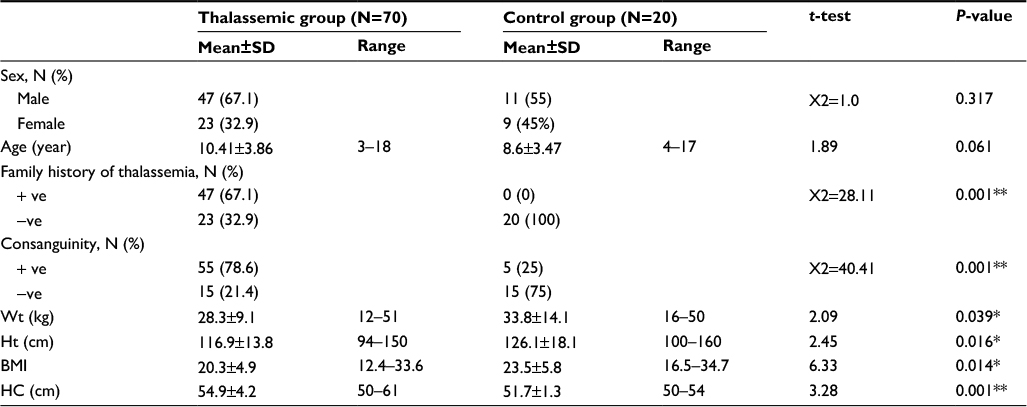 | Table 1 Socio-demographic characteristics of studied groups Notes: *significant; **highly significant. Abbreviations: BMI, body mass index; HC, head circumference; Ht, height; Wt, weight. |
There were statistically significant differences between the studied groups regarding their mean corpuscular volume (MCV), red blood cell distribution width (RDW), Hb as the Hb was significantly lower among thalassemic patients (ranged from 6.1 to 10.9 gm/dL with mean 8.64±0.92 gm/dL) than the control group (ranged from 11.8 to 14 gm/dL with mean 12.81±0.68 gm/dL), mean corpuscular hemoglobin concentration (MCHC) in thalassemic and control group was 36.81±1.29 g/dL and 34.31±1.67 g/dL, respectively, P=0.001, while serum ferritin was higher in thalassemic patients than the control group (mean=1430±575.9 µg/dL versus 38.04±16.03 µg/dL P=0.001), respectively.
There were statistically significant increases in the thalassemic group when compared with the control group regarding urea (mean=28.96±7.61 and 17.99±3.07 mg/dL, respectively), creatinine (mean=1.03±0.19 mg/dL and 0.54±0.08 mg/dL, respectively), urea/creatinine ratio (mean=61.29±23.95 and 26.25±1.52, respectively), cystatin-C (mean =1.61±1.36 ng/mL and 0.40±0.23 ng/mL, respectively), β-2 microglobulin (mean=5.95±2.28 mg/L and 0.94±0.48 mg/L, respectively), urinary albumin/creatinine ratio (mean =54.82±31.34 mg/mmol and 1.47±0.88 mg/mmol, respectively), while the thalassemic group showed statistically significant decrease in the urine volume (mean=512.14±113.07 mL and 855.0±129.68 mL, respectively), creatinine clearance (mean=62.97±23.07 mL/min and 98.84±7.67 mL/min, respectively) and eGFR (mean=71.17±12.1 mL/min/1.73 and 124.99±21.51 mL/min/1.73, respectively) (Table 2).
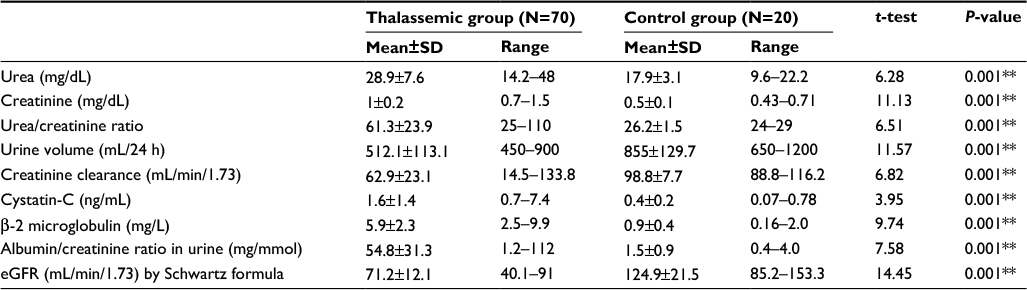 | Table 2 Comparison between the studied groups regarding laboratory investigations indicating renal function tests Notes: *significant; **highly significant. Abbreviation: eGFR, estimated glomerular filtration rate. |
There were statistically significant positive correlations between cystatin-C and urea (r=0.661, P=0.003), creatinine (r=24, P=0.047), serum ferritin (r=0.432, P=0.001), β−2 microglobulin (r=0.636, P=0.003), albumin/creatinine ratio (r=0.587, P=0.003), duration of chelation therapy (r=0.523, P=0.001) and frequency of blood transfusion/year (r=0.661, P=0.001), while there were statistically significant negative correlations between cystatin-C and creatinine clearance (r=−0.620, P=0.003), Hb (r=−0.603, P=0.001) and eGFR (r=−0.621, P=0.001). There were statistically significant positive correlations between β-2 microglobulin and urea (r=0.528,P=0.001) creatinine (r=0.537, P=0.001), serum ferritin (r=0.24, NP=0.046), cystatin-C (r=0.449, P=0.001) albumin/creatinine ratio (r=0.521, P=0.003), duration of chelation therapy (r=0.583, P=0.003) and frequency of blood transfusion/year (r=0.657, P=0.001), and there were statistically significant negative correlations between β-2 microglobulin and creatinine clearance (r=−0.247, P=0.039), Hb (r=−0.240, P=0.046) and eGFR (r=−0.721, P=0.001) (Table 3).
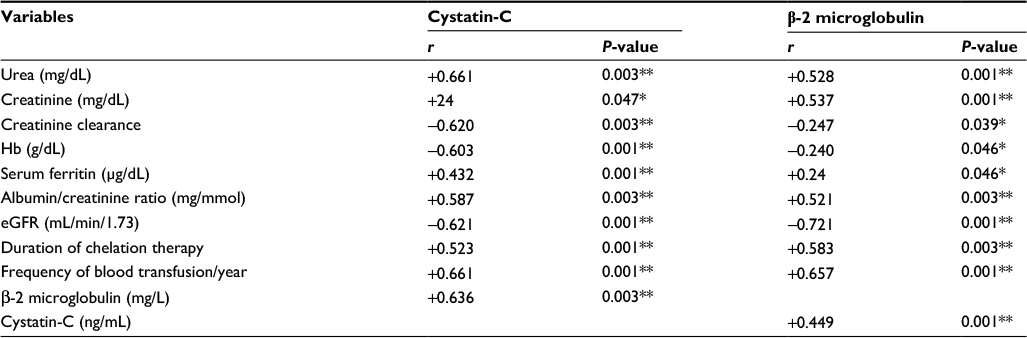 | Table 3 Correlations between cystatin-C, β-2 microglobulin and other parameters indicating impairment of renal function in patients group Notes: *significant; **highly significant. Abbreviation: eGFR, estimated glomerular filtration rate. |
Multiple linear regression analysis indicated that cystatin-C (β=4.61, P=0.041, 95% CI: 31.22–42.12) and β-2 microglobulin (β=17.89, P=0.001, 95% CI: 1.84–2.14) were independently associated with glomerular and tubular dysfunctions in children with major thalassemia.
ROC curve analysis revealed that at cutff 0.74 mg/L, cystatin-C gave 91.4% sensitivity, 90% specificity, 97% positive predictive values (PPV), 75% negative predictive values (NPV) and area under curve was 0.989±0.009, while best cutoff for serum creatinine level was 0.85 mg/dL gave 78.6% sensitivity, 85% specificity, 94.8%, PPV, 53.1% NPV and area under curve was 0.999±0.002, while creatinine clearance at cutoff 83.15 mL/min gave 81.4% sensitivity, 100% specificity, 100% PPV, 60.6% NPV and the best cutoff for β-2 microglobulin was 3 mg/L with sensitivity 85.7%, specificity 100%, PPV 100% and NPP 66.7% (Table 4 and Figure 1).
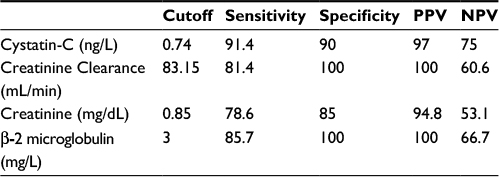 | Table 4 Diagnostic accuracy of cystatin-C, creatinine clearance, creatinine and β-2 microglobulin as diagnostic tools for renal affection in thalassemic patients Abbreviations: PPV, positive predictive values; NPV, negative predictive values. |
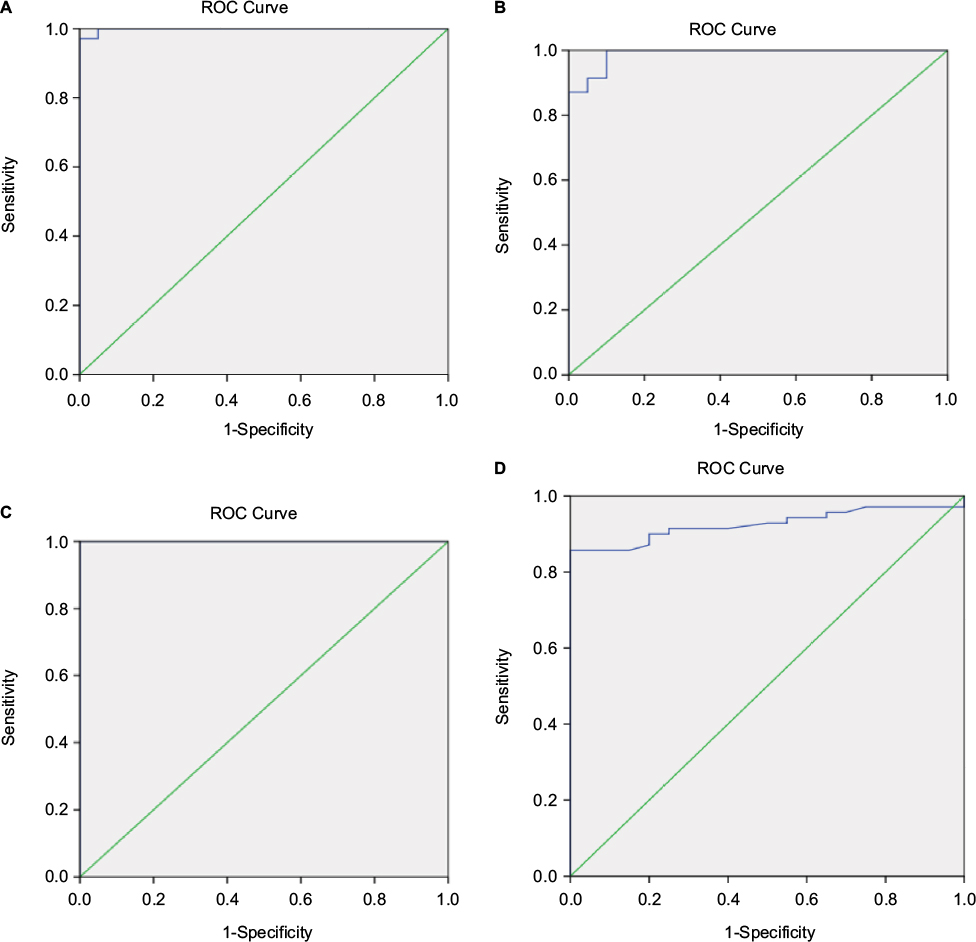 | Figure 1 ROC curve analysis of (A) creatinine, (B) cystatin-C, (C) β-2 microglobulin and (D) creatinine clearance as a diagnostic tool for renal affection in thalassemic patients. Diagnonal segments are produced by ties. Abbreviation: ROC, receiver operating characteristic. |
Discussion
The underlying mechanisms for tubulopathy in patients with β-TM include long-standing anemia, chronic hypoxia, and iron overload and DFO.6 In the present study, thalassemic patients showed higher levels of urea, creatinine, urea/creatinine ratio, cystatin-C, β-2 microglobulin, and albumin/creatinine ratio, lower levels of urine volume, creatinine clearance and eGFR than controls. These results agree with Ali and Mahmoud, as they found significantly higher levels of cystatin-C, serum creatinine, serum ferritin and albumin/creatinine ratio in the urine of thalassemic group than controls. Furthermore, they had significantly lower eGFR and creatinine clearance than controls (P=0.001 and 0.04, respectively).15 Also, these results are in concordance with Hamed and ElMelegy, who reported significantly higher levels of serum cystatin-C, creatinine and urinary albumin/creatinine, while significant lower levels of eGFR in thalassemic patients than controls.16 Kacar et al found that- β-2 microglobulin and urea levels were increased in the thalassemic patients group in comparison with control group, while no statistically significant differences were observed between thalassemic patients group and control group with regard to serum cystatin-C, serum creatinine and creatinine clearance, which supports the evidence that chronic hypoxia occurs due to anemia-disrupted kidney function.17
In contrast to our findings, Koliakos et al found normal serum creatinine and creatinine clearance in thalassemic patients who received subcutaneous deferoxamine treatment.18 Also, Economou et al showed no statistically significant differences between the thalassemia patients and the control regards creatinine clearance.5
In the present study, there were statistically significant positive correlations between cystatin-C and urea, creatinine, serum ferritin, β-2 microglobulin, albumin/creatinine ratio, duration of chelation therapy and frequency of blood transfusion/year, and there were statistically significant negative correlations between creatinine clearance, Hb and eGFR. These results are in agreement with Ali and Mahmoud, who stated that cystatin-C had highly significant negative correlations with eGFR and creatinine clearance and a significant strong positive correlation with serum ferritin. These results support the idea that cystatin-C gives a good estimate of GFR, more accurate and precise than other methods. They concluded that glomerular dysfunction in β-TM is not a rare complication, so the early markers such as cystatin-C are useful for early detection of small changes in GFR, and periodic renal assessment of those patients is mandatory as many of them may have hidden renal affection.15 Hamed and ElMelegy also reported that cystatin-C showed significant positive correlation with serum creatinine (r=0.659, P<0.001).16 Also, Economou et al reported that 36% of their β-thalassemia patients had elevated serum cystatin-C, suggesting that cystatin-C is superior to serum creatinine for detection of impaired GFR in cross-sectional studies.5
In this study, there were statistically significant positive correlations between β-2 microglobulin and urea, creatinine, serum ferritin, cystatin-C, albumin/creatinine ratio, duration of chelation therapy and frequency of blood transfusion/year, and there were statistically significant negative correlations between β-2 microglobulin, creatinine clearance, Hb and eGFR. This is in agreement with Voskaridou et al who stated that cystatin-C and serum β-2 microglobulin had strong correlations with creatinine clearance and age, and found inverse correlations between Hb and β-2 microglobulin and cystatin-C levels.19
Herrero-Morin et al also found a positive correlation between serum β-2 microglobulin and cystatin-C as both reflect the decrease in the renal function and negative correlation between serum β-2 microglobulin and Hb, serum creatinine and cystatin-C by 24 h urine. They documented that impaired renal function and hyperproduction of β-2 microglobulin are both associated with increased serum levels. So, it is suggested that β-2 microglobulin concentration in the blood is largely affected by the changes in the GFR.20
In the present study, the best cutoff for serum creatinine level was 0.85 mg/dL, with 83% sensitivity, 100% specificity, and the best cutoff for serum cystatin-C level was 0.74 ng/mL; at this level, the diagnostic sensitivity was 91.4%, specificity 90.0%, while creatinine clearance at cutoff was 83.15 mL/min gave 81.4% sensitivity, 100% specificity.
Narvaez-Sanchez et al found that with using a GFR of 90 mL/min as a cutoff value, serum cystatin-C had sensitivity 75%, specificity 84%, and area under ROC curve (AUROC) 0.84, and serum creatinine had a sensitivity 46%, specificity 100%, and AUROC 0.72. With using a GFR of 70 mL/min as a cutoff value, serum cystatin-C had sensitivity 100%, specificity 48% and AUROC 0.94, and serum creatinine had a sensitivity 77%, specificity 91% and AUROC 0.81 and they concluded that cystatin-C is a very interesting option, and could be a replacement to serum creatinine for diagnosing and possibly monitoring kidney function in children.21
Ali and Mahmoud found that AUROC for serum cystatin-C was significantly higher than that for serum creatinine (92% versus 80%). Moreover, serum cystatin-C had higher sensitivity and specificity than serum creatinine (66% versus 26%). The AUROC for serum cystatin-C was significantly higher (0.84±0.03) than that for creatinine clearance (0.35±0.05). Moreover, serum cystatin-C had higher sensitivity and specificity than creatinine clearance (66% versus 62% and 92% versus 65%, respectively).15
It is well known that cystatin-C is a valuable marker for cardiovascular morbidity and mortality in diabetes and metabolic syndrome;22–24 previous studies demonstrated the relationship between arterial stiffness and renal insufficiency, including vascular structure changes, increased atherogenic lipoprotein, decreased fibrinolysis and oxidative stress; these studies demonstrated that endothelial dysfunction is the main link between renal insufficiency and cardiovascular diseases.25–27
In the present study, the best cutoff for β-2 microglobulin was 3 μg/mL; at this level, the diagnostic sensitivity was 85.7%, specificity 100%, the diagnostic accuracy was 88.9% and the area under the ROC curves was 1.
This is in agreement with Filler et al who stated that the areas under the ROC curves for cystatin-C were 0.943, for β-2 microglobulin 0.899, and for Schwartz GFR estimate was 0.917 with no statistically significant difference (P>0.05), although there was a tendency toward the best area for cystatin-C. The area under the curve for creatinine (0.840) was significantly smaller than that for cystatin-C (the difference between areas, 0.103; SE, 0.031; P<0.001), and the Schwartz GFR estimate (the difference between areas, 0.080; SE, 0.021; P<0.001). The clinical sensitivities and specificities were calculated at selected decision points of the ROC curves, cystatin-C revealed higher sensitivities than creatinine, β-2 microglobulin, and the GFR estimate (61% versus 29%, 38%, and 31%, respectively) for reduced GFR. At the cutoff with a diagnostic specificity of 95%, cystatin-C (80%) had higher sensitivities than serum creatinine (35%) and β-2 microglobulin (32%), but not higher than that of Schwartz GFR estimate (68%).28
Also, Donadio et al found that cystatin-C, β-2 microglobulin and retinol-binding protein rapidly increased by reduction in GFR, they increased in the order of β-2 microglobulin, cystatin-C and RBP, particularly as GFR was <20 mL/min/1.73 m2, although the diagnostic accuracy of cystatin-C and β-2 microglobulin was similar to creatinine in different degrees of GFR. When GFR levels were measured higher than 80 mL/dk/1.73 m2, all renal parameters (creatinine, cystatin-C and β-2 microglobulin) were detected close to the upper limits, but within normal values.29
Conclusion
Cystatin-C and β-2 microglobulin are specific and sensitive early markers for monitoring glomerular and tubular dysfunction. As glomerular dysfunction in β-TM is not a rare complication, periodic renal assessment of renal patients are mandatory as they may be affected by hidden renal dysfunction.
Acknowledgments
We thank Yehia H AbdElmaksoud, MD, PhD, Pediatric Department, Benha Faculty of Medicine, Benha University, Egypt; Email [email protected]; and Rashad AbdElhakim, MD, PhD, Pediatric Department, Benha Faculty of Medicine, Benha University, Egypt; Email [email protected] for their support in this work.
Disclosure
The authors report no conflicts of interest in this work.
References
Weatherall DJ. The Thalassemia. In Ernest B, Erslev AJ, Lichtman MA, Williams WJ. Hematology. 6th ed. New York: McGraw-Hill Book Company; 2000:547–580. | ||
Musallam KM, Taher AT. Mechanisms of renal disease in β-thalassemia. J Am Soc Nephrol. 2012;23(8):1299–1302. | ||
Ponticelli C, Musallam KM, Cianciulli P, Cappellini MD. Renal complications in transfusion-dependent beta thalassemia. Blood Rev. 2010;24(6):239–244. | ||
Forget B, Thalassemia syndrome. Hematology Basic Principles and Practice. 3rd ed. NewYork: Churchill Livingstone; 2000:485–510. | ||
Economou M, Printza N, Teli A, et al. Renal dysfunction in patients with beta-thalassemia major receiving iron chelation therapy either with deferoxamine and deferiprone or with deferasirox. Acta Haematol. 2010;123(3):148–152. | ||
Smolkin V, Halevy R, Levin C, et al. Renal function in children with beta-thalassemia major and thalassemia intermedia. Pediatr Nephrol. 2008;23(10):1847–1851. | ||
Sadeghi-Bojd S, Hashemi M, Karimi M. Renal tubular function in patients with beta-thalassaemia major in Zahedan, southeast Iran. Singapore Med J. 2008;49(5):410–412. | ||
Rander E, Erlandsen EJ. Serum cystatin-C as an endogenous marker of the renal function, a review. Clin Chem Lab Med. 1999;37(4):389–395. | ||
Tanaka A, Suemaru K, Araki H. A new approach for evaluating renal function and its practical application. J Pharmacol Sci. 2007;105(1):1–5. | ||
Schardijn GH, Statius Van Eps LW. Beta-2 microglobulin: its significance in the evaluation of renal function. Kidney Int. 1987;32(5):635–641. | ||
Koren G, Kochavi-Atiya Y, Bentur Y, Olivieri NF. The effects of subcutaneous deferoxamine administration on renal function in thalassemia major. Int J Hematol. 1991;54(5):371–375. | ||
England JM, Rowan RM, van Assendelft OW, et al. Protocol for evaluation of automated blood cell counters. International Committee for Standardization in Hematology (ICSH). Clin Lab Haematol. 1984;6(1):69–84. | ||
Schwartz GJ, Brion LP, Spitzer A. The use of plasma creatinine concentration for estimating glomerular filtration rate in infants, children, and adolescents. Pediatr Clin North Am. 1987;34(3):571–590. | ||
National Kidney Foundation. K/DOQI clinical practice guidelines for chronic kidney disease: evaluation, classification, and stratification. Am J Kidney Dis. 2002;39(2 Suppl 1):S1–S266. | ||
Ali BA, Mahmoud AM. Frequency of glomerular dysfunction in children with beta-thalassemia major. Sultan Qaboos Univ Med J. 2014;14(1):e88–e94. | ||
Hamed EA, ElMelegy NT. Renal functions in pediatric patients with thalassemia major: relation to chelation therapy: original prospective study. Ital J Pediatr. 2010;36(1):39. | ||
Kacar AG, Silfeler I, Kacar A, Pekun F, Turkkan E, Adal E. Levels of beta-2 microglobulin and cystatin C in beta thalassemia major patients. J Clin Anal Med. 2015;6(3):269–273. | ||
Koliakos G, Papachristou F, Koussi A, et al. Urine biochemical markers of early renal dysfunction are associated with iron overload in beta-thalassemia. Clin Lab Haematol. 2003;25(2):105–109. | ||
Voskaridou E, Terpos E, Michail S, et al. Early markers of renal dysfunction in patients with sickle cell/beta-thalassemia. Kidney Int. 2006;69(11):2037–2042. | ||
Herrero-Morin JD, Malaga S, Fernandez N, et al. Cystatin C and beta2-microglobulin: markers of glomerular filtration in critically ill children. Crit Care. 2007;11(3):R59. | ||
Narvaez-Sanchez R, Gonzalez L, Salamanca A, et al. Cystatin C could be a replacement to serum creatinine for diagnosing and monitoring kidney function in children. Clin Biochem. 2008;41(7–8):498–503. | ||
Urbonaviciene G, Shi GP, Urbonavicious S, Heenberg EW, Lindholt JS. Higher cystatin C level predicts long-term mortality in patients with peripheral arterial disease. Atherosclerosis. 2011;216(2):440–445. | ||
Ogawa Y, Goto T, Tamasawa N, et al. Serum cystatin C in diabetic patients. Not only an indicator for renal dysfunction in patients with overt nephropathy but also a predictor for cardiovascular events in patients without nephropathy. Diabetes Res Clin Pract. 2008;79(2):357–361. | ||
Satoh-Asahara N, Suganami T, Majima T, et al. Urinary cystatin C as a potential risk marker for cardiovascular disease and chronic kidney disease in patients with obesity and metabolic syndrome. Clin J Am Soc Nephrol. 2011;6(2):265–273. | ||
Shlipak MG, Katz R, Sarnak MJ, et al. Cystatin C and prognosis for cardiovascular and kidney outcomes in elderly persons without chronic kidney disease. Ann Intern Med. 2006;145(4):237–246. | ||
Peralta CA, Shlipak MG, Judd S, et al. Detection of chronic kidney disease with creatinine, cystatin C, and urine albumin-to-creatinine ratio and association with progression to end-stage renal disease and mortality. JAMA. 2011;305(15):1545–1552. | ||
Vigil L, Lopez M, Condés E, et al. Cystatin C is associated with the metabolic syndrome and other cardiovascular risk factors in a hypertensive population. J Am Soc Hypertens. 2009;3(3):201–209. | ||
Filler G, Priem F, Lepage N, et al. Beta-trace protein, cystatin C, beta (2)-microglobulin, and creatinine compared for detecting impaired glomerular filtration rates in children. Clin Chem. 2002;48(5):729–736. | ||
Donadio C, Lucchesi A, Ardini M, Giordani R. Cystatin C, β2-microglobulin, and retinol-binding protein as indicators of glomerular filtration rate: comparison with plasma creatinine. J Pharm Biomed Anal. 2001;24(5–6):835–842. |
 © 2017 The Author(s). This work is published and licensed by Dove Medical Press Limited. The full terms of this license are available at https://www.dovepress.com/terms.php and incorporate the Creative Commons Attribution - Non Commercial (unported, v3.0) License.
By accessing the work you hereby accept the Terms. Non-commercial uses of the work are permitted without any further permission from Dove Medical Press Limited, provided the work is properly attributed. For permission for commercial use of this work, please see paragraphs 4.2 and 5 of our Terms.
© 2017 The Author(s). This work is published and licensed by Dove Medical Press Limited. The full terms of this license are available at https://www.dovepress.com/terms.php and incorporate the Creative Commons Attribution - Non Commercial (unported, v3.0) License.
By accessing the work you hereby accept the Terms. Non-commercial uses of the work are permitted without any further permission from Dove Medical Press Limited, provided the work is properly attributed. For permission for commercial use of this work, please see paragraphs 4.2 and 5 of our Terms.