Back to Journals » OncoTargets and Therapy » Volume 9
ROI for outlining an entire tumor is a reliable approach for quantification of lung cancer tumor vascular parameters using CT perfusion
Authors Ma E, An R, Gao B, Yang M, Zhao Q, Wang W, Li K ![]()
Received 11 October 2015
Accepted for publication 1 March 2016
Published 27 April 2016 Volume 2016:9 Pages 2377—2384
DOI https://doi.org/10.2147/OTT.S98060
Checked for plagiarism Yes
Review by Single anonymous peer review
Peer reviewer comments 2
Editor who approved publication: Dr Min Li
Ensen Ma,1 An Ren,1 Baoxiang Gao,1 Minxing Yang,1 Qichao Zhao,1 Wu Wang,1 Kefeng Li2
1Department of Radiology, China–Japan Friendship Hospital, Beijing, People’s Republic of China; 2Department of Medicine, School of Medicine, University of California, San Diego, CA, USA
Objective: To investigate the effect of position and size of tumor region of interest (ROI) on the estimation of lung cancer vascular parameters using 256-slice computed tomography (CT) perfusion.
Methods: After institutional review board approval and written informed consent, 16 men and 11 women with lung cancer were enrolled in this CT perfusion study. Perfusion, blood volume, and peak enhancement were determined for 60 or 120 mm2 circular ROIs placed at the edge, center, and around (outlining) the visible tumor. Average values were obtained by performing ROI analysis twice by the same observers without any procedural changes.
Results: Perfusion, blood volume, and peak enhancement measurements were substantially higher at the edge than at the center for both 60 and 120 mm2 ROIs (all P<0.05). Measurements varied substantially depending on the ROI size. Perfusion, blood volume, and peak enhancement for the ROIs outlining tumor were intermediate between those at the tumor edge and center. There were significant correlations between median values and interquartile ranges as follows; perfusion (12.51 [7.91–28.10] mL·min−1·100 mL−1), blood volume (29.31 [21.82–37.65] mL·100 g−1), peak enhancement (12.93 [2.42–22.50]) for the ROIs outlining the tumor, and microvascular density ([19.43±8.78] vessels/0.74 mm2), respectively (r values were 0.732, 0.590, and 0.544 respectively, all P<0.05).
Conclusion: Spatial and size selection of ROI significantly affects CT perfusion analysis. ROI outlining of entire tumor provides efficient and reliable measurements for clinical assessment of lung cancer using CT perfusion.
Keywords: lung carcinoma, position, size, tomography, X-ray computed, dynamic enhancement, microvessel density
Introduction
Lung cancer is one of the common forms of cancer and is a serious threat across the globe with higher incidence and mortality rates. It has already been proved that the early diagnosis and early treatment can significantly improve the 5-year survival rate of the patients.
Computed tomography (CT) plays an important role in the early diagnosis of lung cancer, especially in the recent 10 years; using CT perfusion imaging method to study the lung cancer has become one of the hot spots in clinical imaging, which includes lung cancer preoperative evaluation and curative effect evaluation.1–4 Vascular parameters obtained from CT perfusion imaging are regarded as an important approach for the evaluation of lung cancer angiogenesis because they are positively correlated with histologic measures, such as microvessel density, blood volume (BV), and blood flow.5
CT perfusion imaging is influenced by many factors, including theoretical model, scanning solutions, and different post-processing methods. Although the tumor vascular parameters, such as permeability–surface area, blood flow, and volume could be obtained from the commercial software, how the measurement of CT perfusion should be performed is still debatable. In particular, the selection of a tumor region of interest (ROI) from which vascular parameters are derived is essential for quantitative measurement. It is unclear whether the entire tumor volume or a representative tumor section should be taken for the selection of ROI. Tumor perfusion is spatially heterogeneous and so far, no studies have systematically reported the influence of the size and position of ROI selection on the tumor assessment in lung cancer using 256-slice spiral CT.
The objective of this study was to investigate the effect of tumor ROI selection on the data post-processing, and to determine its influence on production of tumor vascular parameters in lung cancer using 256-slice CT perfusion imaging. We chose the peripheral lung cancer in this study because it has clear margins, and the whole tumor can be easily outlined.
Materials and methods
Patients
The clinical review board of China-Japan Friendship Hospital approved the prospective study, and subjects were informed of the radiation exposure associated with the 256-slice Multiple detector computed tomography (MDCT) examinations. All participants provided written informed consent to be part of this study. Adult patients with pathology-proved peripheral lung cancer were eligible for this study from January 2012 to November 2012. Forty-seven adult patients (25 men, 22 women; mean age, 62±10 years) were examined. Patients were excluded from the study with the following conditions: renal impairment, known allergy to intravenous contrast material, uncontrolled breathing, and tumor size <3 cm or >5 cm in diameter. Patients with ineffective intravenous contrast injection or poor quality of CT images were also excluded from the study. Finally, a total of 27 patients (16 men and 11 women; average age 60±12 years) with 27 tumors were included in this study. Twelve tumors were located in the left lung. The remaining tumors were in the right lung. Of these patients, 19 tumors were confirmed by surgery and eight were proved by percutaneous biopsy, which included adenocarcinoma (n=20), squamous carcinoma (n=4), and small cell anaplastic carcinoma (n=3).
Only one circle (ROI) in each CT slice is selected. To avoid influence of subjective factors on the results, analysis for each of the circular ROIs was repeated twice. Two independent observers performed the analysis in the same section using the same processing methods. Then, the average measurements of these five groups were obtained.
CT technique
All patients were examined using a 256-slice MDCT scanner (Philips Brilliance 256; Philips Medical Systems, Cleveland, OH, USA). A 19 G cannula (B. Braun, Melsungen, AG, Germany) was placed into the cubital vein while the patient lay supine on the CT table. A chest study was performed initially without intravenous contrast material to identify the CT spatial coordinates of the known lung cancers by using the following parameters: 120 kV, 250 mAs, 0.5 second rotation speed, collimator 128×0.625 mm, pitch 0.993, 5 mm section collimation, 360 cm field of view, and 512×512 matrix. Then, the tumor margins were identified and the scan coordinates were noted, and these coordinates were used to plan the subsequent dynamic study. For the dynamic study, 12 repeated spiral scans that encompassed the entire tumor were subsequently undertaken at 5.8 second intervals. In all patients, 50 mL iodinated contrast medium (Ultravist 300, iopamidol; Schering, Berlin-Wedding Germany) was administrated as a bolus using a pump injector (Meorao-Stellant; Medrad, Inc., Pittsburgh, PA, USA) at a rate of 5 mL/s. The dynamic acquisition commenced 5 seconds after the start of bolus injection, and the total duration time varied from patient to patient, but was ~70 seconds. The following parameters were used: 100 kV; 100 mAs; rotation time 0.33 seconds; table speed 110 mm/s; collimation 128×0.625 mm; pitch 0.758, field of view 350 mm; matrix 512×512. Patients were reminded to breathe gently during the dynamic scan acquisition to minimize movement artifact. Dynamic images were reconstructed with 3 mm section thickness using a standard reconstruction algorithm without edge enhancement at a display window width of 350 Hunsfield units (HU) and a window level of 40 HU.
Image analysis
All the scan data were transferred to a stand-alone workstation (extend brilliance workstation, EBW; Vision4.5.2.40007; Philips Medical Systems). Viewing and analysis were performed using perfusion software package (Body Perfusion protocol; Philips Medical Systems). A deconvolution mathematical model was used to analyze data in this study as previously reported.4,5 The slice with largest solid component of the mass was selected based on contrast levels of enhanced image and pseudo color map analysis. An arterial input was defined by using the mouse to place a circular ROI, 10–20 mm2 in area, in the best-visualized artery (aorta or common carotid artery) on the selected image. Software generated the arterial time enhancement curve and resulting parametric maps, where each pixel represented a parameter value. Tumor perfusion, BV, and peak enhancement measurements were obtained by using different tumor ROIs: 1) a circular ROI of 60 mm2 in area selected from the available perfusion software ROI templates, 2) a circular ROI of 120 mm2 in area selected from the available perfusion software ROI templates, and 3) an ROI defined by tracing a line freehand around the perceived tumor margins by using the cursor and mouse (Figure 1). The circular ROI sizes were chosen for pragmatic reasons, given the size range of the tumors evaluated, to enable nonoverlapping ROI placement at the tumor edge and center, whereas the ROI outlining the tumor was chosen because this method is commonly performed in clinical practice. The circular ROIs were positioned in two different areas within the tumor, the tumor edge and center, by using the mouse. In this study, the tumor center was defined as two-thirds of the tumor around the central area, and peripheral one-third as edge area. When the ROI was placed at the tumor edge or center, care was taken to avoid obvious tumor necrosis area and gross tumor blood vessels, and at the same time attention was paid to avoid partial volume effect. According to the size and location of the ROI, the study was divided into five groups: group 1 for ROI outlining the tumors; groups 2 and 3 for 60 mm2 ROI located at edge and center, respectively; groups 4 and 5 for 120 mm2 ROI located at edge and center, respectively. Figure 1 shows the ROI definition and the classification in lung cancer, from a 56-year-old female patient, as a representative. Mean values were recorded for each of the perfusion parameters: perfusion, BV, and peak enhancement for each ROI.
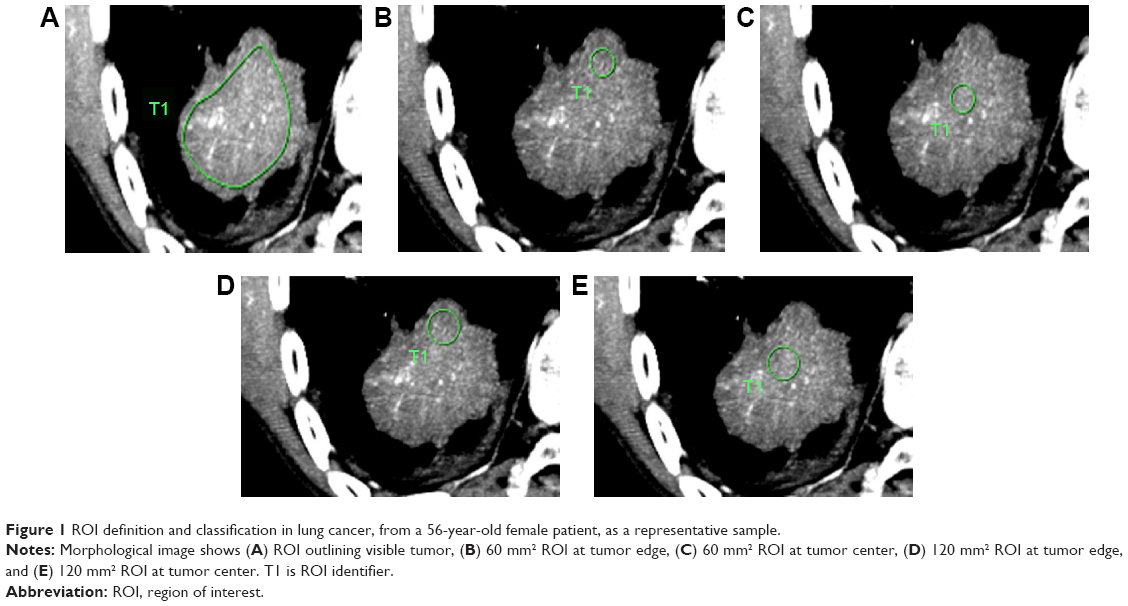 | Figure 1 ROI definition and classification in lung cancer, from a 56-year-old female patient, as a representative sample. |
Data measurement and analysis
The perfusion parameters including perfusion, BV, and peak enhancement index (PEI) were measured and the time density curves were generated in different size and location of ROI. To avoid influence of subjective factors on the results, analysis for each of the circular ROIs was repeated twice. Two independent observers performed the analysis in the same section using the same processing methods. Then, the average measurements of these five groups were obtained, and these values were used as reference to obtain the measurements variability. For measurements with different size and location of ROI, the variability of the measurements was calculated using the percentage difference according to the following equations: perfusion parameters variability = (measured value − average) ×100/mean value.
Histopathological study
Histopathological examination was performed on 19 patient specimens. Tumor tissue specimens were fixed by 10% buffered formalin, embedded in paraffin, and stained by hematoxylin and eosin. We reviewed the tumor block and selected one that comprised the invasion edge and the central part of the tumor for immunochemistry study. Intratumor microvessels were highlighted by staining endothelial cells for CD34 with standard avidin–biotin immunoperoxidase complex technique. Delineated CD34-positive cell as microvessels (diameter 0.02–0.10 mm) were assessed with the use of the modified technique as described by Weidner.6 For microvessel density (MVD) determination, a single countable vessel was defined as any brown-staining endothelial cells clearly separated from adjacent microvessels, tumor cells, and mesenchymal cells. Large vessels with thick muscular walls or lumens larger than approximately eight red blood cells were excluded from the counts. Each sample was examined by light microscopy under low power (×4 objective lens and ×10 ocular lens) to identify six regions for microvessels counting. A ×200 microscopic field (×20 objective lens and ×10 ocular lens) in each of these six regions was then counted, and average value of the six counts was recorded as the representative value of tumor MVD. All tissue sections were reviewed by two independent experienced pathologists without knowledge of the final diagnosis. Discrepancies in interpretation between the pathologists were resolved by consensus.
Statistical analysis
Statistical analysis was performed using commercially available software (SPSS, release 17.0; SPSS Inc., Chicago, IL, USA). Perfusion parameters were normally distributed and the data were summarized with median and range from 25th to 75th percentile of interquartile range, and the square root transform of perfusion parameters was used. Paired t-test was used for comparing differences between the measurements in five groups. Spearman’s rank correlation (nonparametric) coefficients were calculated to represent the relationships between the perfusion parameters and MVD of the tumor. One-way analysis of variance followed by Least significant difference test (LSD) method of multiple comparisons were used to calculate perfusion parameters variability among the five groups; P-values <0.05 were considered to indicate a statistically significant difference.
Results
Tumor ROI position and size
Perfusion, BV, and PEI measurements were substantially higher at the tumor edge than at the tumor center for both the 60 and 120 mm2 ROIs (all P<0.05). Measurements for the ROI outlining the tumor were intermediate (between measurements for the tumor edge and tumor center) (Table 1 and Figure 1). There were significant differences between perfusion, BV, and PEI measurements in each group (all P<0.05).
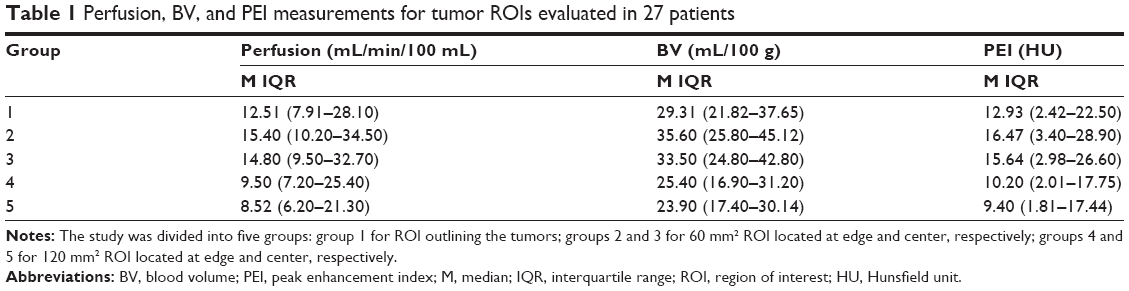 | Table 1 Perfusion, BV, and PEI measurements for tumor ROIs evaluated in 27 patients |
The comparison of perfusion parameters variability in five groups
The perfusion, BV, and PEI value variances are statistically significantly different from those parameters measured using the same size ROI in the edge and center, or using 60 and 120 mm2 ROI in the same position (all P<0.05). In addition, there are also significant differences in the values variance of mean differences between groups (outlining tumor ROI vs 60 mm2 ROI, or outlining tumor ROI vs 120 mm2 ROI, all P<0.05). The smallest measurements variability is group 1 (Table 2 and Figure 2).
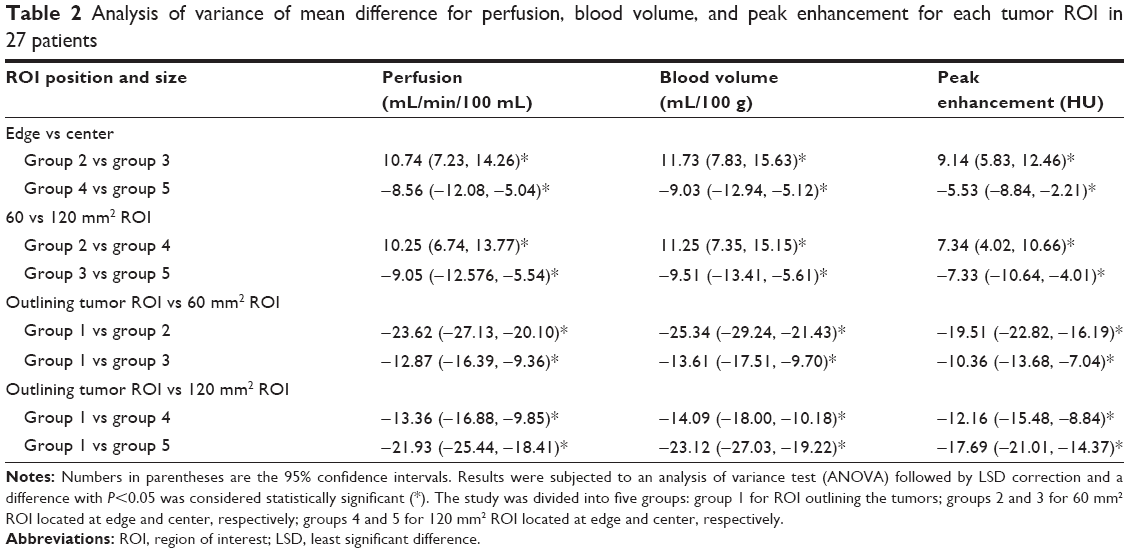 | Table 2 Analysis of variance of mean difference for perfusion, blood volume, and peak enhancement for each tumor ROI in 27 patients |
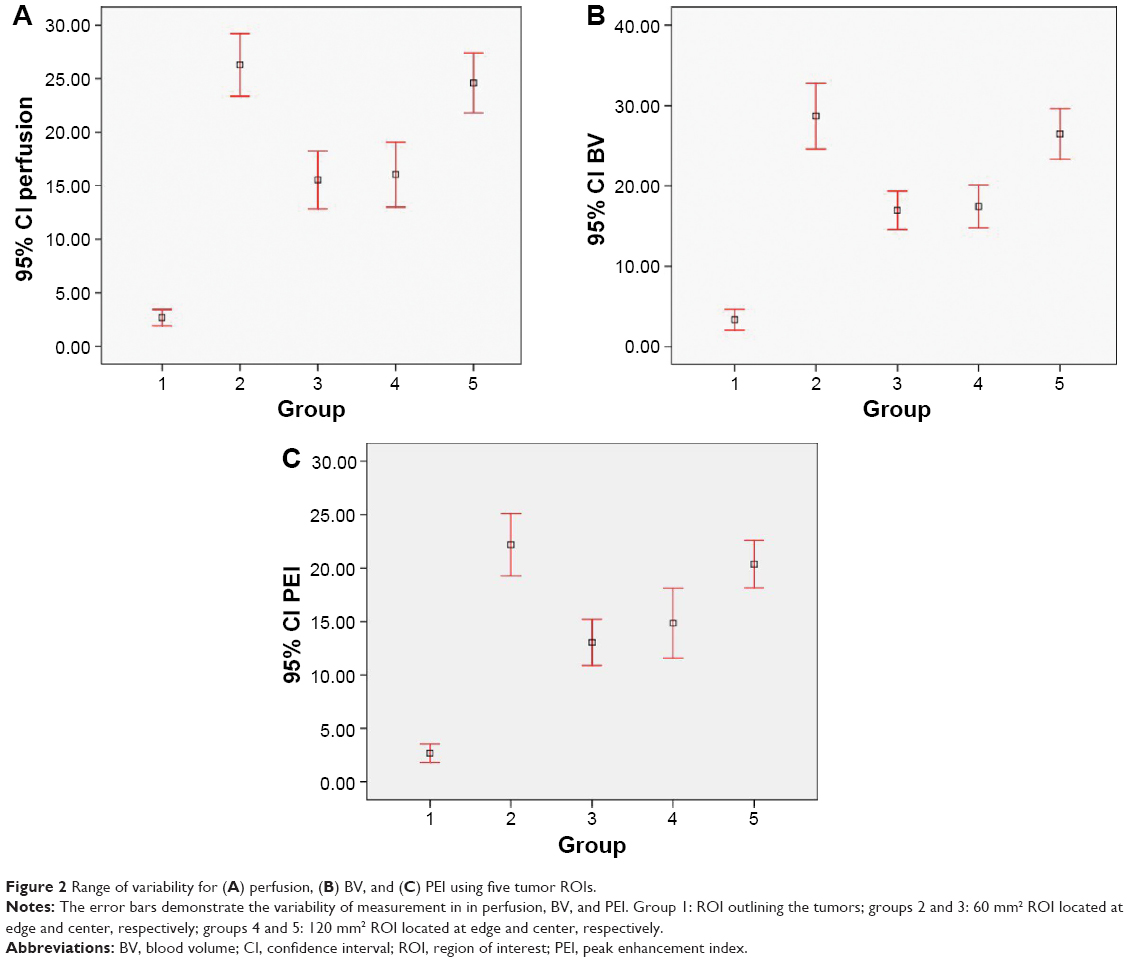 | Figure 2 Range of variability for (A) perfusion, (B) BV, and (C) PEI using five tumor ROIs. |
The average MVD number is (19.43±8.78)/0.74 mm2 in 19 cases of lung cancer. The analysis of 19 cases of lung cancer group perfusion parameters and MVD were conducted in double factors analysis, and the perfusion value, BV, and PEI were positively correlated with MVD, among which group 1 was the best, especially the relationship between the group perfusion value and MVD (r=0.732, P<0.05) (Table 3). As shown in Figure 3, the dynamic contrast CT image demonstrated the inhomogeneous mass with low density area, and the average MVD number is 28.2/0.74 mm2, which positively correlated the type of time density curve with slow rising and slow descending.
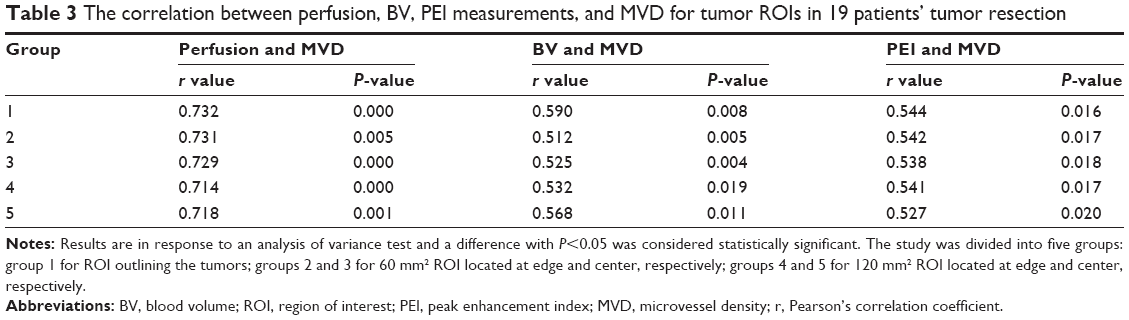 | Table 3 The correlation between perfusion, BV, PEI measurements, and MVD for tumor ROIs in 19 patients’ tumor resection |
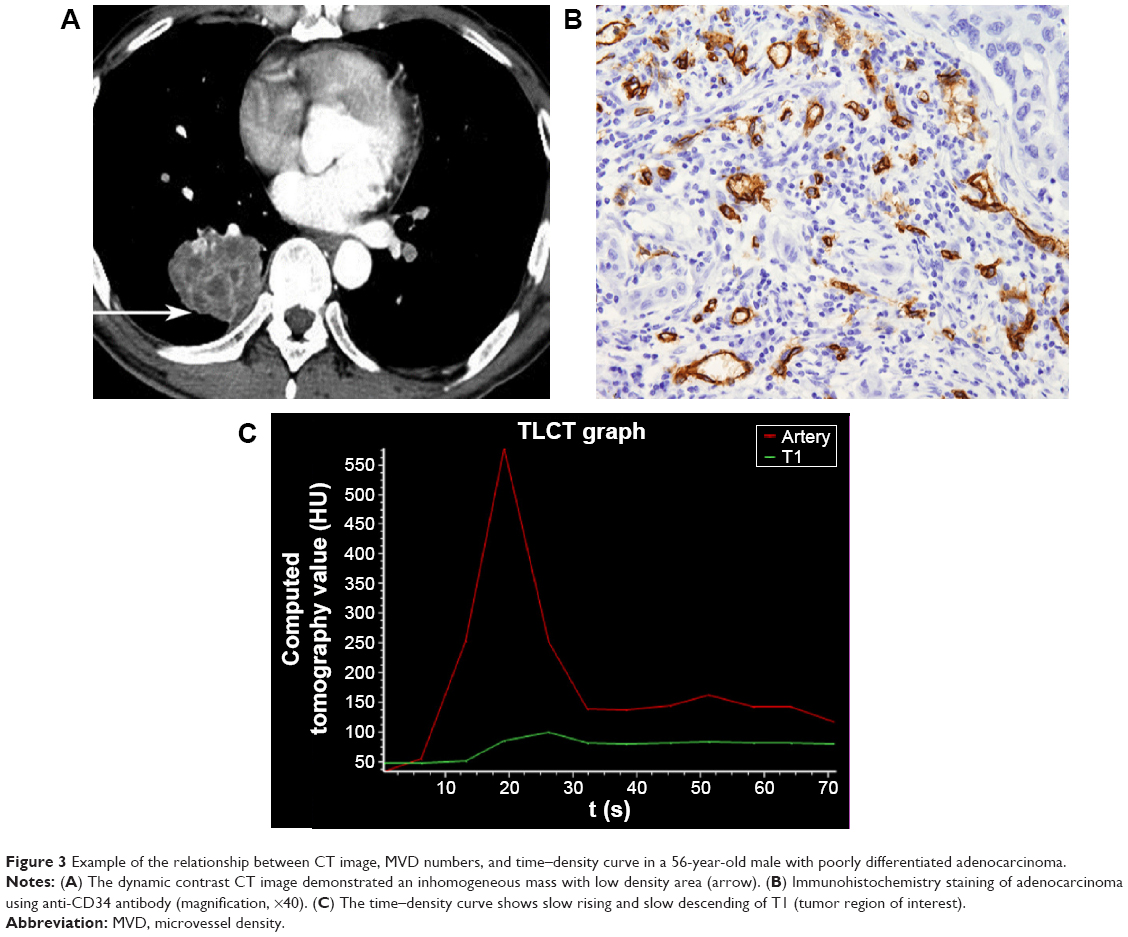 | Figure 3 Example of the relationship between CT image, MVD numbers, and time–density curve in a 56-year-old male with poorly differentiated adenocarcinoma. |
Discussion
Previous studies have shown that the tumor CT perfusion imaging could potentially indicate the tumor angiogenesis of microvascular changes in vivo, and can be more accurate in tumor staging and grading, as well as help to indicate prognosis and treatment of the cancer.7–11 Good reproducibility is essential for any clinical measurements to have practical utility. There were many factors that led to the differences between perfusion parameters, in addition to the different machines, scanning technology, the operator’s subjective bias and the patient’s individual difference factors. However, the most important factor may be the tumor heterogeneity in both space and time. The tumor blood vessels are unstable and changed in histology. This study was to prospectively determine whether position and size of tumor ROI influence the estimation of lung cancer vascular parameters using 256-slice CT perfusion.
In this study, we found that the position of the tumor ROI significantly influenced derived estimates of tumor perfusion. In terms of location, when ROIs of 60 and 120 mm2 were used, the estimates of perfusion, BV, and PEI were higher at the tumor edge than that at the tumor center (all P<0.05). These findings were consistent with the previous morphologic study about the distributions of vessels in colorectal cancers.12,13 So far, no pathological studies in lung cancer have included the influence of the distribution of microvessels.12–14 A colorectal cancer pathology study using microvessel corrosion casting and electron scanning microscopy indicated that tumor vessels demonstrate a zonal distribution regardless of tumor size.12 Vascularity decreased from the tumor edge to the center with the poor vascularization in the tumor center. Vessels in the tumor center also appeared compressed and elongated when they were compared with vessels (which were dilated) in areas of greater vessel density.12
We found that the size of the ROI also affected the final measurements. The measurements obtained by freehand ROI outlining of the tumor lay intermediate to those obtained from the center and edge irrespective of the size (60 or 120 mm2 ROI). Although evaluation using one ROI might not accurately reflect the differences in tumor perfusion that are present at the zonal level, our study showed that evaluations using this type of ROI analysis are more acceptable, which could avoid the parameter difference result from tumor interior space heterogeneity to a great extent. This may yet remain as an appropriate form of analysis in the context of therapeutic assessment. The type of tumor ROI analysis should be specified during therapeutic assessment to ensure consistency.
Our results showed that the percentage of variation in perfusion, BV, and PEI was significantly different between groups. This indicated that both the location and the size of ROIs have effects on the measurement results. In addition, measurement with least variability was obtained in the perfusion, BV, and PEI when ROI outlining the whole tumor was used. Similar results had been observed using ROIs in high and low perfusion regions and outlining whole tumor in bronchial carcinomas.15 In another study, the optimal perfusion measurements were achieved using ROI outlining the tumor for colon tumors.13
Apart from the lesions in other parts of the body, motion artifact was one of the main external influence factors. Compared with traditional CT, the data acquisition speed was greatly improved in 256-slice spiral CT due to the faster scanning speed and wider coverage (up to 8 cm), which made it possible for the whole tumor perfusion scanning. The use of 256-slice spiral CT in combination with respiratory training could minimize the variations caused by motion artifact.16 Moreover, the greater tumor coverage has the potential to compensate for the tumor heterogeneity and hence to improve measurement variability. The measurements by ROI outlining the whole tumor target the whole tumor, including the internal high and low perfusion area, which avoids the effect of the variation in the tumor blood vessels.
Tumor angiogenesis is indispensable to tumor growth, invasion, and metastasis. Perfusion CT has been validated against histologic markers of angiogenesis in a variety of cancers. The current standard to characterize tumor angiogenesis is histological MVD technique. In our study, we performed Spearman correlation analysis between MVD counts and five groups of perfusion parameters to compare the accuracy of the measurement method. Our study demonstrated the feasibility of CT for assessing lung tumor perfusion on the basis of pathology and CT correlation. The parameters and MVD were positively correlated. Furthermore, the correlation between MVD and perfusion parameters using ROI outlining the whole tumor was the best, especially the perfusion values that had the correlation coefficient of 0.732 (all P-value <0.05). This might be due to the increase of MVD, and thus leads to the increase of perfusion value and BV.1,2 In addition, PEI and MVD were positively correlated and the correlation was influenced by the amount of functional capillary, size, and length of the vessels.17
Conclusion
In summary, selection of position and size of tumor ROI has significant impact on the final perfusion values. ROI for outlining of the entire tumor was the optimal approach in producing reliable perfusion measurements. We suggested that ROI outlining of whole tumor would be effective for clinical diagnosis compared to arbitrary choice of ROI on tumor.
Acknowledgments
We would like to thank Dr Binshi from the Department of Thoracic Surgery, China–Japan Friendship Hospital for finding willing lung cancer patients. We also thank Dr Bei Wang, Department of Pathology, China–Japan Friendship Hospital for the assistance with histopathological examination.
Disclosure
The authors report no conflicts of interest in this work.
References
Tateishi U, Kusumoto M, Nishihara H, Nagashima K, Morikawa T, Moriyama N. Contrast-enhanced dynamic computed tomography for the evaluation of tumor angiogenesis in patients with lung carcinoma. Cancer. 2002;95:835–842. | ||
Ma SH, Le HB, Jia BH, et al. Peripheral pulmonary nodules: relationship between multi-slice spiral CT perfusion imaging and tumor angiogenesis and VEGF expression. BMC Cancer. 2008;8:186. | ||
Eisenhauer EA, Therasse P, Bogaerts J, et al. New response evaluation criteria in solid tumors: revised RECIST guideline (version 1.1). Eur J Cancer. 2009;45:228–247. | ||
Wang J, Wu N, Cham MD, Song Y. Tumor response in patients with advanced non-small cell lung cancer: perfusion CT evaluation of chemotherapy and radiation therapy. AJR Am J Roentgenol. 2009;193:1090–1096. | ||
Yi CA, Lee KS, Kim EA, et al. Solitary pulmonary nodules: dynamic enhanced multi-detector row CT study and comparison with vascular endothelial growth factor and microvessel density. Radiology. 2004;233:191–199. | ||
Weidner N. Tumour vascularity and proliferation: clear evidence of a close relationship. J Pathol. 1999;189:297–299. | ||
Ng QS, Goh V. Angiogenesis in non-small cell lung cancer: imaging with perfusion computed tomography. J Thorac Imaging. 2010;25:142–150. | ||
Ma SH, Xu K, Xiao ZW, et al. Peripheral lung cancer: relationship between multi-slice spiral CT perfusion imaging and tumor angiogenesis and cyclin D1 expression. Clin Imaging. 2007;31:165–177. | ||
Vlahovic G, Rabbani ZN, Herndon JE 2nd, Dewhirst MW, Vujaskovic Z. Treatment with imatinib in NSCLC is associated with decrease of phosphorylated PDGFR-beta and VEGF expression, decrease in interstitial fluid pressure and improvement of oxygenation. Br J Cancer. 2006;95:1013–1019. | ||
Vlahovic G, Ponce AM, Rabbani Z, et al. Treatment with imatinib improves drug delivery and efficacy in NSCLC xenografts. Br J Cancer. 2007;97:735–740. | ||
Fraioli F, Anzidei M, Zaccagna F, et al. Whole-tumor perfusion CT in patients with advanced lung adenocarcinoma treated with conventional and antiangiogenetic chemotherapy: initial experience. Radiology. 2011;259:574–582. | ||
Ng QS, Goh V, Fichte H, et al. Lung cancer perfusion at multi-detector row CT: reproducibility of whole tumor quantitative measurements. Radiology. 2006;239:547–553. | ||
Goh V, Halligan S, Gharpuray A, Wellsted D, Sundin J, Bartram CI. Quantitative assessment of colorectal cancer tumor vascular parameters by using perfusion CT: influence of tumor region of interest. Radiology. 2008;247:726–732. | ||
Konerding MA, Fait E, Gaumann A. 3D microvascular architecture of pre-cancerous lesions and invasive carcinomas of the colon. Br J Cancer. 2001;84:1354–1362. | ||
Kiessling F, Boese J, Corvinus C, et al. Perfusion CT in patients with advanced bronchial carcinomas: a novel chance for characterization and treatment monitoring. Eur Radiol. 2004;14:1226–1233. | ||
Miles KA. Perfusion CT for the assessment of tumor vascularity: which protocol? Br J Radiol. 2003;76:S36–S42. | ||
Bai RJ, Cheng XG, Qu H, Shen BZ, Han MJ, Wu ZH. Solitary pulmonary nodules: comparison of multi-slice computed tomography perfusion study with vascular endothelial growth factor and microvessel density. Chin Med J. 2009;122:541–547. |
 © 2016 The Author(s). This work is published and licensed by Dove Medical Press Limited. The
full terms of this license are available at https://www.dovepress.com/terms
and incorporate the Creative Commons Attribution
- Non Commercial (unported, 3.0) License.
By accessing the work you hereby accept the Terms. Non-commercial uses of the work are permitted
without any further permission from Dove Medical Press Limited, provided the work is properly
attributed. For permission for commercial use of this work, please see paragraphs 4.2 and 5 of our Terms.
© 2016 The Author(s). This work is published and licensed by Dove Medical Press Limited. The
full terms of this license are available at https://www.dovepress.com/terms
and incorporate the Creative Commons Attribution
- Non Commercial (unported, 3.0) License.
By accessing the work you hereby accept the Terms. Non-commercial uses of the work are permitted
without any further permission from Dove Medical Press Limited, provided the work is properly
attributed. For permission for commercial use of this work, please see paragraphs 4.2 and 5 of our Terms.