Back to Journals » Biologics: Targets and Therapy » Volume 19
RNA Sequencing Identifies Novel Signaling Pathways and Potential Drug Target Genes Induced by FOSL1 in Glioma Progression and Stemness
Authors Guo S ![]() , Sidhu R, Ramar V, Guo AA, Wang G, Liu M
, Sidhu R, Ramar V, Guo AA, Wang G, Liu M
Received 21 December 2024
Accepted for publication 1 March 2025
Published 5 April 2025 Volume 2025:19 Pages 157—176
DOI https://doi.org/10.2147/BTT.S509774
Checked for plagiarism Yes
Review by Single anonymous peer review
Peer reviewer comments 2
Editor who approved publication: Dr Shein-Chung Chow
Shanchun Guo,1 Rajveer Sidhu,2 Vanajothi Ramar,2 Alyssa A Guo,3 Guangdi Wang,1 Mingli Liu2
1RCMI Cancer Research Center and Department of Chemistry, Xavier University, New Orleans, LA, USA; 2Department of Microbiology, Biochemistry & Immunology, Morehouse School of Medicine, Atlanta, GA, USA; 3Wake Forest University School of Medicine, Winston-Salem, NC, USA
Correspondence: Mingli Liu, Email [email protected]
Background: Glioblastoma is a highly aggressive brain tumor, and the transition from the proneural to mesenchymal subtype is associated with more aggressive and therapy-resistant features. However, the signaling pathways and genes involved in this transition remain largely undefined.
Methods: We utilized patient-derived xenograft (PDX) samples of glioblastoma, specifically PDX-L14, which exhibit both negative and overexpressed FOSL1 expression. mRNA expression profiles were assessed by RNA sequencing in these samples, followed by gene ontology (GO) analysis, Kyoto Encyclopedia of Genes and Genomes (KEGG) pathway analysis, and Gene Set Enrichment Analysis (GSEA). Validation of the hub genes was performed using qPCR and immunohistochemistry assays.
Results: Differentially expressed genes (DEGs) between FOSL1 overexpression groups were predominantly involved in ferroptosis, immune response, angiogenesis, vascular mimicry, autophagy, epithelial-mesenchymal transition (EMT), cancer cell stemness, temozolomide (TMZ) resistance, and NF-κB signaling. Downregulated DEGs were associated with TMZ resistance, glioma proliferation, RNA processing, and Wnt/β-catenin signaling. Key enrichment pathways, including NF-κB, Want, and BMP, are all critical for maintaining glioma stemness. FOSL1 was found to regulate RNA processing and ubiquitination. Notably, 8 upregulated (ITGA5, SDC1, PHLDB2, TNFRSF8, ADAM8, TLR7, STEAP3, and POU3F2) and 4 downregulated (IFIT1, FBXO16, ARL3, and BEX1) genes were identified, with implications for glioblastoma prognosis.
Conclusion: This transcriptome investigation emphasizes the diverse functions of FOSL1 in different biological processes and signaling networks during the shift from proneural to mesenchymal state in glioblastoma.
Keywords: glioma, RNA sequencing, FOSL1, NF-κB, glioma stem cells, signaling pathways
Introduction
FOSL1 (also known as FOS-related antigen 1, Fra-1) is a component of AP-1 transcription factor complexes, which are formed by the dimerization of JUN family members (c-Jun, JunB, and JunD) with FOS family members (c-Fos, FosB, Fra-1, and Fra-2).1 FOSL1 is overexpressed in most solid tumors2–9 including GBM,10,11 and its overexpression is correlated with tumor progression and worsened patient survival.12–15 Thus, FOSL1 has been a popular focus for therapeutic intervention of tumors.16 The FOSL1 protein is mostly located in the nucleus and is involved in various cellular functions,17 such as in cancer cell proliferation, invasion/metastasis,18 epithelial-to-mesenchymal transition (EMT),7,19,20 cancer stemness,21,22 chemo-resistance,21 as well as modulation of tumor immunity.23 Notably, FOSL1 is implicated in promoting the transition of proneural (PN) to mesenchymal (MES) states in GBM.11,24 The regulation of FOSL1 is governed by many mechanisms, including transcriptional control by STAT3 and posttranslational changes including phosphorylation and deacetylation. These findings have been found not only in our research25,26 but also in other research groups.17,22,25 Phosphorylation of FOSL1 at the C-terminal residues T223, T230, S252, and S265 increases its stability and prevents proteasome degradation independent of ubiquitin. In contrast, phosphorylation at T217, T222, and T231 enhances FOSL1’s transactivation.1 Notably, phosphorylation at T231 is essential for FOSL1 transactivation by 12-O-tetradecanoylphorbol-13-acetate (TPA) via extracellular signal-regulated kinase (ERK) in tumor cells.27,28 Deacetylation at K116 in the FOSL1 DNA-binding domain (DBD) by histone deacetylase (HDAC) like HDAC6 enhances DNA binding, thereby increasing its transactivation and promoting colorectal cancer (CRC) progression and increases CRC stemness.1,22
The PN subtype transition to MES (PMT) of glioma stem cells (GSCs) confers resistance to chemo-radiation therapy in glioblastoma (GBM) patients and is strongly associated with poor patient outcomes;29–32 FOSL1 is a crucial regulator of the transition from PN to MES, associated with glioma development.24,32 FOSL1 is essential for preserving the stem cell characteristics of the MES subtype of GBM, which makes it a promising candidate for therapeutic targeting. While it may be difficult to pharmacologically suppress FOSL1 due to its cancer-causing properties, targeted therapy by methods like CRISPR/Cas9 or PROTAC that specifically target the abnormal expression of FOSL1 could be a potentially effective strategy for treating patients with mesenchymal GBM.24,33 Our findings indicate that FOSL1 is linked to the advancement of cancer, specifically in increasing the growth and spread of glioma, as well as enhancing the stem cell-like properties of glioma cells,18,25 but the specific mechanisms behind FOSL1-induced PMT and treatment resistance have not been fully understood. Our observations indicated that the PN subtype PDX-L14/X456 exhibited a markedly decreased level of FOSL1 in comparison to the other glioma cell lines (see Figure 4D in reference).18 To elucidate the role of FOSL1 in the progression and development of GBM, we injected FOSL1 into PDX-L14 cells, which exhibit limited FOSL1 expression, to enhance the expression of this gene. Subsequently, we conducted RNA-seq and transcriptome studies. In this study, we reported crucial gene profiles and signaling pathways that are induced by FOSL1 in glioblastoma. Our analytical workflow is briefly outlined in Figure 1.
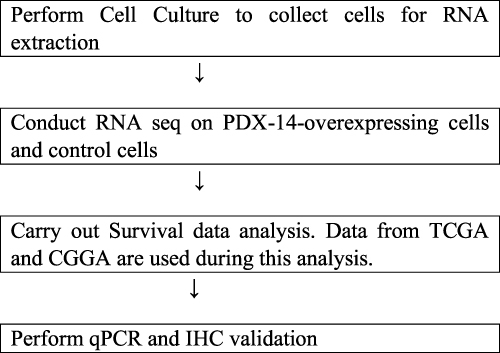 |
Figure 1 Study Flowchart. |
Material and Methods
Cell Culture, Plasmids, and Transfection
Human glioblastoma cell lines: A172 (RRID: CVCL_0131) and U87MG (HTB-14, RRID: CVCL_0022) were obtained from ATCC. The cells were cultured in DMEM enriched with 10% FBS, 50 units/mL penicillin, and 50 µg/mL streptomycin at 37°C. The PDX-L14 line, a patient-derived xenograft (PDX), was generated by implanting PDX-tumor tissue cubes subcutaneously into the flanks of male or female 6–8 weeks old nude mice under anesthesia (ketamine/Xylazin 90/6 mg/kg BW) in accordance with the approach detailed in our prior article.25 IACUC (Institutional Animal Care and Use Committee) NO. 23–18 (20–14 renewal). Following this, a suspension of individual cells was cultured in DMEM/F-12 media enriched with 10% FBS, 50 units/mL penicillin, and 50 µg/mL streptomycin. All investigations utilized cells devoid of mycoplasma. The FOSL1 human GFP-tagged ORF clone (RG202104) and the control vector PS100001 were acquired from OriGene.
Transfection of DNA Constructs
Transfection of DNA constructs was carried out when glioma cells reached approximately 50–75% confluency. FOSL1 tagged with GFP, along with corresponding controls, were transfected using lipofectamine 3000 transfection reagent (Invitrogen, Carlsbad, CA), according to the manufacturer’s instructions. The extent of overexpression was assessed 48 or 72 hours post-transfection via Western blotting or immunofluorescence imaging, if required. All studies were done in triplicates.
RNA Isolation, cDNA Synthesis, and qPCR
The procedures for isolating total RNA, synthesizing cDNA, and amplifying by PCR were conducted according to the previously described methods.34 The cells were subjected to RNA extraction using TRIzol, and the resulting RNA was quantified using a Nanodrop. The iScript cDNA Synthesis Kit was employed to reverse transcribe 0.75 μg of purified RNA. The process of reverse transcription was conducted using random hexamers at a temperature of 25°C for a duration of 5 minutes, followed by a temperature of 42°C for 30 minutes, and finally a temperature of 85°C for 5 minutes. The cDNA was diluted by a factor of ten and subjected to amplification using iQ SYBR Green Supermix (Bio-Rad Laboratories, Inc) following the manufacturer’s instructions. The amplification was carried out under the following conditions: an initial denaturation step at 95°C for 3 minutes, followed by 40 cycles of denaturation at 95°C for 10 seconds, and annealing/extension at 61°C for 45 seconds. The CFX Connect Real-Time PCR Detection System was employed for quantitative gene analysis. Each experiment was conducted in three biological replicates, and GAPDH was utilized as the reference gene.34 The relative expression for each gene was determined using the 2−ΔΔCt technique. The primers for FOSL1, ITGA5, SDC1, PHLDB2, TNFRSF8, ADAM8, TLR7, STEAP3, POU3F2, IFT1, FBXO16, ARL3, BEX1, and GAPDH were provided in Table 1.
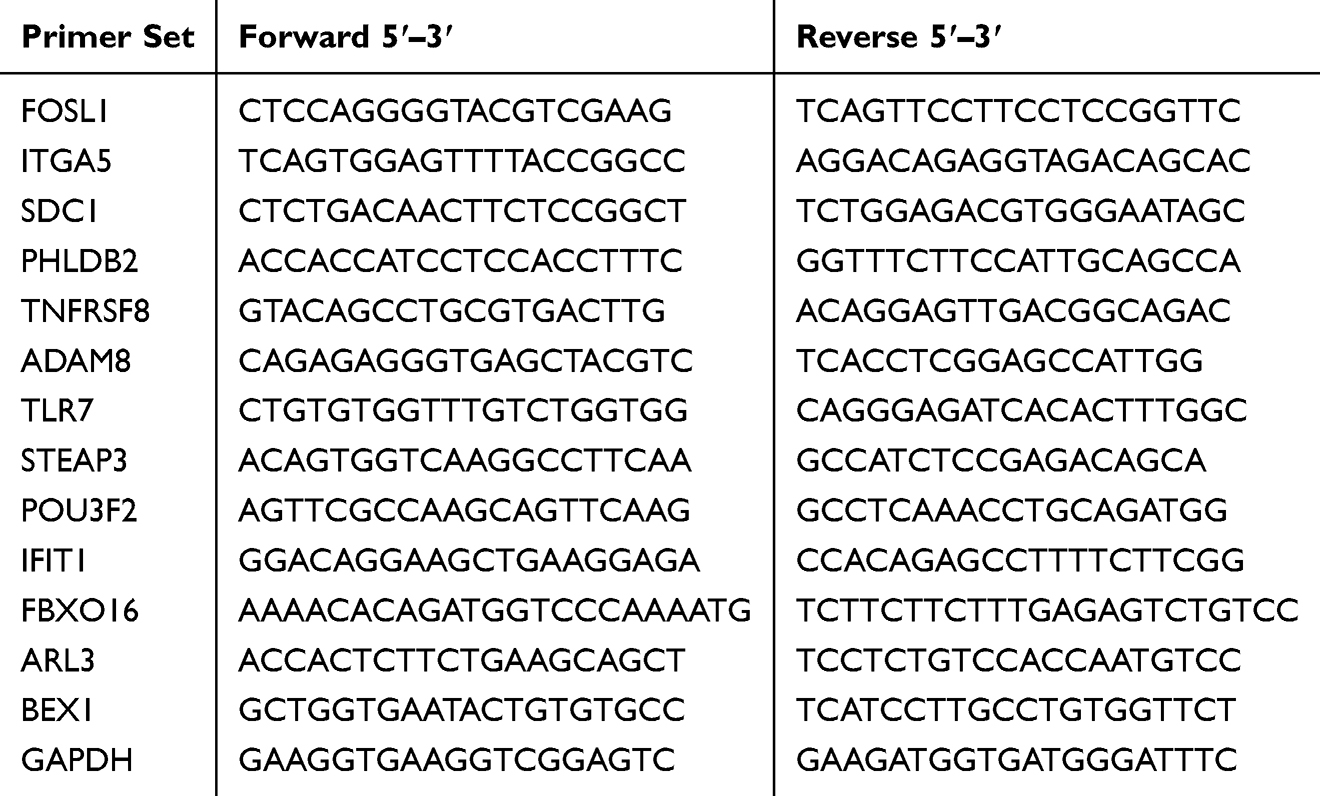 |
Table 1 List of Primers Used in the Study |
Library Preparation and RNA-Sequencing
PDX-L14 cells were transfected with GFP-tagged FOSL1 and corresponding controls. At 72 h, the total RNA of each sample was extracted from the cells using the TRIzol reagent. Whole transcriptome sequencing RNAseq) was conducted by Novogene (Sacramento, CA) using 3 replicates of samples for each group. Messenger RNA (mRNA) was isolated from total RNA utilizing poly-T oligo-conjugated magnetic beads. The mRNA was fragmented, and the first strand of cDNA was subsequently generated with random hexamer primers. The second strand of cDNA was subsequently generated utilizing either dUTP for a directional library or dTTP for a non-directional library. The quality of the library was evaluated by Qubit and real-time PCR for quantification, and a bioanalyzer for size distribution analysis. Quantified libraries were aggregated and sequenced on the Illumina platform according to effective library concentration and data specifications.
RNA-Seq Data and Computational Analysis
Original image data from high-throughput sequencing on Illumina platforms are converted to sequenced reads (Raw data/Raw reads) using CASAVA base calling. The raw data are stored in FASTQ (fq) format files, which include sequences of reads along with corresponding base quality scores. Differential gene expression analysis was performed using the DESeq2 software with normalization achieved through the DESeq method. The criteria for identifying differentially expressed genes were set at |log2(Fold Change)| ≥ 2 and p<0.05. Genes that were differentially expressed with a significant false discovery rate (FDR<0.05)35 were selected for further analysis. FDR was calculated using the Benjamini-Hochberg (BH) method.
Venn Diagram
The Differential Expression Venn diagram was used to illustrate the differential genes of the compared treatment group and the control group. The sum of all the numbers in the circle represents the total number of genes in the compared groups, and the overlapping area indicates the number of differential genes shared between the groups.
Cluster Analysis
The differential gene set was created by combining all the genes that were expressed differently in the comparison group. For experiments with more than two groups, cluster analysis was performed on different gene sets, allowing genes with similar expression patterns to be clustered together. The FPKM values of genes were clustered using mainstream hierarchical clustering, and the rows were homogenized using Z-score. The heat map facilitated the grouping of genes or samples that exhibited comparable expression patterns. The color in each grid represents the result achieved after standardizing the expression data rows (often ranging from −2 to 2), rather than the actual gene expression value. Therefore, the colors in the heat map are not only compared horizontally (the expression of the same gene in different samples) but also compared vertically (the same sample). Clustering occurs not only across groups but also among individual samples.
Volcano Plots
Volcano plots were utilized to deduce the overall distribution of genes that were expressed differentially. The clusterProfiler36 software was utilized for enrichment analysis, encompassing GO Enrichment, DO Enrichment, KEGG, and Reactome database Enrichment. The gene set enrichment analysis (GSEA) software37,38 was utilized to conduct gene enrichment analysis and examine the signaling pathways controlled by FOSL1.
To address the concern about gene set size bias, we acknowledge that clusterProfiler may be influenced by potential gene set size biases and pathway redundancies. To mitigate this, we utilized the default settings in clusterProfiler, which incorporated statistical adjustments, including the hypergeometric test and multiple testing correction (eg, Benjamini-Hochberg), to minimize false positives and account for variability in gene set size. Regarding pathway redundancies, we acknowledge that overlapping results can arise from pathway redundancies. To address this, we employed the simplify function in clusterProfiler, which clusters similar Gene Ontology terms based on semantic similarity, thereby reducing redundancy in enriched pathways.
To minimize batch and off-target effects, we used randomization of sample processing and sequencing across different experimental runs to ensure that any technical variation was evenly distributed across conditions. We applied rigorous quality control measures to assess the integrity of RNA-seq data, including visual inspection of data distribution (through PCA or clustering) to ensure that the experimental conditions were well represented and that no confounding factors from technical artifacts were present.
Immunohistochemistry (IHC)
IHC staining was performed on 5-µm thick microarray slides. The slides underwent baking at a temperature range of 55–60°C for a duration of 30 to 60 minutes. Subsequently, they were subjected to pretreatment in a citrate buffer with a pH of 6 for 10 minutes at a temperature of 100°C. The samples were subsequently placed in a 4°C incubator overnight with primary antibodies (diluted at a ratio of 1:100), followed by a 60-minute incubation at room temperature with secondary antibodies (diluted at a ratio of 1:200). The detection method employed was a streptavidin-biotin immunoperoxidase approach utilizing diaminobenzidine (DAB). The slides were stained with Mayer’s hematoxylin for a duration of 2 minutes and observed using a light microscope.
HSORE Determination
The staining intensity in the TMA was evaluated as either negative or positive in three separate bright regions, with a minimum of 100 cells per field. The HSCORE for antigens STEAP3 and ARL3 was calculated using the formula HSCORE = Ʃpi (i + 1), where “i” denotes the intensity levels (0, 1, 2, or 3), and “pi” indicates the percentage of cells at each intensity.18,39,40 Two impartial evaluators conducted a blind evaluation and assessment of the slides.
Tissue Microarray (TMA)
Glioma tissue arrays obtained from glioma patients were procured from BioCoreUSA Corporation (https://biocoreusa.com/default.aspx). The tissue arrays are commercially available and do not need ethics committee approval. The biopsy features encompassed information such as the individual’s age, gender, the specific organ or anatomical place affected, the degree of severity, and the pathological diagnosis based on sections stained with hematoxylin and eosin (HE). The slides (product no. GL1001b) comprised 75 glioma examples: grade II included 51 cases (47 astrocytomas, 2 oligodendrogliomas, and 2 oligoastrocytomas); grade III included 12 cases (anaplastic astrocytoma); grade IV included 12 cases (glioblastoma); and there were 10 cases of normal brain tissue.
Immunofluorescence Staining
The glioma cells were immobilized using a 4% solution of paraformaldehyde (PFA), made permeable with a 0.02% solution of Triton-X-100, and then treated with a 10% solution of goat serum to prevent non-specific binding. The cells were subsequently cultured at a temperature of 4°C overnight with a primary antibody (diluted at a ratio of 1:100) in a solution that prevents non-specific binding. This was followed by incubation with a secondary antibody conjugated with either FITC or Alexa Fluor 568 for a duration of 1 hour at room temperature. The cultures were rinsed with PBS and then placed on slides with VECTASHIELD mounting media containing DAPI. Samples were imaged using a Zeiss AxioImager or Zeiss Confocal Microscope LSM700. Total nuclear immunofluorescence intensity with FOSL1 was determined using the Fiji software.
Results
1. Differentially expressed mRNA in glioma PDXL-14 overexpressing FOSL1. To identify the underlying mechanisms of FOSL1 in glioblastoma development, we utilized the proneural subtype PDX-L14, which expresses a very low level of FOSL1.18 After PDX-L14 cells were transfected with GFP-tagged FOSL1 and corresponding control, we performed RNA-sequencing (RNA-seq) and transcriptome analyses of PDX-L14 cells after FOSL1 overexpression and corresponding control (3 replicates for each group). High transfection efficiency was demonstrated by significantly increased FOSL1 mRNA levels measured by qPCR (Figure 2A, top) and elevated FOSL1 protein levels detected by Western blot (Figure 2A, bottom). Additionally, we confirmed that the nuclear localization of FOSL1 was not changed by the GFP tag (Figure 2B).
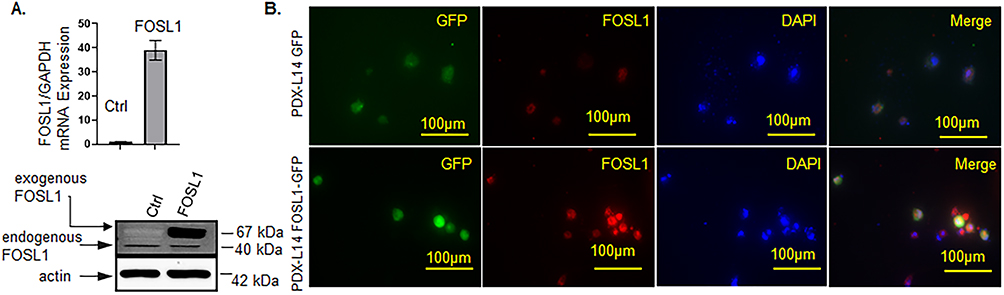 |
Figure 2 High transfection efficiency of FOSL1 overexpression in PDX-L14 cells. (A) Increased expression of FOSL1 mRNA (top) detected by qPCR and protein levels by Western blot (bottom) after PDX-L14 cells were transfected with GFP-tagged FOSL1 and corresponding control. (B) PDX-L14 cells transfected with a GFP-tagged FOSL1 and control for 72 h were stained for FOSL1. Magnification 40x. |
2. FOSL1 overexpression in PDXL-14 resulted in differentially expressed mRNA of genes in glioma. Pair-wise differential expression analyses showed a total of 493 DEGs (fold change >0.5; adjusted p<0.05) identified in the FOSL1 group when compared with the control (Figure 3A). As illustrated in the Venn diagram (Figure 3B), 9 genes consistently exhibited differential expressions across all three pairs, namely FOSL1, RGPD6, IGFN1, OAS2, IFI44L, KRT75, STEAP3, ITGA5, and ARL3. Additionally, 32 genes showed differential expressions in the comparison of PDX-L14 control 1 vs PDX-L14 FOSL1 overexpression 1, as compared to the pairs of PDX-L14 control 2 vs PDX-L14 FOSL1 overexpression 2. Furthermore, 10 genes were found to be differentially expressed in the comparison of PDX-L14 control 1 vs PDX-L14 FOSL1 overexpression 1, as opposed to the pairs of PDX-L14 control 3 vs PDX-L14 FOSL1 overexpression 3. Similarly, 11 genes exhibited differential expressions in the comparison of PDX-L14 control 2 vs PDX-L14 FOSL1 overexpression 2, as compared to the pairs of PDX-L14 control 3 vs PDX-L14 FOSL1 overexpression 3. Among 493 DEGs, we identified 152 genes that were upregulated and 341 genes that were downregulated from triplicate samples of PDX-L14 cells under both control conditions and those overexpressing FOSL1, as shown in Figure 3C. Expression heatmap of differentially expressed mRNA in triplicate samples of PDX-L14 cells under control conditions and in cells overexpressing FOSL1 was shown in Figure 3D. These results indicate that FOSL1 overexpression in PDXL-14 resulted in differentially expressed mRNA of genes in glioma.
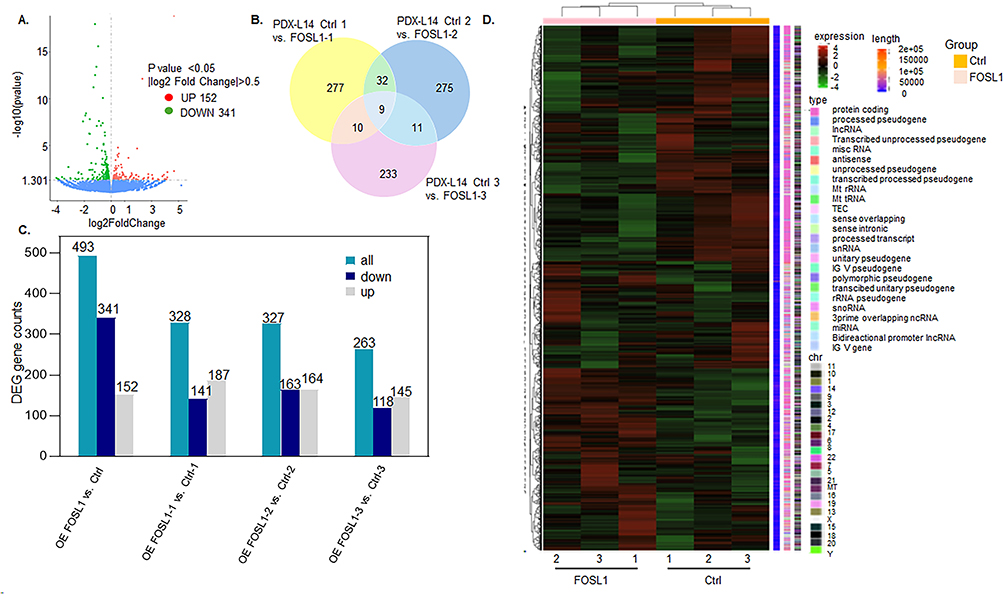 |
Figure 3 Transcriptome analyses of human PDX-L14 cells with FOSL1 overexpression. (A) Volcano plot of differentially expressed genes from RNAseq data. The x-axis represents the log2 fold change in gene expression between samples, while the y-axis shows the statistical significance of the differences, either as -log10 p-value or log10 adjusted p-value. The blue dashed line indicates the threshold for differential gene screening. Green dots represent downregulated genes (n=341), and red dots represent upregulated genes (n=152). (B) Venn diagram illustrating the overlap of differentially downregulated and upregulated mRNA in triplicate samples of PDX-L14 cells under control conditions and in cells overexpressing FOSL1. (C) Of the 493 DEGs, 152 genes were identified as upregulated, while 341 as downregulated in triplicate samples of PDX-L14 cells under both control conditions and FOSL1 overexpression. (D) Cluster analysis of FPKM values: The overall results of FPKM cluster analysis were visualized using the log2 (FPKM+1) value. Red indicates genes with high expression levels, while blue indicates genes with low expression levels. The gradient from red to blue reflects the range of log2 (FPKM+1) values from high to low. |
3. Analysis of common differential FOSL1 target genes and their functional enrichment. By analyzing differentially expressed genes, we aimed to identify significant associations with biological functions or pathways related to the overexpression of FOSL1. The enrichment analysis was performed using the clusterProfiler software36 encompassing GO enrichment, KEGG enrichment, Reactome enrichment, DO enrichment, and DisGeNET enrichment.
In Figure 4A, the left panel highlights the top 30 most significant GO Terms, including nuclear-transcribed mRNA catabolic process, mitochondrial protein complex, and cytochrome-c oxidase activity. GO terms related to CSC, RNA processing, NF-κB pathway, and cell proliferation were specifically displayed in the right panel of Figure 4A. For KEGG enrichment results (Figure 4B), the top 23 KEGG most significant pathways were selected, including oxidative phosphorylation, NOD-like receptor signaling pathway, proteasome, IL-17 signaling pathway, antigen processing and presentation, and ferroptosis. One of the FOSL1 target genes identified in this study, STEAP3, was shown to have high expression at both mRNA and protein levels. This gene has been previously reported to promote ferroptosis.41
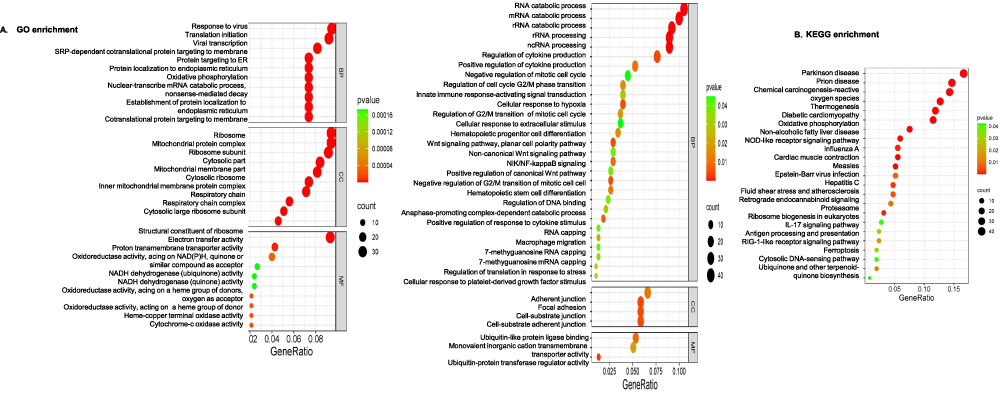 |
Figure 4 Functional enrichment results of FOSL1 target genes. (A) GO enrichment results: Left: highlights the top 30 most significant GO Terms. Right: Displays GO terms related to CSC, RNA processing, and cell proliferation. The abscissa represents the ratio of the number of differential genes associated with the GO term to the total number of differential genes, and the ordinate represents the GO Term. The size of a point indicates the number of genes annotated to a specific GO term, and the color gradient from red to green represents the significance level of enrichment (padj). (B). KEGG enrichment results: this displays the top 23 most significant KEGG pathways. The abscissa represents the ratio of the number of differential genes associated with the KEGG pathway to the total number of differential genes, and the ordinate represents the KEGG pathway. The point size indicates the number of genes annotated to a specific KEGG pathway, and the color gradient from red to green represents the significance level of enrichment. |
Figure 5A, the left panel displays the top 20 most significant Reactome pathways, such as peptide chain elongation, eukaryotic translation initiation, and elongation. The right panel of Figure 5A specifically highlights Reactome pathways associated with CSC signaling, cell proliferation, cell cycle, and RNA processing. In the context of DO Enrichment Analysis, the Human Disease Ontology served as a community-driven, standards-based ontology that provides a disease interface between data resources. Terms with p < 0.05 were deemed significant enrichment. From the DO enrichment results, the top 20 most significant DO Terms were selected for display (Figure 5B), with malignant glioma identified as a target of the FOSL1 gene. Additionally, DisGeNET enrichment analysis results (Figure 5C) showcased the 20 most significant DisGeNET pathways, including multiple malignant cancers.
 |
Figure 5 Functional enrichment results of FOSL1 target genes. (A) Reactome enrichment analysis results: Left: This displays the top 20 most significant Reactome pathways. Right: This highlights Reactome pathways associated with CSC signaling, cell proliferation, and RNA processing. The abscissa represents the ratio of the number of differential genes associated with the Reactome pathway to the total number of differential genes, and the ordinate represents Reactome Pathway. The size of a point indicates the number of genes annotated to a specific Reactome pathway, and the color gradient from red to purple represents the significance level of the enrichment. (B) DO enrichment results: This displays the top 20 most significant DO terms. Malignant glioma is identified as a target of the FOSL1 gene. The abscissa represents the DO Term, and the ordinate represents the significance level of the pathway enrichment, with higher values corresponding to higher significance. (C) DisGeNET enrichment analysis results: This displays the top 20 most significant DisGeNET pathways, including multiple malignant cancers. The abscissa represents the ratio of the number of differential genes associated with the DisGeNET pathway to the total number of differential genes, and the ordinate represents DisGeNET Pathway. The size of a point indicates the number of genes annotated to a specific DisGeNET pathway, and the color gradient from red to purple represents the significance level of the enrichment. |
These analyses offer valuable insights into the functional enrichment of differential FOSL1 target genes and their associations with various biological functions, pathways, and diseases.
4. Directed Acyclic Graph (DAG) in glioma PDXL-14 overexpressing FOSL1. In PDX-L14 glioma cells overexpressing FOSL1, DAG was utilized to visualize the enriched Gene Ontology (GO) terms of differentially expressed genes and their hierarchy (Figure 6). The top 5 enriched phrases for the biological process (GO bp) are SRP-dependent cotranslational protein targeting to membrane, cotranslational protein targeting to membrane, protein targeting to endoplasmic reticulum (ER), establishment of protein localization to ER, and translational initiation (Figure 6A). For cellular components (GOcc), the top 5 enriched terms are cytosolic ribosome, ribosomal subunit, ribosome, inner mitochondrial membrane protein complex, and mitochondrial protein complex (Figure 6B). The five most enriched terms for molecular functions (GOmf) are: structural constituent of ribosome, electron transfer activity, cytochrome-c oxidase activity, heme-copper terminal oxidase activity, and oxidoreductase activity, which acts on a heme group of donors with oxygen as the acceptor (Figure 6C). These results indicate that in glioblastoma, the FOSL1 gene is connected to and hierarchically influences multiple organelle functions, such as those in mitochondria.
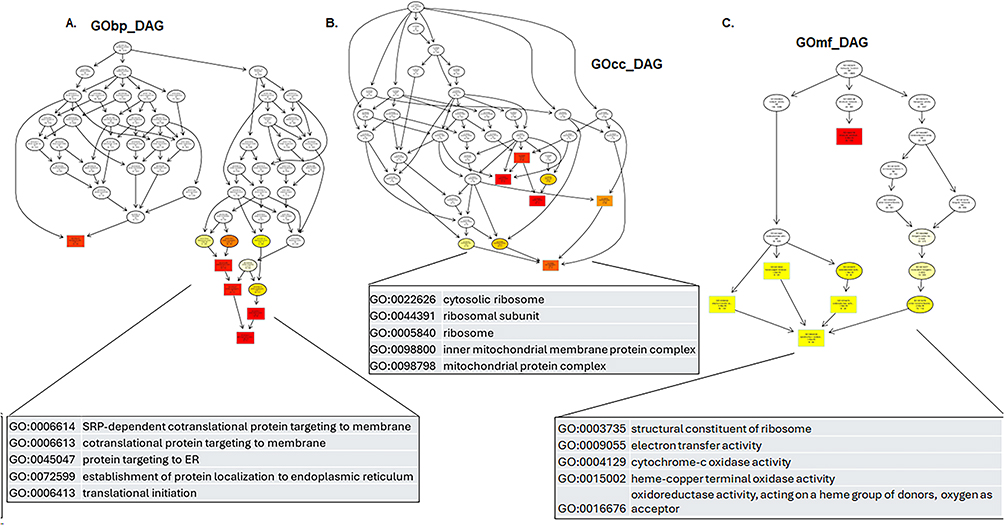 |
Figure 6 Gene Ontology (GO) enrichment analysis represented as directed acyclic graph (DAGs) in glioma PDXL-14 overexpressing FOSL1. In this project, the DAG of biological processes, molecular functions, and cellular components were sequentially drawn to provide a comprehensive visualization of the enriched GO terms and their relationships. (A) Biological Process (GObp): DAG was employed to visualize the enriched GO term of differentially expressed genes and their hierarchy. In this graph, each branch represents the hierarchical relation, with functional specificity increasing from the top to bottom. The top 5 results of GO enrichment analysis are selected as primary nodes (depicted by boxes) in the DAG, with related GO terms connected hierarchically. The degree of enrichment is represented by varying shades of color, with darker shades indicating higher enrichment levels. (B) Cellular Component (GOcc): DAG depicting the enriched GO terms associated with cellular components. (C) Molecular Function (GOmf): DAG visualizing the enriched GO terms related to molecular functions. |
5. Gene set enrichment analysis (GSEA) of RNA-seq data in glioma PDX-L14 overexpressing FOSL1. We further explored the signaling pathways modulated by FOSL1 in glioma PDX-L14 cells. The GSEA results demonstrated that FOSL1 activates IκB (Figure 7A) and NF-κB signaling pathways (Figure 7B), as well as GSC-related signaling pathways, including BMP (Figure 7C) and WNT (Figure 7D). FOSL1 also promoted pathways associated with cell proliferation, such as PI3K/AKT (Figure 7E) and VEGF (Figure 7F), while enhancing cell-to-cell communication (Figure 7G). Additionally, FOSL1 upregulated TRP channel expression/activity (Figure 7H) and influenced axon guidance in glioma (Figure 7I). Furthermore, FOSL1 affected RNA processing and splicing (Figure 8A–D), miRNA splicing and capping (Figure 8E and F), proteasome and ubiquitination signaling (Figure 8G–I), as well as cell cycle progression and cell death (Figure 8J and K), and TNF receptor-associated factors (TRAF6) signaling (Figure 8L). These results indicated that the FOSL1 gene is related to multiple biological functions, including cell proliferation, cancer cell stemness, angiogenesis, and ion channel activities. These data are consistent with our previous findings on FOSL1 interaction with NF-κB42 and TRPM7 channels.25
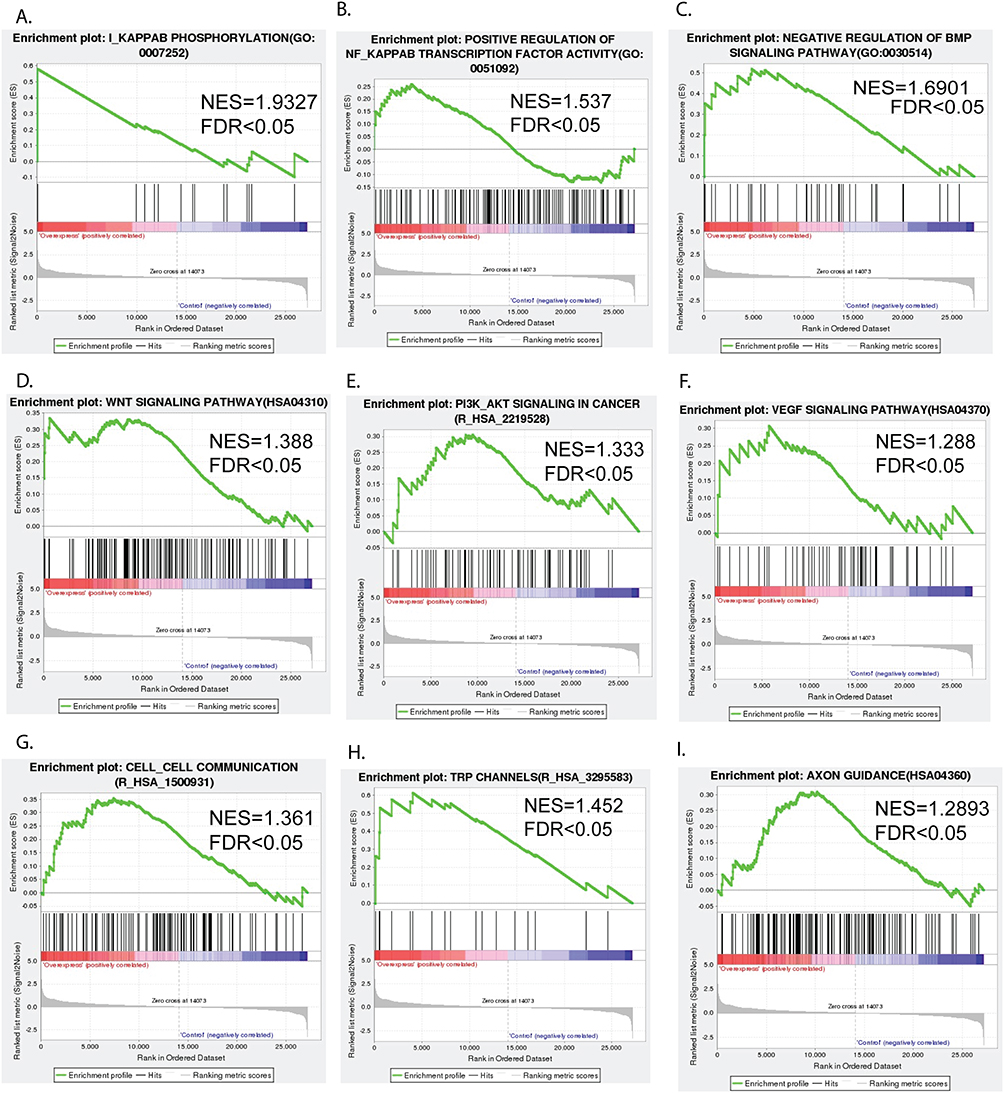 |
Figure 7 Signaling pathway undergoing positive changes in response to FOSL1 overexpression in glioblastoma. Gene set enrichment analysis of RNA-seq data shows that FOSL1 activates the IκB (A) and NF-κB signaling pathways (B), as well as GSC-related signaling pathways, including BMP (C) and WNT (D). FOSL1 also promoted pathways associated with cell proliferation, such as PI3K/AKT (E) and VEGF (F), while enhancing cell-to-cell communication (G). Additionally, FOSL1 upregulated TRP channel expression/activity (H) and influenced axon guidance in glioma (I). |
 |
Figure 8 Signaling pathways exhibiting negative changes in response to FOSL1 overexpression in glioblastoma. FOSL1 exhibited effects on RNA processing and splicing (A–D), mRNA splicing and capping (E and F), proteasome and ubiquitination signaling (G–I), cell cycle progression and cell death (J and K), and TRAF6 signaling (L). |
6. The prognostic significance of a risk signature composed of FOSL1 target genes was evaluated across various stratified cohorts of glioma cases. By examining genes with differential expression in FOSL1 overexpression and identifying in at least two pairs comparison as shown in Figure 3B, we found 8 genes that were upregulated and 4 genes that were downregulated. To assess the prognosis value of these genes, survival analysis was conducted using TCGA data via GlioVis software. The Kaplan-Meier illustrated that glioma patients exhibiting elevated expression levels of genes, including Integrin subunit alpha 5 (ITGA5), Syndecan 1 (SDC1), Pleckstrin Homology Like Domain Family B Member 2 (PHLDB2), TNFRSF8 (CD30), ADAM8, TLR7, STEAP3, and POU3F2 (Figure 9A–H), all upregulated in response to FOSL1 overexpression, and these patients had shorter overall survival compared to those with lower expression levels of these genes. Conversely, patients with glioma displaying increased expression levels of genes such as IFIT1, FBXO16, ARL3, and the Brain-Expressed X-linked (BEX1) (Figure 9I–L), downregulated following FOSL1 overexpression, exhibited better prognosis compared to those with low expression levels. These data support the notion that FOSL1 serves as a prognostic marker in glioblastoma.
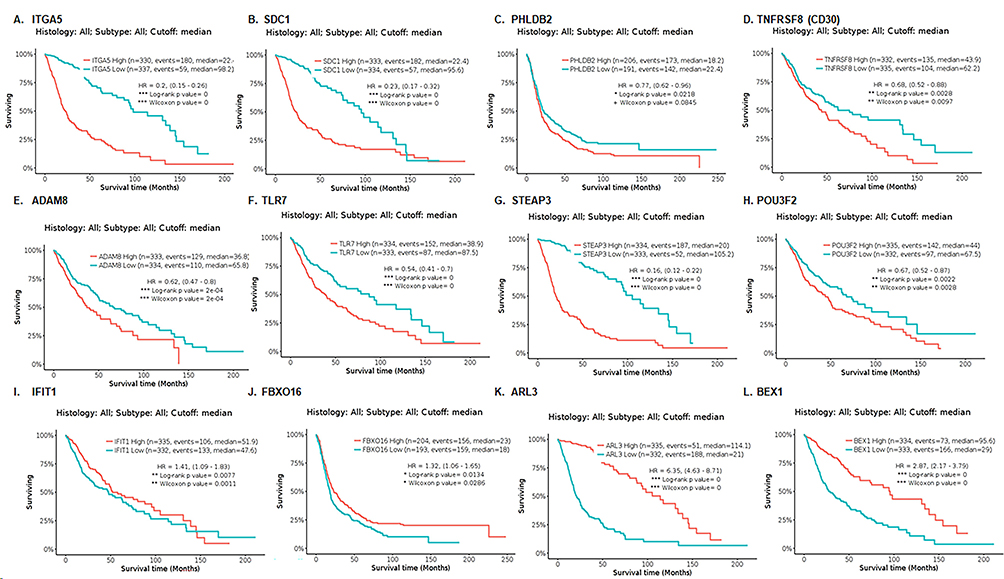 |
Figure 9 Survival analysis assessing the prognosis significance of FOSL1 target genes using the TCGA data through the GlioVis software. Kaplan-Meier curves revealed in panels (A)–(H) showed that glioma patients with elevated expression levels of genes including ITGA5, SDC1, PHLDB2, TNFRSF8 (CD30), ADAM8, TLR7, STEAP3, and POU3F2, which are upregulated in response to FOSL1 overexpression, exhibited poor outcomes. Conversely, panels (I–L) illustrate that patients with glioma who have increased expression levels of genes such as IFIT1, FBXO16, ARL3, and BEX1, downregulated following FOSL1 overexpression, demonstrated improved prognosis. |
7. Validation of FOSL1 target genes was performed by assessing mRNA expression through qPCR and protein expression through IHC. To validate the RNA-seq findings regarding the upregulation and downregulation of genes induced by FOSL1 overexpression, an FOSL1 plasmid was transfected into A172, U87MG, and PDX-L14 cells. Following this, qPCR was used to measure the mRNA levels of these genes. As shown in Figure 10A, for upregulated genes such as ITGA5, SDC1, PHLDB2, TNFRSF8, ADAM8, TLR7, STEAP3, and POU3F2, mRNA expression increased following FOSL1 introduction into the three glioma cell lines. Specifically, the fold changes were as follows: ITGA5: 1.72 to 2.1, SDC1: 2.12 to 5.97, PHLDB2: 2.01 to 10, TNFRSF 8: 2 to 3.43, ADAM8: 2.19 to 3, TLR7: 1.9 to 3.45, STEAP3: 2.17 to 3.21, and POU3F2: 2.17 to 3.2. Conversely, genes such as IFIT1, FBXO16, ARL3, and BEX1 were consistently downregulated across all three cell lines upon FOSL1 overexpression, with fold changes for IFIT1 ranging from 0.44 to 0.62, FBXO16: 0.29 to 0.52, ARL3 0.38 to 0.61, and BEX1 0.32 to 0.47 (Figure 10B). IHC results confirmed the expression of STEAP3 in both the cytoplasm and nucleus, showing STEAP3 upregulation in grade III and IV glioma patients (Figure 10C and E, left and middle panes). In contrast, ARL3 was primarily expressed in the cytoplasm and downregulated in grade III and IV glioma patients (Figure 10D and E, right panel). This data from both mRNA and protein levels effectively validated and confirmed the FOSL1 targeted genes identified in the RNA-seq analysis.
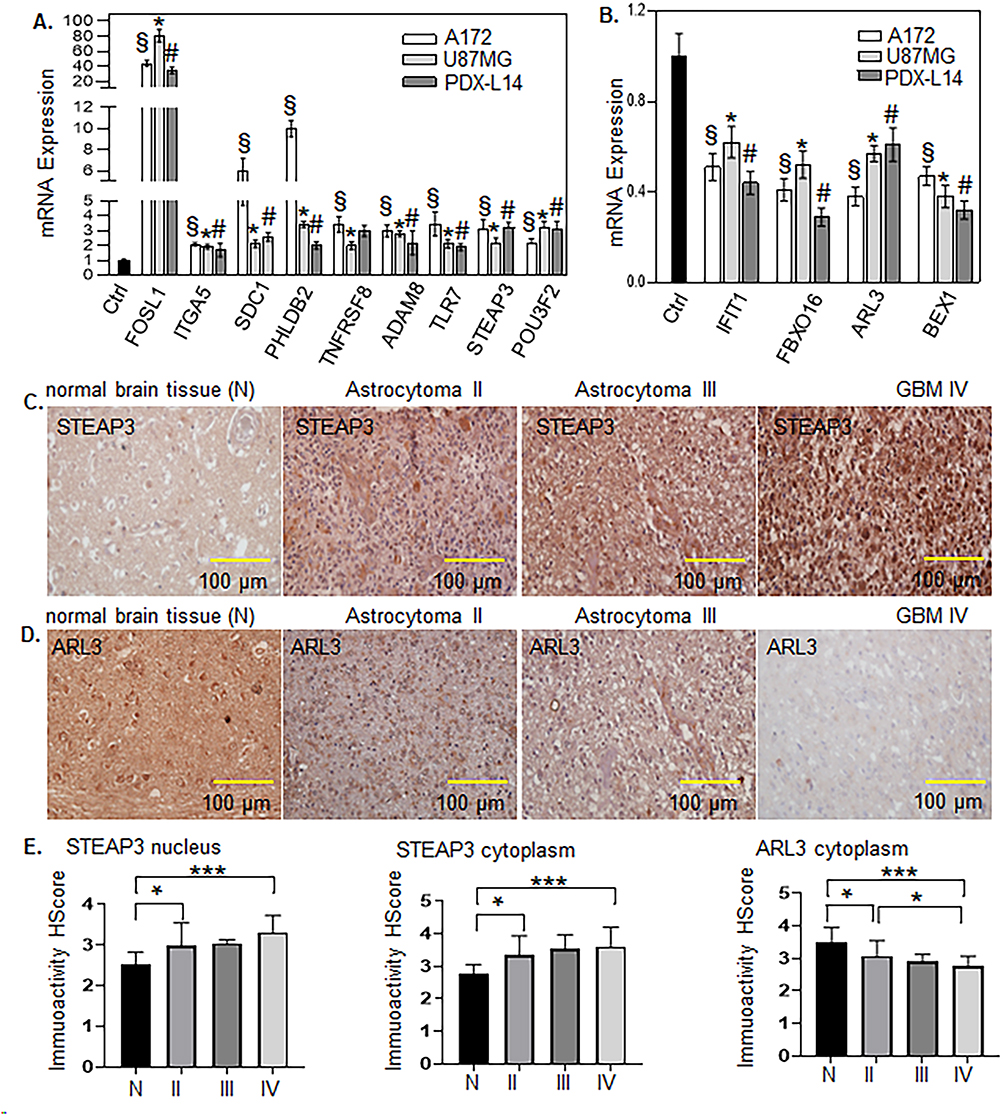 |
Figure 10 Validation of FOSL1 target genes was carried out by evaluating mRNA expression levels using qPCR and protein levels by IHC. FOSL1 plasmid was transfected into A172, U87MG, and PDX-L14 cells, followed by qPCR analysis to assess the mRNA levels of these genes. (A) The mRNA expression of upregulated genes, such as ITGA5, SDC1, PHLDB2, TNFRSF8, ADAM8, TLR7, STEAP3, and POU3F2, was confirmed to be elevated. (B) Genes including IFIT1, FBXO16, ARL3, and BEX1 were consistently downregulated across the three glioma cell lines following FOSL1 introduction. (C) The IHC results verified the expression of STEAP3 in both the cytoplasm and nucleus, indicating its upregulation in grade III and IV glioma patients. (D) ARL3 was predominately expressed in the cytoplasm and exhibited downregulation in grade III and IV glioma patients. (E) Statistical analysis of STEAP3 (left and middle panels) and ARL3 (right panel). In Panels A and B, § indicates p<0.05 compared to the control in A172 cells. A t-test was used to analyze each gene expression compared to control. * indicates p<0.05 compared to control in U87MG cells, and # indicates p<0.05 compared to control in PDX-L14 cells. In Panel E, One-way ANOVA was used to analyze each gene expression between normal and glioma patients and among different grades of glioma. * indicates p<0.05, **indicates p<0.01, and *** indicates p<0.001. |
Discussion
Previous studies demonstrated that FOSL1 exerts its cancer-causing effects by controlling multiple signaling pathways, such as MAPK, PI3K/Akt, Wnt/β-catenin, and TGF-β, which have a role in cell growth, survival, cell death, and the spread of cancer cells (see our recent review.33) In addition, recent findings have also shown that noncoding RNAs (ncRNAs) have significant involvement in the control of FOSL1 expression and function. FOSL1 has been discovered to regulate the expression of several cytokines, chemokines, and extracellular matrix (ECM) proteins that play important roles in the tumor microenvironment (TME).33 In the current study, we identified a number of novel signaling pathways in which FOSL1 is involved, including nuclear-transcribed mRNA catabolic process, mitochondrial protein complex, cytochrome-c oxidase activity, oxidative phosphorylation, NOD-like receptor signaling pathway, proteasome, IL-17 signaling pathway, antigen processing and presentation, and ferroptosis. This finding indicates that FOSL1 may have more diverse functions in different biological processes. FOSL1’s role is widespread in angiogenesis,43 senesce,44 and neural development.45 Our most recent findings show that FOSL1 promotes glioma stemness and tumorigenesis by inhibiting p27 ubiquitination and promoting FOSL1 transcription (unpublished data).
Through performing an integrated bioinformatics analysis,46,47 in this study, transcriptome data following FOSL1 overexpression in glioma cells identified 8 upregulated genes ITGA5, SDC1, PHLDB2, TNFRSF8 (CD30), ADAM8, TLR7, STEAP3, and POU3F2 and 4 downregulated genes IFIT1, FBXO16, ARL3, and BEX1 with prognostic values in glioblastoma, based on the TCGA data. These 8 upregulated and 4 downregulated genes were also validated using qPCR. Furthermore, IHC analysis of TMA samples from glioma patients revealed that STEAP3 was upregulated and correlated with glioma grade, whereas ARL3 was downregulated and also associated with glioma grade.
STEAP3, a six-transmembrane epithelial antigen of prostate 3, has been implicated in regulating the cell cycle and immune responses in glioma, as shown from both TCGA and CGGA data.48 Our findings demonstrated that there is a high expression of STEAP3 in glioma at both the mRNA and protein levels (Figure 10). STEAP3, along with five other copper-binding proteins,49 including angiogenin (ANG), coagulation factor V (F5), interleukin 1α (IL1A), lysyl oxidase L1(LOX1), LOX2, forms a six-gene risk-score model that accurately predicts unfavorable prognosis in glioma,48–50 which is confirmed by our findings. STEAP3 also acts as an iron reductase involved in intracellular iron homeostasis, a process linked to ferroptosis.41 Ferroptosis is evident in the enriched KEGG pathways following FOSL1 overexpression (Figure 4B), suggesting that STEAP3 likely contributes to this mechanism. There is not substantial direct literature providing STEAP3 as a therapeutic target for glioma patients, its biological function and the context of iron metabolism in cancer suggest that it is a candidate worthy of further exploration in glioma research.
ARL3, ADP-ribosylation factor-like 3, is a member of the ADP-ribosylation factor (ARF) family.51 Members of this family are activated through GDP to GTP exchange.52 ARL3 primarily localizes to the mitochondria, endosomes, lysosomes, and proteasome, playing a crucial role in autophagy.53 It has been recently identified as a binding partner of STAT3, enhancing its phosphorylation and nuclear accumulation.52 ARL3 plays a significant role in angiogenesis and immune cell infiltration within the GBM immune microenvironment.51 It influences the infiltration of immune cells in the GBM environment. Decreased ARL3 expression is linked to an increased percentage of dendritic cells (DCs), macrophages, NK cells, and CD4 T cells while showing a decreased percentage of CD8 T cells. Moreover, ARL3 acts as an inhibitor of angiogenesis by targeting VEGFA, making it a promising candidate for antiangiogenic treatment in GBM.51 Our study reveals that ARL3 is decreased in glioma patients and exhibits a negative correlation with glioma grade (Figure 10). As of the current knowledge, there is insufficient literature to claim that ARL3 is a well-established therapeutic target for glioma patients, but its biological significance suggests it could be a potential area for future glioma research.
Several other genes, which play pivotal roles in GBM tumorigenesis and progression, were also validated by qPCR. ITGA5 encodes a protein that is a part of the integrin alpha chain family, crucial for cell surface adhesion and signaling. Data from TCGA and CGGA demonstrates that high expression of ITGA5 is positively associated with aggressive clinicopathological features and poor survival outcomes in glioma patients. Additionally, ITAG5 is implicated in remodeling glioma immune infiltration and the immune microenvironment, leading to increased immune cell infiltration when ITGA5 expression is elevated.54 Moreover, there is a positive correlation between ITGA5 expression and ECM factors. ITGA5-induced vascular mimicry (VM) has been observed to promote resistance to temozolomide (TMZ) and bevacizumab by altering glioma vascularization. Methylation patterns of ITGA5 have also shown an association with its expression levels and tolerance to TMZ.48 Targeting ITGA5 in animal models has been shown to have anti-tumor effects such as reduced tumor growth and angiogenesis.55
SDC1 has been identified to be associated with BRD4 expression according to the CGGA database. Downregulation of SDC1 expression in in vitro U87MG and U251 glioma cell cultures significantly suppresses GBM cell proliferation and inhibits DNA replication.56 Additionally, the BRD4 inhibitor MZ1 exerts its anti-cancer effects by suppressing SDC1 in GBM.56 In the context of radioresistant GBM, SDC1 plays a role in transporting transglutaminase (TGM2) from the cell membrane into the cytoplasm. Once in the cytoplasm, SDC1 binds to flotillin 1 (FLOT1) and BHMT, facilitating the transportation of TGM2 to lysosomes. The formation of a polymer involving these four molecules leads to the fusion of lysosomes and autophagosomes, ultimately enhancing the radioresistance of GBM.57
PHLDB2 plays a pivotal role in EMT and serves as a significant mediator of cell migration, metastasis, and maintenance of cancer stem cells in gastric and colorectal cancers.58,59 In glioma, m6A-modified circEPHB4 enhances the stability of SOX2, leading to the transactivation of PHLDB2. This process contributes to glioma growth, metastasis, and the maintenance of stemness.60 In colorectal cancer treatment, PHLDB2 could be a potential target for overcoming cetuximab resistance.61
TNFRSF8 (CD30), ADAM8, and TLR7 are three genes that play crucial roles in the signaling pathway for the positive regulation of NF-κB. CD30 is a cell surface protein receptor belonging to the tumor necrosis factor receptor superfamily. It is prominently expressed in immune cells such as activated T cells, B cells, and natural killer (NK) cells, with higher expression observed in malignant cells compared to normal cells.62 CD30, a transmembrane protein of 120 kDa, interacts with TRAF to activate the NF-κB and extracellular signal-regulated kinase (ERK) pathways. Due to its significance, CD30 is regarded as a promising therapeutic target for aggressive lymphoid malignancies.62 In solid tumors like triple-negative breast cancer (TNBC), cytokine-related pathways, including CD30, along with other cytokines like CCL25, CXCL13, IL12RB2, IL21, TNFRSF13C, CCL7, and GDF5, have been utilized to predict prognosis for TNBC patients.63 ADAM8, one of the 21 members of the ADAM family of type I transmembrane proteins,64,65 regulates tumorigenesis, cell adhesion, invasiveness, and proliferation.66–68 Chronic CD30 signaling in B cells can lead to lymphoma by promoting the expansion of plasmablasts and B1 cells, indicating CD30 could be a potential target for lymphoma treatment.69 CD30 expression on CD4 T cells is required in the pathogenesis of experimental autoimmune encephalomyelitis. Blocking CD30 may be a way to interfere with the development of autoimmune diseases of the central nervous system.70
Similar to matrix metalloproteinase (MMPs), ADAM proteins have been implicated in regulating tumorigenesis, invasiveness, and proliferation.68,71 Specifically, ADAM8 is involved in mediating chemoresistance induced by TMZ and enhanced invasion of GBM cells. It does so by modulating pERK1/2 and pAkt pathways and by shedding invasion-relevant substrate CD44 and c-met (HGF). Targeted inhibition of ADAM8 in future therapeutic approaches could potentially optimize TMZ chemotherapy and hinder the formation of recurrent GBM.72 High expression of ADAM8 is correlated with poor clinical outcomes in pancreatic ductal adenocarcinoma (PDAC). A peptidomimetic ADAM8 inhibitor, BK-1361, can prevent ADAM multimerization, reduce the invasiveness of PDAC cells, and decrease tumor burden and metastasis in mice.73
TLR7 is not only expressed in immune cells, such as monocytes, macrophages, dendritic cells, T lymphocytes, B lymphocytes, and natural killer cells, which are involved in the inflammatory response and immune regulation but also in non-immune cells, such as tumor cells.74 T cell-independent eradication of experimental glioma by intravenous TLR7 agonist-loaded nanoparticles75 is achieved not through direct antitumor effects but through a proinflammatory shift in macrophages and increased ROS production.75 Overreaction of TLRs can lead to high levels of IFN and other cytokines, resulting in chronic inflammation. Consequently, small-molecule TLR antagonists have been investigated as potential cancer treatments.74 TLR7/8 agonists as potential therapeutics for tumor-targeted immunotherapy have been developed in various cancers.76
POU3F2 acts as a master regulator of neuronal differentiation, functioning as a POU-domain transcription factor in developmental biology.77 Studies have shown that inhibiting POU3F2 expression leads to a significant reduction in proliferation, migration, and invasion in small cell lung cancer (SCLC), prostate cancer, and melanoma.78–81 Additionally, in glioma, Cui et al reported that tumor suppressor miR-146a directly targets POU3F and SMARCA5, two transcription factors that mutually regulate each other. This targeting significantly impairs GBM stemness and enhances resistance to TMZ.82 POU3F2 has shown certain biological characteristics and functions that suggest its potential as a cancer drug target. As of now, there is indeed a lack of widely available and clinically approved direct inhibitors or antibodies specifically targeting POU3F2 in the context of cancer. Research in this area is still in progress, and no such targeted therapies have reached the mainstream of cancer treatment.
IFIT1, an interferon-induced protein containing tetracopeptide repeats, is pivotal in suppressing growth and promoting apoptosis in cancer cells. Interferon is known to upregulate IFIT1 expression while inhibiting the expression of O-6-methylguanine-DNA methyltransferase (MGMT).83 Research by Zhang et al suggests that IFIT1 may serve as a predictive biomarker for favorable clinical outcomes. Additionally, their findings indicate a negative correlation between IFIT1 and MGMT expression induced by interferon. Combining IFIT1 with MGMT expression provides a more accurate prediction of prognosis in newly diagnosed glioblastoma cases.83
It was found that IFIT1 is highly expressed in the central nervous system and is significantly positively expressed in the lesion tissues of central nervous system tuberculosis patients. It is suggested that IFIT1 is an important substance involved in central nervous system tuberculosis, indicating its potential as a biomarker and possible drug target for related diseases.84
FBXO16, a component of the SCF E3 ubiquitin ligase complex, interacts with β-catenin to facilitate its degradation.85 Khan et al demonstrated that FBXO16 functions as a tumor suppressor in GBM. In glioma, reduced FBXO16 expression fails to target β-catenin in tumor cells, leading to its nuclear accumulation and subsequent activation of Wnt signaling. This promotes glioma cell proliferation and malignancy.86 Under normal growth conditions, FBXO16 proteasomally degrades β-catenin in a GSK-3β-independent manner. The low expression of FBXO16 in glioma cells leads to nuclear accumulation of β-catenin, resulting in the activation of the Wnt signaling pathway, which makes glioma cells highly proliferative and malignant. This suggests that FBXO16 is closely related to the occurrence and development of glioblastoma and can be considered as a potential drug target for glioblastoma treatment.86 Under normal growth conditions, FBXO16 proteasomally degrades β-catenin in a GSK-3β-independent manner. The low expression of FBXO16 in glioma cells leads to nuclear accumulation of β-catenin, resulting in the activation of the Wnt signaling pathway, which makes glioma cells highly proliferative and malignant. This suggests that FBXO16 is closely related to the occurrence and development of glioblastoma and can be considered as a potential drug target for glioblastoma treatment.86 Additionally, in ovarian cancer, FBXO16 interacts with the RPM3 domain of hnRNPL through its C-terminal region, inducing hnRNPL’s proteasomal degradation. Inadequate degradation of hnRNPL results in increased ovarian cancer cell proliferation in vitro and tumor growth in vivo, mimicking the effects observed with FBXO16 deficiency.87 The dysregulated expression of FBXO16, along with P3D1, DCAF10, LRFN4, PTPN2, SAYSD1, and ZNF426, is significantly associated with ovarian cancer progression, and these seven genes can serve as independent prognostic markers for the disease.88
The BEX family proteins encompass five human proteins, including BEX1, BEX2, BEX3, BEX4, and BEX5. These proteins are widely expressed across various tissues and are involved in neuronal development. While BEX1 and BEX3 have been shown to exhibit tumor-suppressive properties, BEX2 appears to function as an oncogene.89 In specific patient subgroups with acute myeloid leukemia and chronic myeloid leukemia, BEX1 expression is notably diminished.89 In glioma patients, Foltz et al identified BEX1 and BEX2 as genes that undergo silencing, accompanied by significant promoter hypermethylation. These epigenetically silenced genes may serve as tumor suppressors, biomarkers for disease diagnosis and detection, and therapeutically reversible modulators of critical regulatory pathways involved in glioma pathogenesis.90 Our study further supports the tumor-suppressive role of BEX1 in glioma. BEX1 engages in an interaction with RUNX3, and this interaction serves to impede RUNX3 from suppressing the transcription of β-catenin, As a consequence, the Wnt/β-catenin signaling pathway gets activated, which in turn is crucial for maintaining the stemness in hepatoblastoma (HB) and CSC-hepatocellular carcinoma (HCC). In the case of non-CSC-HCC, when the expression of BEX1 is downregulated, it results in the inhibition of the activation of the Wnt/β-catenin signaling pathway. This indicates that BEX1 holds the potential to be a valuable therapeutic target for the treatment of HB and CSC-HCC.91
GO enrichment analysis revealed that RNA processing and ubiquitin-like protein ligase binding are associated with the overexpression of FOSL1. Our unpublished immunoprecipitation data indicates that FOSL1 physically interacts with TRIM21, a ubiquitin E3 ligase, leading to the degradation of the tumor suppressor gene p27 in glioblastoma cell lines and contributing to glioblastoma tumorigenesis. Additionally, FOSL1 interacts with hnRNPE1 and hnRNPH1, further supporting its role in RNA processing. FOSL1 is an important drug target for glioma patients. Targeting FOSL1 will probably downregulate the genes positively upregulated by FOSL1 and upregulate the genes negatively regulated by FOSL1 in glioma patients.
Limitations of This Study
Due to the heterogeneity of GBM and GSC, we selected three cell lines, A172, U87MG, and PDX-14, representing three typical GBM subtypes: the neural, mesenchymal, and proneural subtypes, as previously discussed.25 However, this study has a limitation. Specifically, it does not include more PDX lines and animal studies. Another limitation is that we did not validate all the genes upregulated or downregulated by FOSL1. Instead, we validated 8 upregulated and 4 downregulated genes with |log2(Fold Change)| ≥ 2 and p<0.05 under FOSL1 overexpression conditions. All these genes showed prognostic value in glioma. Finally, In the current study, we used transcriptome to identify the FOSL1-related signaling molecules and pathways. However, multiple omics, including genomics, epigenomics, proteomics, and metabolomics, are worth integrating with this transcriptome data to discover more targets for GBM patients.92,93
Conclusion
This transcriptome study elucidates that FOSL1 plays a multifaceted role in various biological processes and signaling pathways. Specifically, FOSL1 is participates in the regulation of key signaling pathways, such as the NF-κB, Wnt, and BMP pathways, which are critical for maintaining glioma stemness. Additionally, FOSL1 is involved in RNA processing and ubiquitination regulation. Notably, we identified 8 upregulated and 4 downregulated genes associated with glioblastoma prognosis. After this study, future efforts should be on targeting these genes to reverse the proneural to mesenchymal transition.
Data Sharing Statement
The data produced during the study are governed by a data-sharing requirement and are accessible in a public repository that does not assign DOIs to datasets.
Acknowledgments
This research was funded by the SC1 award from NIH NIGMS GM144021 (ML), the Minority Health and Health Disparities (NIMHD) grant U54MD007595 (GW), and the RCMI grant 5U54MD007602-37. The funding agencies were not involved in the design, gathering, analysis, interpretation of the study’s data, or in the composition of the manuscript.
Author Contributions
All authors made a significant contribution to the work reported, whether that is in the conception, study design, execution, acquisition of data, analysis, and interpretation, or in all these areas; took part in drafting, revising or critically reviewing the article; gave final approval of the version to be published; have agreed on the journal to which the article has been submitted; and agree to be accountable for all aspects of the work.
Funding
This research received funding from the SC1 award by NIH NIGMS GM144021 (ML), Minority Health and Health Disparities U54MD007595, (NIMHD, GW), and NIH/NIMHD project U54MD007602.
Disclosure
The authors assert that they possess no identifiable competing financial interests or personal affiliations that may have seemingly influenced the work presented in this study.
References
1. Talotta F, Casalino L, Verde P. The nuclear oncoprotein Fra-1: a transcription factor knocking on therapeutic applications’ door. Oncogene. 2020;39(23):4491–4506. doi:10.1038/s41388-020-1306-4
2. Zhong G, Chen X, Fang X, Wang D, Xie M, Chen Q. Fra-1 is upregulated in lung cancer tissues and inhibits the apoptosis of lung cancer cells by the P53 signaling pathway. Oncol Rep. 2016;35(1):447–453. doi:10.3892/or.2015.4395
3. Kharman-Biz A, Gao H, Ghiasvand R, Zhao C, Zendehdel K, Dahlman-Wright K. Expression of activator protein-1 (AP-1) family members in breast cancer. BMC Cancer. 2013;13:441. doi:10.1186/1471-2407-13-441
4. Wu J, Ji A, Wang X. MicroRNA-195-5p, a new regulator of Fra-1, suppresses the migration and invasion of prostate cancer cells. J Transl Med. 2015;13:289. doi:10.1186/s12967-015-0650-6
5. Wu J, Sun Y, Zhang PY, et al. The Fra-1-miR-134-SDS22 feedback loop amplifies ERK/JNK signaling and reduces chemosensitivity in ovarian cancer cells. Cell Death Dis. 2016;7(9):e2384.
6. He J, Zhu G, Gao L. Fra-1 is upregulated in gastric cancer tissues and affects the PI3K/Akt and p53 signaling pathway in gastric cancer. Int J Oncol. 2015;47(5):1725–1734. doi:10.3892/ijo.2015.3146
7. Liu H, Ren G, Wang T. Aberrantly expressed Fra-1 by IL-6/STAT3 transactivation promotes colorectal cancer aggressiveness through epithelial-mesenchymal transition. Carcinogenesis. 2015;36(4):459–468. doi:10.1093/carcin/bgv017
8. Mangone FRR, Brentani MM, Nonogaki S. Overexpression of Fos-related antigen-1 in head and neck squamous cell carcinoma. Int J Experiment Pathol. 2005;86(4):205–212. doi:10.1111/j.0959-9673.2005.00423.x
9. Vial E, Marshall CJ. Elevated ERK-MAP kinase activity protects the FOS family member FRA-1 against proteasomal degradation in colon carcinoma cells. J Cell Sci. 2003;116(Pt 24):4957–4963. doi:10.1242/jcs.00812
10. Wykosky J, Gibo DM, Stanton C, Debinski W. Interleukin-13 receptor alpha 2, EphA2, and Fos-related antigen 1 as molecular denominators of high-grade astrocytomas and specific targets for combinatorial therapy. Clin Cancer Res. 2008;14(1):199–208. doi:10.1158/1078-0432.CCR-07-1990
11. Chen Z, Wang S, Li H-L. FOSL1 promotes proneural-to-mesenchymal transition of glioblastoma stem cells via UBC9/CYLD/NF-κB axis. mol Ther. 2022;30(7):2568–2583. doi:10.1016/j.ymthe.2021.10.028
12. Vallejo A, Perurena N, Guruceaga E. An integrative approach unveils FOSL1 as an oncogene vulnerability in KRAS-driven lung and pancreatic cancer. Nat Commun. 2017;8:14294. doi:10.1038/ncomms14294
13. Xu H, Jin X, Yuan Y, et al. Prognostic value from integrative analysis of transcription factors c-Jun and Fra-1 in oral squamous cell carcinoma: a multicenter cohort study. Sci Rep. 2017;7(1):7522. doi:10.1038/s41598-017-05106-5
14. Iskit S, Schlicker A, Wessels L, Peeper DS. Fra-1 is a key driver of colon cancer metastasis and a Fra-1 classifier predicts disease-free survival. Oncotarget. 2015;6(41):43146–43161. doi:10.18632/oncotarget.6454
15. Gallenne T, Ross KN, Visser NL, et al. Systematic functional perturbations uncover a prognostic genetic network driving human breast cancer. Oncotarget. 2017;8(13):20572–20587. doi:10.18632/oncotarget.16244
16. Casalino L, Talotta F, Cimmino A, Verde P. The Fra-1/AP-1 Oncoprotein: from the “Undruggable” Transcription Factor to Therapeutic Targeting. Cancers. 2022;14(6):1480. doi:10.3390/cancers14061480
17. Jiang X, Xie H, Dou Y, Yuan J, Zeng D, Xiao S. Expression and function of FRA1 protein in tumors. mol Biol Rep. 2020;47(1):737–752. doi:10.1007/s11033-019-05123-9
18. Guo S, King P, Liang E, Guo AA, Liu M. LncRNA HOTAIR sponges miR-301a-3p to promote glioblastoma proliferation and invasion through upregulating FOSL1. Cell Signalling. 2022;94:110306. doi:10.1016/j.cellsig.2022.110306
19. Liu X, Bai F, Wang Y, et al. Loss of function of GATA3 regulates FRA1 and c-FOS to activate EMT and promote mammary tumorigenesis and metastasis. Cell Death Dis. 2023;14(6):370. doi:10.1038/s41419-023-05888-9
20. Kim BN, Ahn DH, Kang N. TGF-β induced EMT and stemness characteristics are associated with epigenetic regulation in lung cancer. Sci Rep. 2020;10(1):10597. doi:10.1038/s41598-020-67325-7
21. Lin S, Zhu B. Exosome-transmitted FOSL1 from cancer-associated fibroblasts drives colorectal cancer stemness and chemo-resistance through transcriptionally activating ITGB4. mol Cell Biochem. 2023;479(3):665–677.
22. Wang T, Song P, Zhong T. The inflammatory cytokine IL-6 induces FRA1 deacetylation promoting colorectal cancer stem-like properties. Oncogene. 2019;38(25):4932–4947. doi:10.1038/s41388-019-0763-0
23. Luo X, Chen Y, Tang H, et al. Melatonin inhibits EMT and PD-L1 expression through the ERK1/2/FOSL1 pathway and regulates anti-tumor immunity in HNSCC. Cancer Sci. 2022;113(7):2232–2245. doi:10.1111/cas.15338
24. Marques C, Unterkircher T, Kroon P. NF1 regulates mesenchymal glioblastoma plasticity and aggressiveness through the AP-1 transcription factor FOSL1. eLife. 2021;10:e64846.
25. Guo S, Ramar V, Guo AA, et al. TRPM7 transactivates the FOSL1 gene through STAT3 and enhances glioma stemness. Cellular mol Life Sci. 2023;80(9):270. doi:10.1007/s00018-023-04921-6
26. Liu M, Inoue K, Leng T, Guo S, Xiong Z-G. TRPM7 channels regulate glioma stem cell through STAT3 and Notch signaling pathways. Cell Signalling. 2014;26(12):2773–2781. doi:10.1016/j.cellsig.2014.08.020
27. Young MR, Nair R, Bucheimer N, et al. Transactivation of Fra-1 and consequent activation of AP-1 occur extracellular signal-regulated kinase dependently. mol Cell Biol. 2002;22(2):587–598. doi:10.1128/MCB.22.2.587-598.2002
28. Pakay JL, Diesch J, Gilan O, et al. A 19S proteasomal subunit cooperates with an ERK MAPK-regulated degron to regulate accumulation of Fra-1 in tumour cells. Oncogene. 2012;31(14):1817–1824. doi:10.1038/onc.2011.375
29. Fan L, You H, Jiang X. UCHL3 induces radiation resistance and acquisition of mesenchymal phenotypes by deubiquitinating POLD4 in glioma stem cells. Cellular mol Life Sci. 2024;81(1):247. doi:10.1007/s00018-024-05265-5
30. C Pichol-Thievend, O Anezo, AM Pettiwala, et al. VC-resist glioblastoma cell state: vessel co-option as a key driver of chemoradiation resistance. Nat Commun. 2024;15(1):3602.
31. Hart WS, Myers PJ, Purow BW, Lazzara MJ. Divergent transcriptomic signatures from putative mesenchymal stimuli in glioblastoma cells. Cancer Gene Ther. 2024;31(6):851–860. doi:10.1038/s41417-023-00724-w
32. Fedele M, Cerchia L, Pegoraro S, Sgarra R, Manfioletti G. Proneural-Mesenchymal Transition: phenotypic Plasticity to Acquire Multitherapy Resistance in Glioblastoma. Int J mol Sci. 2019;20(11). doi:10.3390/ijms20112746
33. Khedri A, Guo S, Ramar V, Hudson B, Liu M. FOSL1’s Oncogene Roles in Glioma/Glioma Stem Cells and Tumorigenesis: a Comprehensive Review. Int J mol Sci. 2024;25(10):5362. doi:10.3390/ijms25105362
34. Wan J, Guo AA, Chowdhury I, et al. TRPM7 Induces Mechanistic Target of Rap1b Through the Downregulation of miR-28-5p in Glioma Proliferation and Invasion. Front Oncol. 2019;9:1413. doi:10.3389/fonc.2019.01413
35. Anders S, Huber W. Differential expression analysis for sequence count data. Genome Biol. 2010;11(10):R106. doi:10.1186/gb-2010-11-10-r106
36. Yu G, Wang LG, Han Y, He QY. clusterProfiler: an R package for comparing biological themes among gene clusters. Omics. 2012;16(5):284–287. doi:10.1089/omi.2011.0118
37. Subramanian A, Tamayo P, Mootha VK. Gene set enrichment analysis: a knowledge-based approach for interpreting genome-wide expression profiles. Proc Natl Acad Sci USA. 2005;102(43):15545–15550. doi:10.1073/pnas.0506580102
38. Mortazavi A, Williams BA, McCue K, Schaeffer L, Wold B. Mapping and quantifying mammalian transcriptomes by RNA-Seq. Nat Methods. 2008;5(7):621–628. doi:10.1038/nmeth.1226
39. King P, Wan J, Guo AA, Guo S, Jiang Y, Liu M. Regulation of gliomagenesis and stemness through acid sensor ASIC1a. Int J Oncol. 2021;59(4). doi:10.3892/ijo.2021.5262
40. Lopes C, Madureira TV, Gonçalves JF, Rocha E. Disruption of classical estrogenic targets in brown trout primary hepatocytes by the model androgens testosterone and dihydrotestosterone. Aquat Toxicol. 2020;227:105586. doi:10.1016/j.aquatox.2020.105586
41. Zhang Y, Wu X, Zhu J, Lu R, Ouyang Y. Knockdown of SLC39A14 inhibits glioma progression by promoting erastin-induced ferroptosis SLC39A14 knockdown inhibits glioma progression. BMC Cancer. 2023;23(1):1120. doi:10.1186/s12885-023-11637-0
42. Ramar V, Guo S, Hudson B, et al. Interaction of NF-κB and FOSL1 drives glioma stemness. Cellular mol Life Sci. 2024;81(1):255. doi:10.1007/s00018-024-05293-1
43. Eferl R, Wagner EF. AP-1: a double-edged sword in tumorigenesis. Nat Rev Cancer. 2003;3(11):859–868. doi:10.1038/nrc1209
44. Shaulian E, Karin M. AP-1 as a regulator of cell life and death. Nat Cell Biol. 2002;4(5):E131–136. doi:10.1038/ncb0502-e131
45. Herdegen T, Leah JD. Inducible and constitutive transcription factors in the mammalian nervous system: control of gene expression by Jun, Fos and Krox, and CREB/ATF proteins. Brain Res Brain Res Rev. 1998;28(3):370–490. doi:10.1016/s0165-0173(98)00018-6
46. Dang HH, Ta HDK, Nguyen TTT, et al. Identifying GPSM Family Members as Potential Biomarkers in Breast Cancer: a Comprehensive Bioinformatics Analysis. Biomedicines. 2021;9(9). doi:10.3390/biomedicines9091144
47. Tran TO, Lam LHT, Le NQK. Hyper-methylation of ABCG1 as an epigenetics biomarker in non-small cell lung cancer. Funct Integr Genomics. 2023;23(3):256. doi:10.1007/s10142-023-01185-y
48. Shi Y, Wu M, Liu Y, et al. ITGA5 Predicts Dual-Drug Resistance to Temozolomide and Bevacizumab in Glioma. Front Oncol. 2021;11:769592. doi:10.3389/fonc.2021.769592
49. Zeng HL, Li H, Yang Q, Li CX. Transcriptomic Characterization of Copper-Binding Proteins for Predicting Prognosis in Glioma. Brain Sci. 2023;13(10):1460. doi:10.3390/brainsci13101460
50. Deng L, Zeng S, Yi Q, Song L. High expression of six-transmembrane epithelial antigen of prostate 3 promotes the migration and invasion and predicts unfavorable prognosis in glioma. PeerJ. 2023;11:e15136. doi:10.7717/peerj.15136
51. Wang Y, Zhao W, Liu X, Guan G, Zhuang M. ARL3 is downregulated and acts as a prognostic biomarker in glioma. J Transl Med. 2019;17(1):210. doi:10.1186/s12967-019-1914-3
52. Togi S, Muromoto R, Hirashima K. A New STAT3-binding Partner, ARL3, Enhances the Phosphorylation and Nuclear Accumulation of STAT3. J Biol Chem. 2016;291(21):11161–11171. doi:10.1074/jbc.M116.724849
53. Luo G, Sun Y, Feng R, Zhao Q, Wen T. ARL3 subcellular localization and its suspected role in autophagy. Biochimie. 2018;154:187–193. doi:10.1016/j.biochi.2018.09.007
54. Menna G, Mattogno PP, Donzelli CM, Lisi L, Olivi A, Della Pepa GM. Glioma-Associated Microglia Characterization in the Glioblastoma Microenvironment through a ‘Seed-and Soil’ Approach: a Systematic Review. Brain Sciences. 2022;12(6):718.
55. Desgrosellier JS, Cheresh DA. Integrins in cancer: biological implications and therapeutic opportunities. Nat Rev Cancer. 2010;10(1):9–22. doi:10.1038/nrc2748
56. Li G, Ma L, Feng C. MZ1, a BRD4 inhibitor, exerted its anti-cancer effects by suppressing SDC1 in glioblastoma. BMC Cancer. 2024;24(1):220. doi:10.1186/s12885-024-11966-8
57. Zeng L, Zheng W, Liu X, et al. SDC1-TGM2-FLOT1-BHMT complex determines radiosensitivity of glioblastoma by influencing the fusion of autophagosomes with lysosomes. Theranostics. 2023;13(11):3725–3743. doi:10.7150/thno.81999
58. Chen G, Zhou T, Ma T, Cao T, Yu Z. Oncogenic effect of PHLDB2 is associated with epithelial-mesenchymal transition and E-cadherin regulation in colorectal cancer. Can Cell Inter. 2019;19(1):184. doi:10.1186/s12935-019-0903-1
59. Lv J, Zhang S, Liu Y. NR2F1-AS1/miR-190a/PHLDB2 Induces the Epithelial-Mesenchymal Transformation Process in Gastric Cancer by Promoting Phosphorylation of AKT3. Front Cell Dev Biol. 2021;9:688949. doi:10.3389/fcell.2021.688949
60. Liao Y, Qiu X, Liu J, Zhang Z, Liu B, Jin C. The role of m6A-modified CircEPHB4 in glioma pathogenesis: insights into cancer stemness metastasis. Ann Clin Transl Neurol. 2023;10(10):1749–1767. doi:10.1002/acn3.51864
61. Luo M, Huang Z, Yang X. PHLDB2 Mediates Cetuximab Resistance via Interacting With EGFR in Latent Metastasis of Colorectal Cancer. Cell mol Gastroenterol Hepatol. 2022;13(4):1223–1242. doi:10.1016/j.jcmgh.2021.12.011
62. Dumitru AV, Țăpoi DA, Halcu G, et al. The Polyvalent Role of CD30 for Cancer Diagnosis and Treatment. Cells. 2023;12(13):1783. doi:10.3390/cells12131783
63. Liu X, Zhang L, Chen L. Establishment of a novel cytokine-related 8-gene signature for distinguishing and predicting the prognosis of triple-negative breast cancer. Front Med Lausanne. 2023;10:1189361. doi:10.3389/fmed.2023.1189361
64. Duffy MJ, Mullooly M, O’Donovan N, et al. The ADAMs family of proteases: new biomarkers and therapeutic targets for cancer? Clin Proteomics. 2011;8(1):9. doi:10.1186/1559-0275-8-9
65. Edwards DR, Handsley MM, Pennington CJ. The ADAM metalloproteinases. mol Aspects Med. 2008;29(5):258–289. doi:10.1016/j.mam.2008.08.001
66. Moss ML, Bartsch JW. Therapeutic benefits from targeting of ADAM family members. Biochemistry. 2004;43(23):7227–7235. doi:10.1021/bi049677f
67. Blobel CP. ADAMs: key components in EGFR signalling and development. Nat Rev mol Cell Biol. 2005;6(1):32–43. doi:10.1038/nrm1548
68. Murphy G. The ADAMs: signalling scissors in the tumour microenvironment. Nat Rev Cancer. 2008;8(12):929–941. doi:10.1038/nrc2459
69. Sperling S, Fiedler P, Lechner M. Chronic CD30 signaling in B cells results in lymphomagenesis by driving the expansion of plasmablasts and B1 cells. Blood. 2019;133(24):2597–2609. doi:10.1182/blood.2018880138
70. Shinoda K, Sun X, Oyamada A, Yamada H, Kira J, Yoshikai Y. Requirement of CD30 expression on CD4 T cells in the pathogenesis of experimental autoimmune encephalomyelitis. J Neuroimmunol. 2016;291:39–45. doi:10.1016/j.jneuroim.2015.12.005
71. Wildeboer D, Naus S, Amy Sang QX, Bartsch JW, Pagenstecher A. Metalloproteinase disintegrins ADAM8 and ADAM19 are highly regulated in human primary brain tumors and their expression levels and activities are associated with invasiveness. J Neuropathol Exp Neurol. 2006;65(5):516–527. doi:10.1097/01.jnen.0000229240.51490.d3
72. Dong F, Eibach M, Bartsch JW. The metalloprotease-disintegrin ADAM8 contributes to temozolomide chemoresistance and enhanced invasiveness of human glioblastoma cells. Neuro-Oncology. 2015;17(11):1474–1485. doi:10.1093/neuonc/nov042
73. Schlomann U, Koller G, Conrad C. ADAM8 as a drug target in pancreatic cancer. Nat Commun. 2015;6(1):6175. doi:10.1038/ncomms7175
74. Wang J, Zhang J, Wang J, Hu X, Ouyang L, Wang Y. Small-Molecule Modulators Targeting Toll-like Receptors for Potential Anticancer Therapeutics. J Med Chem. 2023;66(10):6437–6462. doi:10.1021/acs.jmedchem.2c01655
75. Turco V, Pfleiderer K, Hunger J. T cell-independent eradication of experimental glioma by intravenous TLR7/8-agonist-loaded nanoparticles. Nat Commun. 2023;14(1):771. doi:10.1038/s41467-023-36321-6
76. Sun H, Li Y, Zhang P, et al. Targeting toll-like receptor 7/8 for immunotherapy: recent advances and prospectives. Biomarker Res. 2022;10(1):89. doi:10.1186/s40364-022-00436-7
77. Dominguez MH, Ayoub AE, Rakic P. POU-III transcription factors (Brn1, Brn2, and Oct6) influence neurogenesis, molecular identity, and migratory destination of upper-layer cells of the cerebral cortex. Cereb. Cortex. 2013;23(11):2632–2643.
78. Ishii J, Sato H, Sakaeda M. POU domain transcription factor BRN2 is crucial for expression of ASCL1, ND1 and neuroendocrine marker molecules and cell growth in small cell lung cancer. Pathol Int. 2013;63(3):158–168. doi:10.1111/pin.12042
79. Boyle GM, Woods SL, Bonazzi VF, et al. Melanoma cell invasiveness is regulated by miR-211 suppression of the BRN2 transcription factor. Pigm Cell Mel Res. 2011;24(3):525–537.
80. Pinner S, Jordan P, Sharrock K, et al. Intravital imaging reveals transient changes in pigment production and Brn2 expression during metastatic melanoma dissemination. Cancer Res. 2009;69(20):7969–7977. doi:10.1158/0008-5472.CAN-09-0781
81. Bishop JL, Thaper D, Vahid S. The Master Neural Transcription Factor BRN2 Is an Androgen Receptor-Suppressed Driver of Neuroendocrine Differentiation in Prostate Cancer. Cancer Discovery. 2017;7(1):54–71. doi:10.1158/2159-8290.CD-15-1263
82. Cui T, Bell EH, McElroy J. A Novel miR-146a-POU3F2/SMARCA5 Pathway Regulates Stemness and Therapeutic Response in Glioblastoma. mol Cancer Res. 2021;19(1):48–60. doi:10.1158/1541-7786.MCR-20-0353
83. Zhang JF, Chen Y, Lin GS, et al. High IFIT1 expression predicts improved clinical outcome, and IFIT1 along with MGMT more accurately predicts prognosis in newly diagnosed glioblastoma. Human Pathol. 2016;52:136–144. doi:10.1016/j.humpath.2016.01.013
84. Qiao W, Fan J, Shang X, et al. Bioinformation Analysis Reveals IFIT1 as Potential Biomarkers in Central Nervous System Tuberculosis. Infect Drug Resist. 2022;15:35–45. doi:10.2147/IDR.S328197
85. Paul D, Islam S, Manne RK, et al. F-box protein FBXO16 functions as a tumor suppressor by attenuating nuclear β-catenin function. J Pathol. 2019;248(3):266–279. doi:10.1002/path.5252
86. Khan M, Muzumdar D, Shiras A. Attenuation of Tumor Suppressive Function of FBXO16 Ubiquitin Ligase Activates Wnt Signaling In Glioblastoma. Neoplasia. 2019;21(1):106–116. doi:10.1016/j.neo.2018.11.005
87. Ji M, Zhao Z, Li Y, et al. FBXO16-mediated hnRNPL ubiquitination and degradation plays a tumor suppressor role in ovarian cancer. Cell Death Dis. 2021;12(8):758.
88. Li H, Li M, Tang C, Xu L. Screening and prognostic value of potential biomarkers for ovarian cancer. Ann Translat Med. 2021;9(12):1007. doi:10.21037/atm-21-2627
89. Kazi JU, Kabir NN, Rönnstrand L. Brain-Expressed X-linked (BEX) proteins in human cancers. BBA. 2015;1856(2):226–233. doi:10.1016/j.bbcan.2015.09.001
90. Foltz G, Ryu G-Y, Yoon J-G. Genome-Wide Analysis of Epigenetic Silencing Identifies BEX1 and BEX2 as Candidate Tumor Suppressor Genes in Malignant Glioma. Cancer Res. 2006;66(13):6665–6674. doi:10.1158/0008-5472.CAN-05-4453
91. Wang Q, Liang N, Yang T. DNMT1-mediated methylation of BEX1 regulates stemness and tumorigenicity in liver cancer. J Hepatol. 2021;75(5):1142–1153. doi:10.1016/j.jhep.2021.06.025
92. He X, Zhang Y, Fang Q. Unraveling the role of CD24 in Hepatocellular carcinoma: involvement of inactivated Hippo signaling and SOX4-mediated regulation. Biochim Biophys Acta mol Basis Dis. 2024;1870(4):167117. doi:10.1016/j.bbadis.2024.167117
93. Du Y, Li R, Fu D, et al. Multi-omics technologies and molecular biomarkers in brain tumor-related epilepsy. CNS Neurosci Ther. 2024;30(4):e14717.
 © 2025 The Author(s). This work is published and licensed by Dove Medical Press Limited. The
full terms of this license are available at https://www.dovepress.com/terms
and incorporate the Creative Commons Attribution
- Non Commercial (unported, 4.0) License.
By accessing the work you hereby accept the Terms. Non-commercial uses of the work are permitted
without any further permission from Dove Medical Press Limited, provided the work is properly
attributed. For permission for commercial use of this work, please see paragraphs 4.2 and 5 of our Terms.
© 2025 The Author(s). This work is published and licensed by Dove Medical Press Limited. The
full terms of this license are available at https://www.dovepress.com/terms
and incorporate the Creative Commons Attribution
- Non Commercial (unported, 4.0) License.
By accessing the work you hereby accept the Terms. Non-commercial uses of the work are permitted
without any further permission from Dove Medical Press Limited, provided the work is properly
attributed. For permission for commercial use of this work, please see paragraphs 4.2 and 5 of our Terms.