Back to Journals » Clinical Interventions in Aging » Volume 19
Risk Factors Analysis and Nomogram Model Establishment of Hidden Blood Loss in Overweight and Obese Elderly Patients After Total Hip Arthroplasty
Authors Sun Y ![]() , Miao H, Gong H, Zhang Y, Hong W
, Miao H, Gong H, Zhang Y, Hong W
Received 30 June 2023
Accepted for publication 1 December 2023
Published 10 January 2024 Volume 2024:19 Pages 57—66
DOI https://doi.org/10.2147/CIA.S428307
Checked for plagiarism Yes
Review by Single anonymous peer review
Peer reviewer comments 2
Editor who approved publication: Prof. Dr. Nandu Goswami
Yu Sun,* Haixiang Miao,* Han Gong, Yaxin Zhang, Weishi Hong
Department of Orthopedics, Northern Jiangsu People’s Hospital Affiliated to Yangzhou University, Northern Jiangsu People’s Hospital Affiliated to Nanjing University, Yangzhou, Jiangsu, People’s Republic of China
*These authors contributed equally to this work
Correspondence: Yu Sun; Weishi Hong, Email [email protected]; [email protected]
Background: Total hip arthroplasty (THA) has become the first-choice treatment for elderly patients with end-stage hip disease. The high amount of hidden blood loss (HBL) in overweight and obese patients after THA not only affects rapid recovery, but also results in a greater economic burden. We aimed to identify risk factors that contribute to elevated HBL in overweight and obese patients after THA by retrospective analysis, and establish a nomogram prediction model for massive HBL in overweight and obese patients after THA.
Methods: A total of 505 overweight and obese patients treated with THA were included and randomly divided into modeling and validation sets according to a 7:3 ratio. The demographic and relevant clinical data of the patients were collected. The independent risk factors affecting HBL after THA in overweight and obese patients were obtained by Pearson, independent sample T-test, and multiple linear regression analyses. R software was used to establish a nomogram prediction model for postoperative HBL, as well as a receiver operating characteristic (ROC) curve, calibration curve, and decision curve analysis (DCA).
Results: HBL was 911± 438 mL, accounting for 79.5± 13.1% of the total perioperative blood loss (1104± 468 mL). A multiple linear regression analysis showed that HBL was associated with necrosis of the femoral head, absence of hypertension, longer operative time, higher preoperative erythrocytes, and higher preoperative D-dimer levels. The areas under the ROC curve (AUC) for the modeling and validation sets were 0.751 and 0.736, respectively, while the slope of the calibration curve was close to 1. The DCA curve demonstrated a better net benefit at a risk of HBL ≥ 1000 ml in both the training and validation groups.
Conclusion: HBL was an important component of total blood loss (TBL) after THA in overweight and obese patients. Necrosis of the femoral head, absence of hypertension, longer operative time, higher preoperative erythrocytes, and higher preoperative D-dimer levels were independent risk factors for postoperative HBL in these patients. The predictive model constructed based these data had better discriminatory power and accuracy, and could result in better net benefit for patients.
Keywords: total Hip arthroplasty, hidden blood loss, overweight and obese, risk factors, nomogram prediction model
Introduction
Total hip arthroplasty (THA) is a common treatment for hip joint diseases in elderly patients, such as aseptic necrosis of the femoral head, femoral neck fractures, and other end-stage hip diseases.1,2 The mean perioperative blood loss in primary unilateral THA is 1944 ml,3 increasing the probability of postoperative allogeneic transfusion,4 which may lead to an increase in complications, mortality, and length and cost of hospital stays. However, total blood loss (TBL) after THA is higher than that actually observed, as first described in 1973 by Pattison et al and formally defined as hidden blood loss (HBL) in 2000.5,6 Blood infiltration into the tissues, blood accumulation around the joints, and hemolysis contribute to the formation of HBL.5–7
The incidence rate of overweight and obese patients has gradually increased in recent years,8 and these are the most important causes of morbidity and mortality in the world. Related complications, such as diabetes, hypertension, dyslipidemia, and cardiometabolic diseases, have brought a heavy burden to the physical health of the affected population, as well as great challenges to perioperative management.9,10 Furthermore, postoperative HBL is often higher in overweight and obese patients, which may be related to the damage of red blood cell membranes and hemoglobin peroxidation caused by more free fatty acids in the blood circulation.11,12 This undoubtedly adds insult to injury for patients who already have obesity related complications. We, therefore, aimed to identify risk factors that contribute to elevated HBL in overweight and obese patients after THA by retrospective analysis. R software was used to establish a nomogram prediction model for massive HBL in overweight and obese patients after THA. Moreover, receiver operating characteristic curve (ROC), calibration curves, and decision curve analysis (DCA) were performed to evaluate the differentiation, accuracy, and clinical efficacy of the nomogram model. These results will provide guidance to reduce HBL in overweight and obese patients after THA.
Data and Methods
Patients
A total of 505 overweight and obese patients diagnosed with femoral neck fracture or osteonecrosis of the femoral head were enrolled in this study and randomly divided into modeling and validation sets according to a 7:3 ratio. All patients received primary THA, which was performed by the same team of orthopedic surgeons between January 2018 and November 2021. This study was conducted in accordance with the Declaration of Helsinki and approved by the Ethics Committee of Northern Jiangsu People’s Hospital (protocol code: 2022KY212). The need for informed consent from patients was waived by the board, since it was a retrospective cross-sectional study. We included patients with a definite indication for THA; who had not undergone surgery of the affected hip joint; with a body mass index (BMI) ≥ 24; age ≥ 60 years; no serious cardiovascular or cerebrovascular problems within 6 months before surgery; and true and complete medical records. The exclusion criteria were hematologic diseases, preoperative blood transfusion, neoplastic diseases, pathological fractures, and other contraindications to surgery.
Perioperative Treatment
All patients underwent THA using the Moore posterolateral approach. General or intrathecal anesthesia was administered according to an anesthetist consultation. The incision lengths ranged from 10 to 15 cm, and a non-cemented prosthesis was used in all cases. After installing the prostheses, the surgical area was flushed and hemostasis was achieved by electrocoagulation. Local tranexamic acid was injected to stop bleeding and no intraoperative drain was placed. Cefazolin (2 g) was administered prophylactically intravenously 30 min before surgery, and subsequently administered intravenously within 24 h postoperatively to prevent infection. Low molecular heparin sodium was used perioperatively to prevent deep vein thrombosis.
Data Acquisition
The collected information of all patients included sex, age, diagnosis (patients with femoral neck fractures were considered to be Garden III and IV, while patients with femoral head necrosis were classified as Ficat III and IV), hypertension, diabetes, cardiovascular disease, American Society of Anesthesiologists score (ASA), operation time, preoperative red blood cell (RBC) count, preoperative platelets (PLT), preoperative prothrombin time (PT), preoperative activated partial thrombin time (APTT), preoperative international normalized ratio (INR), preoperative thrombin time (TT), preoperative fibrinogen (FIB), preoperative D-Dimers, preoperative blood calcium, preoperative erythrocyte sedimentation rate (ESR), hemoglobin (HGB) level, hematocrit (HCT) level, and systolic blood pressure at the beginning and after surgery. Moreover, parameters including intraoperative blood loss, estimated blood volume (EBV), HGB loss, HCT level loss, visible blood loss, TBL, HBL, percentage of HBL in TBL, and percentage of HBL in EBV were calculated.
Calculation of HBL
Intraoperative blood loss was calculated as follows: total fluid in the negative pressure aspirator - lavage fluid used during surgery + gauze weighed during surgery. The EBV was calculated according to the Nadler formula: EBV = K1 × height (m)3 + K2 × weight (kg) + K3. When the patient was male, K1 = 0.3669, K2 = 0.03219, and K3 = 0.6041; female, K1 = 0.3561, K2 = 0.03308, and K3 = 0.1833.13 TBL was calculated according to Gross’s formula: TBL = EBV × (preoperative HCT - postoperative HCT)/average value of HCT.14 HBL = TBL + transfusion volume - visible blood loss (postoperative drainage + intraoperative blood loss).15
Statistical Analysis of Risk Factors
The collected data of the modeling set were analyzed using SPSS 22.0 statistical software. Descriptive statistics are expressed as mean ± standard deviation or number of cases and percentages. An independent samples T-test was used to calculate significant differences in HBL between different count data, while Pearson’s variance was used for differences analysis between measurement data. Statistically significant variables were selected for multiple linear regression analysis, and the final independent risk factors associated with HBL were obtained. Positive coefficients indicated a positive effect on the dependent variable (HBL) and negative coefficients indicated a negative effect. All independent variables were included in the model. P < 0.05 was considered a statistically significant difference.
Establishment and Verification of the Nomogram Prediction Model
The independent risk factors for HBL obtained from the above analysis in the modeling set were incorporated as independent variables using R software to build a prediction model for HBL after THA in overweight and obese patients, which was subsequently plotted as a visualized nomogram graph. Then, the ROC curve, calibration curve, and DCA of the modeling set and the validation set were drawn. The area under the ROC curve (AUC) and calibration curve were used to evaluate the differentiation and accuracy of the nomogram model. Moreover, DCA, a statistical method to assess predictive models and diagnostic tests, was performed to evaluate the clinical efficacy of the nomogram model, to overcome the limitations of traditional statistical metrics by calculating the clinical “net benefit” of predictive models or diagnostic tests by comparing the default clinical strategy of treating “all or nothing” patients.
Results
Perioperative Parameters
The data from 354 overweight and obese patients in the modeling set were retrospectively analyzed. The mean age was 65.21±10.70 years and mean BMI was 26.67±2.17 kg/m2. The values of hemoglobin loss, hematocrit level loss, preoperative and postoperative HGB < 100 g/L, visible blood loss, TBL, HBL, percentage of HBL in TBL, and EBV are shown in Table 1. The mean TBL was 1104±468 ml, and the average HBL was 911±438 mL, accounting for 79.5±13.1% of TBL. There were eight cases (2.3%) with Hb < 100 g/L preoperatively; this increased to 158 cases (44.6%) postoperatively.
 |
Table 1 Perioperative Parameters of Patients |
Univariate Analysis
According to our univariate analysis, there were no significant correlations of HBL with sex, preoperative PLT, preoperative PT, preoperative APTT, preoperative INR, preoperative TT, preoperative FIB, preoperative ESR, diabetes, and cardiovascular disease. However, there were statistically significant differences in age, operative time, preoperative RBC, preoperative D-dimer, preoperative blood calcium, intraoperative blood loss, EDV, diagnosis, hypertension, and ASA score (P < 0.05). The analysis results of measurement and counting data are shown in Tables 2 and 3, respectively.
 |
Table 2 Results of Correlation Analysis of HBL and Independent Samples t-Test for Different Counting Data Groups. Data are Expressed as Mean ±SD *P<0.05 |
 |
Table 3 Results of Various Measurement Data and Pearson Correlation Analysis in the Perioperative Period of Patients. Data are Expressed as Mean ±SD, *P<0.05 |
Multivariate Analysis
Based on the results of the univariate analysis, 10 statistically significant variables were used as independent variables and HBL was used as a dependent variable. The results of the multiple linear regression analysis demonstrated that HBL was associated with diagnosis (regression coefficient = −344.397, P < 0.001), hypertension (regression coefficient = −257.271, P < 0.001), operative time (regression coefficient = 2.445, P = 0.001), preoperative RBC (regression coefficient = 104.005, P = 0.012), and preoperative D-dimer level (regression coefficient = 11.947, P = 0.048) (Table 4).
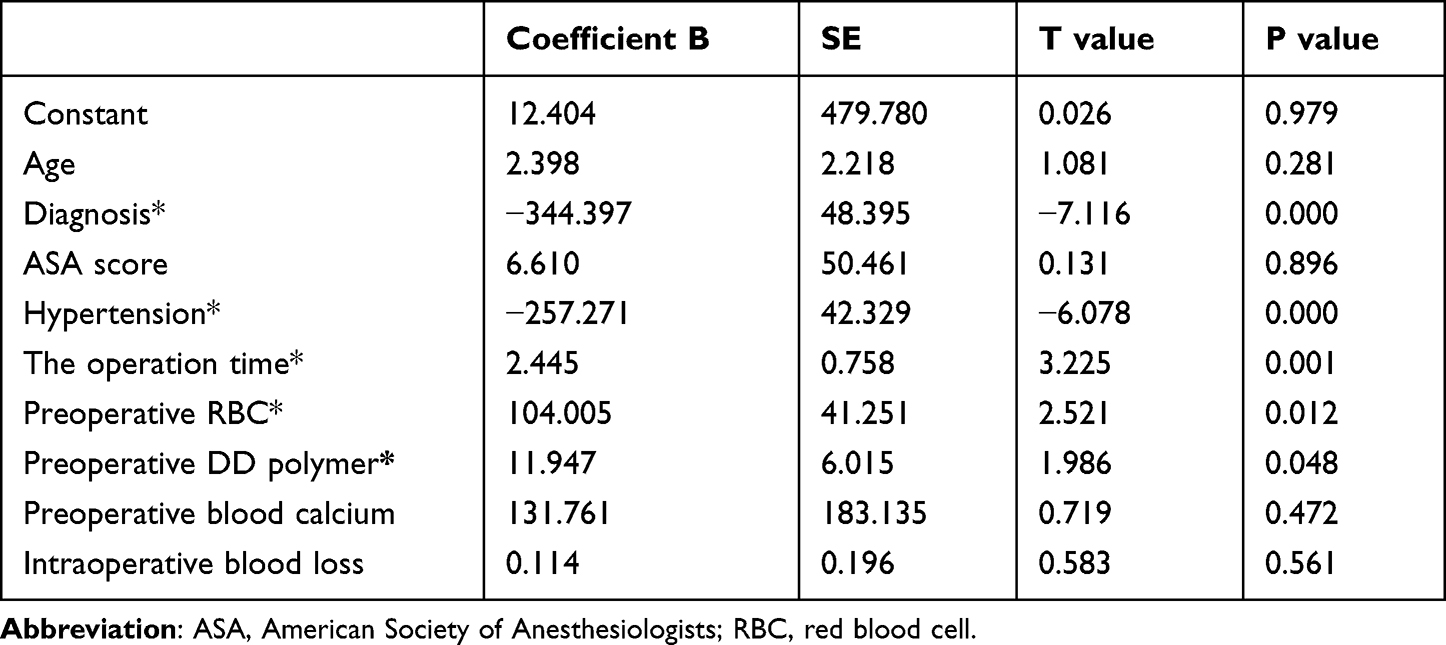 |
Table 4 Multiple Linear Regression Analysis of Risk Factors of HBL After THA. *P<0.05. Multiple Linear Regression Analysis Adjusted for All Variables in the Table. Adjusted R2 =0.319 |
Predictive Model Construction and Validation
Previous studies demonstrated that appropriate supplementation of concentrated RBCs was required to increase oxygen-carrying capacity when blood loss reaches 20% of total blood volume (approximately 1000 mL). Therefore, we used HBL = 1000 mL as the predicted outcome of the nomogram graph. R software was used to construct a nomogram prediction model of HBL after THA in overweight and obese patients based on the results of multiple linear regression analysis of the modeling set (Figure 1). Moreover, the ROC curves, calibration curves, and DCA curves for the modeling and validation sets were drawn.
 |
Figure 1 The nomogram constructed using HBL = 1000 mL as the predicted outcome in overweight and obese patients after THA. The model involves five factors: diagnosis, hypertension, operative time, preoperative erythrocytes, and preoperative D-dimer levels. The number of points for each of the five indicators on the top dotted axis of the nomogram are summed to obtain the total points, which corresponding to the bottom axis regarding probability that the patient will reach 1000 ml of HBL after THA. For example, Patient A had the following results: a diagnosis of femoral head necrosis, hypertension, preoperative RBC: 4.63, operative time: 75 min, preoperative D-dimer level: 0.51 (all marked with red dots in the graph); the final sum of each score is 221, which corresponds to a 39.8% probability of reaching 1000 ml of HBL postoperatively in this patient. |
AUC values of 0.751 and 0.736 were obtained for the training and validation groups, respectively (Figure 2). The slopes of the calibration curves were close to 1 in both groups (Figure 3). These results indicate that the prediction model has preferable discrimination and accuracy. Moreover, the DCA curve of the clinical prediction model (Figure 4) showed a better net benefit at a risk of HBL ≥ 1000 ml for overweight and obese patients in both the training and validation groups, indicating that the prediction model for overweight and obese patients could result in better net benefits for these patients.
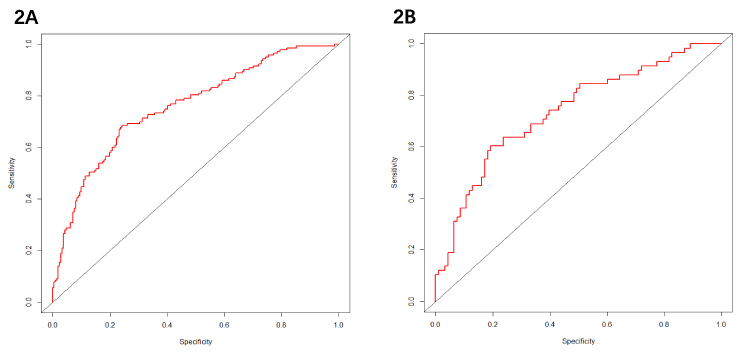 |
Figure 2 The ROC curve of HBL>1000ml in overweight and obese patients after THA. (A) The area under the curve was 0.758 and the confidence interval is 0.707 to 0.809 in training group; (B) The area under the curve was 0.736 and the confidence interval is 0.653 to 0.819 in validation group. |
 |
Figure 3 The calibration curves for the prediction of HBL>1000ml in overweight and obese patients after THA. (A) the training group; (B) the validation group. |
 |
Figure 4 The DCA of the nomogram for the HBL prediction in overweight and obese patients after THA. Note: (A) HBL>1000ml benefit in the training cohort. (B) HBL>1000ml benefit in the validation cohort. |
Discussion
In our study, 505 consecutive overweight and obese patients from 2018 to 2021 were collected, and HBL was calculated using the currently accepted Gross formula.16–18 The mean postoperative HBL of patients in the modeling set was 911±438 mL, accounting for 79.5±13.1% of the TBL (1104±468 mL), indicating that HBL plays an important role in increasing postoperative allogeneic transfusion compared to readily observable dominant blood loss. We demonstrated that necrosis of the femoral head, absence of hypertension, longer operative time, higher preoperative erythrocytes, and higher preoperative D-dimer levels were the risk factors for postoperative HBL in overweight and obese patients after THA. We further used HBL ≥ 1000 mL as the predicted outcome to construct a nomogram prediction model of HBL after THA, which may provide guidance to reduce HBL in overweight and obese patients after THA.
The mean postoperative HBL in patients with femoral head necrosis was recorded as 1069±406 mL, compared to 666±369 mL in patients with femoral neck fracture. Few previous studies report the difference between these two diagnoses in HBL. Patients with femur neck fractures require further examination after injury and a delay for the swelling to subside before THA. The body’s coagulation mechanism is fully activated before surgery, thus reducing the postoperative HBL. However, patients with femoral head necrosis have severe lesions in the acetabulum and femur, including osteophytes.19 During the surgical process, it is necessary to thoroughly polish the acetabulum and remove these osteophytes, which may generate more microscopic bleeding points and increase the amount of bleeding.
The influence of hypertension on postoperative HBL remains controversial.12,20,21 Patients with hypertension have more HBL after surgery due to their higher blood pressure and fragile capillaries, which can result in more small bleeding spots caused by intraoperative manipulation.21,22 In our study, hypertensive patients had less HBL compared to normotensive patients. As can be seen in our nomogram results, hypertensive patients decreased the weighting by approximately 35 points compared to normal patients. This may be because the higher intraoperative blood pressure in hypertensive patients allows us to better detect small bleeding points and thus achieve more adequate hemostasis through electrocoagulation. Moreover, we recorded the systolic blood pressure of each patient at the time of surgical skin incision, which was positively correlated with hypertension by independent sample T-test (T = 2.678, p = 0.008). A Pearson correlation analysis showed that systolic blood pressure at the beginning of surgery was negatively correlated with HBL (Pearson = −0.114, P = 0.032), which further confirmed our previous hypothesis to some extent. However, the systolic blood pressure of these patients at the time of surgical skin incision is not a good reflection of the overall blood pressure level during surgery, and the finding that patients with hypertension have less HBL after surgery may be the result of a combination of factors. This study only speculates this interesting possibility, and more rigorous experiments will need conducted in the future. In addition, we found a significant negative correlation between hypertension and preoperative red blood cell levels (T = 3.198, P = 0.002). Higher RBC levels before surgery tend to produce more HBL, which is precisely matched by less HBL in hypertensive patients after surgery.
Longer operative times result in greater surgical trauma and more small bleeding spots, which allows more blood to leak out into the tissue spaces and joint cavity.12,23–25 We found that a longer operative time was an important risk factor in postoperative HBL, which is similar to the results of previous studies. Longer operative times lead to more intraoperative blood loss and hemolysis due to postoperative inflammatory responses, which can lead to increased HBL. Each additional 100 minutes of operative time will add approximately 32 points of weight in the nomogram.
Higher preoperative erythrocyte levels were a protective factor against postoperative allogeneic transfusion. Most scientific societies recommend a restrictive erythrocytes transfusion policy (hemoglobin concentration of 6 g/dL to 8 g/dL) for patients with stable hemodynamics after surgery, but relatively liberal transfusions also exist in special clinical settings (hemoglobin concentrations of <9 g/dL to 10 g/dL).26,27 Compared with patients with lower preoperative erythrocytes and those who are relatively tolerant, overweight and obese patients with higher preoperative erythrocytes may have anemia symptoms such as dizziness and weakness when HGB is as low as 10 g/dL after surgery, indicating that this type of patient may be more suitable for lenient transfusion. Therefore, overweight and obese patients may have relatively more postoperative blood loss and more attention should be paid to these patients in this regard. In the present study, overweight and obese patients with higher preoperative erythrocytes tended to produce more HBL. This may be because higher preoperative erythrocyte levels leads to more hemolysis under the action of inflammatory factors and oxidative stress after surgery.28,29 Our nomogram demonstrated that the weight of the final outcome increases by 35 points when the increase of erythrocytes was 2*109/L before surgery. We also found a negative correlation between preoperative RBC and D-dimer levels (P < 0.001), perhaps related to the patient’s admission diagnosis. In patients with femoral neck fractures, blood loss due to trauma leads to a decrease in RBC levels, which leads to activation of the clotting system and an increase in D-dimer levels. This is supported by the fact that the differences between the patient’s admission diagnosis and preoperative erythrocyte (T = 6.633, P < 0.001) and D-dimer (T = −7.747, P < 0.001) levels were statistically significant.
D-dimer is a specific degradation product of fibrin monomer which is crosslinked by activating factor XIII and then hydrolyzed by plasminase. It is an indicator of lower limb venous thrombosis and is often used as a routine examination for patients with lower limb fractures.30,31 Since D-dimer is only produced during the formation and degradation of crosslinked fibrin, it can be used as a marker of coagulation and fibrinolytic system activation.32 In this study, we found that the weight decreased by approximately 13 points when preoperative D-dimer was increased by 8 mg/L. A higher preoperative D-dimer means that the patient’s clotting mechanism can be activated earlier, resulting in faster clotting of intraoperative bleeding sites, thereby reducing the production of HBL. This phenomenon was particularly obvious in patients with femoral neck fractures, and the independent sample T-test showed a statistically significant difference in preoperative D-dimer levels between patients with femoral neck fractures and those with femoral head necrosis (T = −7.747, P < 0.001). This result further proves our point.
To effectively evaluate the prediction accuracy of this nomogram, the validation sets that not involved in constructing the nomogram as external data were introduced to participate in validation. The ROC curves, calibration curves, and DCA curves were plotted for the modeling and validation sets, respectively. Our results indicated preferable discrimination and accuracy of the prediction model, and the DCA curve of the clinical prediction model showed a better net benefit.
Our study had some limitations. We conducted a retrospective study, the collected data may have selection and recall biases, and further prospective randomized controlled trials are needed to verify our findings. Moreover, this study is a single-center clinical study with a small sample size and could not include more research indicators. Multi-center clinical data should be combined to improve the research indicators and external verifications should be conducted in the future.
Conclusions
We demonstrated that HBL is an import
Data Sharing Statement
Patient data will only be used in the study and will not be disclosed to any third party without the explicit permission of the patient.
Funding
This study was supported by the key project of Jiangsu Commission of Health (Grant No: K2023047).
Disclosure
The authors report no conflicts of interest in this work.
References
1. Sayeed SA, Johnson AJ, Jaffe DE, et al. Incidence of contralateral THA after index THA for osteoarthritis. Clin Orthop Relat Res. 2012;470(2):535–540. doi:10.1007/s11999-011-2110-9
2. Scott CEH, Clement ND, Davis ET, et al. Modern total Hip arthroplasty: peak of perfection or room for improvement? Bone Joint J. 2022;104(2):189–192. doi:10.1302/0301-620X.104B2.BJJ-2022-0007
3. Lasocki S, Krauspe R, von Heymann C, et al. PREPARE: the prevalence of perioperative anaemia and need for patient blood management in elective orthopaedic surgery: a multicentre, observational study. Eur J Anaesthesiol. 2015;32(3):160–167. doi:10.1097/EJA.0000000000000202
4. Sharma R, Farrokhyar F, Mcknight LL, et al. Quality of assessment of randomized controlled trials in blood conservation after joint arthroplasty. J Arthroplasty. 2011;26(6):909–913. doi:10.1016/j.arth.2010.08.014
5. Pattison E, Protheroe K, Pringle RM, et al. Reduction in haemoglobin after knee joint surgery. Ann Rheum Dis. 1973;32(6):582–584. doi:10.1136/ard.32.6.582
6. Sehat KR, Evans R, Newman JH. How much blood is really lost in total knee arthroplasty? Correct blood loss management should take hidden loss into account. Knee. 2000;7(3):151–155. doi:10.1016/S0968-0160(00)00047-8
7. Faris PM, Ritter MA, Keating EM, et al. Unwashed filtered shed blood collected after knee and Hip arthroplasties. A source of autologous red blood cells. J Bone Joint Surg Am. 1991;73(8):1169–1178. doi:10.2106/00004623-199173080-00005
8. Caballero B. Humans against Obesity: who Will Win? Adv Nutr. 2019;10(suppl_1):S4–s9. doi:10.1093/advances/nmy055
9. Piché ME, Tchernof A, Després JP. Obesity Phenotypes, Diabetes, and Cardiovascular Diseases. Circ Res. 2020;126(11):1477–1500. doi:10.1161/CIRCRESAHA.120.316101
10. Vecchié A, Dallegri F, Carbone F, et al. Obesity phenotypes and their paradoxical association with cardiovascular diseases. Eur J Intern Med. 2018;48:6–17.
11. Miao K, Ni S, Zhou X, et al. Hidden blood loss and its influential factors after total Hip arthroplasty. J Orthopaedic Surg Res. 2015;10(1):36. doi:10.1186/s13018-015-0185-9
12. Lei F, Li Z, He W, et al. Hidden blood loss and the risk factors after posterior lumbar fusion surgery: a retrospective study. Medicine. 2020;99(19):e20103. doi:10.1097/MD.0000000000020103
13. Nadler SB, Hidalgo JH, Bloch T. Prediction of blood volume in normal human adults. Surgery. 1962;51(2):224–232.
14. Gross JB. Estimating allowable blood loss: corrected for dilution. Anesthesiology. 1983;58(3):277–280. doi:10.1097/00000542-198303000-00016
15. Sehat KR, Evans RL, Newman JH. Hidden blood loss following Hip and knee arthroplasty. Correct management of blood loss should take hidden loss into account. J Bone Joint Surg Br. 2004;86(4):561–565. doi:10.1302/0301-620X.86B4.14508
16. Wen L, Jin D, Xie W, et al. Hidden blood loss in anterior cervical fusion surgery: an analysis of risk factors. World Neurosurg. 2018;109:e625–e629.
17. Tian S, Li H, Liu M, et al. Dynamic analysis of perioperative hidden blood loss in intertrochanteric fractures. Clin Appl Thromb Hemost. 2019;25:107602961882327. doi:10.1177/1076029618823279
18. Xu K, Anwaier D, He R, et al. Hidden blood loss after Hip hemiarthroplasty using the superPATH approach: a retrospective study. Injury. 2019;50(12):2282–2286. doi:10.1016/j.injury.2019.10.013
19. Konarski W, Poboży T, Śliwczyński A, et al. Avascular necrosis of femoral head-overview and current state of the art. Int J Environ Res Public Health. 2022;19(12):7348. doi:10.3390/ijerph19127348
20. Wang T, Guo J, Hou Z. Risk factors for perioperative hidden blood loss after intertrochanteric fracture surgery in Chinese patients: a meta-analysis. Geriatr Orthop Surg Rehabil. 2022;13:215145932210838. doi:10.1177/21514593221083816
21. Wan RR, Wang YL, Wu XC, et al. Hidden blood loss and the influencing factors after laparoscopic cholecystectomy. ANZ J Surg. 2020;90(1–2):103–108. doi:10.1111/ans.15502
22. Keith I. Anaesthesia and blood loss in total Hip replacement. Anaesthesia. 1977;32(5):444–450. doi:10.1111/j.1365-2044.1977.tb09981.x
23. Manara J, Sandhu H, Wee M, et al. Prolonged operative time increases risk of blood loss and transfusion requirements in revision Hip surgery. Eur J Orthop Surg Traumatol. 2020;30(7):1181–1186. doi:10.1007/s00590-020-02677-4
24. Cai T, Chen D, Wang S, et al. Perioperative hidden blood loss in elderly cervical spondylosis patients with anterior cervical discectomy fusion and influencing factors. Geriatr Orthop Surg Rehabil. 2021;12:21514593211002164.
25. Cao D, Zhang S, Yang F, et al. Hidden blood loss and its influencing factors after percutaneous kyphoplasty surgery: a retrospective study. Medicine. 2018;97(15):e0435. doi:10.1097/MD.0000000000010435
26. Shander A, Gross I, Hill S, et al. A new perspective on best transfusion practices. Blood Transfus. 2013;11(2):193–202. doi:10.2450/2012.0195-12
27. Carson JL, Guyatt G, Heddle NM, et al. Clinical practice guidelines from the AABB: red blood cell transfusion thresholds and storage. JAMA. 2016;316(19):2025–2035. doi:10.1001/jama.2016.9185
28. Qian H, Yuan T, Tong J, et al. Antioxidants Attenuate Oxidative Stress-Induced Hidden Blood Loss in Rats. Turk J Haematol. 2017;34(4):334–339. doi:10.4274/tjh.2016.0469
29. Yuan T, Yang S, Lai C, et al. Pathologic mechanism of hidden blood loss after total knee arthroplasty: oxidative stress induced by free fatty acids. Int J Clin Exp Pathol. 2022;15(3):88–96.
30. Olson JD. D-dimer: an overview of hemostasis and fibrinolysis, assays, and clinical applications. Adv Clin Chem. 2015;69:1–46.
31. Adam SS, Key NS, Greenberg CS. D-dimer antigen: current concepts and future prospects. Blood. 2009;113(13):2878–2887. doi:10.1182/blood-2008-06-165845
32. Weitz JI, Fredenburgh JC, Eikelboom JW. A test in context: d-Dimer. J Am Coll Cardiol. 2017;70(19):2411–2420. doi:10.1016/j.jacc.2017.09.024
 © 2024 The Author(s). This work is published and licensed by Dove Medical Press Limited. The
full terms of this license are available at https://www.dovepress.com/terms
and incorporate the Creative Commons Attribution
- Non Commercial (unported, 3.0) License.
By accessing the work you hereby accept the Terms. Non-commercial uses of the work are permitted
without any further permission from Dove Medical Press Limited, provided the work is properly
attributed. For permission for commercial use of this work, please see paragraphs 4.2 and 5 of our Terms.
© 2024 The Author(s). This work is published and licensed by Dove Medical Press Limited. The
full terms of this license are available at https://www.dovepress.com/terms
and incorporate the Creative Commons Attribution
- Non Commercial (unported, 3.0) License.
By accessing the work you hereby accept the Terms. Non-commercial uses of the work are permitted
without any further permission from Dove Medical Press Limited, provided the work is properly
attributed. For permission for commercial use of this work, please see paragraphs 4.2 and 5 of our Terms.