Back to Journals » Drug Design, Development and Therapy » Volume 11
Rifapentine-linezolid-loaded PLGA microspheres for interventional therapy of cavitary pulmonary tuberculosis: preparation and in vitro characterization
Authors Huang J, Chen Z, Li Y, Li L, Zhang G
Received 16 November 2016
Accepted for publication 21 January 2017
Published 3 March 2017 Volume 2017:11 Pages 585—592
DOI https://doi.org/10.2147/DDDT.S127897
Checked for plagiarism Yes
Review by Single anonymous peer review
Peer reviewer comments 2
Editor who approved publication: Professor Jianbo Sun
Jieyun Huang,1,* Zhi Chen,2,* Ying Li,3 Li Li,2 Guangyu Zhang2
1The Second Clinical Medical College, Shanxi Medical University, Taiyuan, People’s Republic of China; 2Institute for Tuberculosis Research, The 309th Hospital of Chinese PLA, Beijing, People’s Republic of China; 3Department of Drug Delivery Research Center, Institute of Medicinal Plant Development, Chinese Academy of Medical Sciences and Peking Union Medical College, Beijing, People’s Republic of China
*These authors contributed equally to this work
Abstract: In this study, we aimed to design controlled-release microspheres for the treatment of cavitary pulmonary tuberculosis (TB) for solving the issues of poor drug delivery and short duration maintained at effective drug concentration during bronchoscopic interventional therapy. We fabricated rifapentine-linezolid-loaded poly(lactic acid-co-glycolic acid) microspheres (RLPMs) using the oil-in-water emulsion solvent evaporation method and assessed their in vitro release as well as the bronchial mucosal retention characteristics. The microspheres are spherical in shape with a circular concave on the surface. The particle size of RLPMs was 27.38±1.28 µm. The drug loading of rifapentine and linezolid was 18.51±0.26 and 8.42%±0.24%, respectively, while the encapsulation efficiencies were 55.53±0.78 and 16.87%±0.47%, respectively (n=3). During the burst release phase of the in vitro release test, 21.37%±0.68% rifapentine was released in 3 days and 43.56%±2.54% linezolid was released in 1 day. Then, both the drugs entered the sustained release phase. Finally, the cumulative percentage release of rifapentine and linezolid in 14 days was 27.61±1.52 and 51.01%±3.31%, respectively (n=3). Bronchoscopic observation revealed that the controlled-release microspheres could slowly release the drugs and retain them on the surface of bronchial mucosa of canines for 20 days. These results indicated that the fabricated microspheres exhibited a significant sustained release effect and could effectively retain the drugs on the surface of bronchial mucosa. Therefore, this study provides a theoretical and practical foundation for the development of fabricated microspheres loaded with multiple anti-TB drugs in the bronchoscopic interventional therapy of cavity pulmonary TB.
Keywords: rifapentine, linezolid, poly(lactic-co-glycolic acid), controlled-release microspheres, bronchoscopy, cavity pulmonary tuberculosis
Introduction
According to the WHO Global Tuberculosis Report 2015, there are 9.6 million patients with tuberculosis (TB) worldwide;1 among them patients with cavitary pulmonary TB account for 40%–87%.2 These patients are also an important source of TB infection.3 Compared to other patients with TB, patients with cavitary pulmonary TB show increased resistance against antituberculosis (anti-TB) drugs.4 Moreover, among patients with various forms of TB, they are the main group suffering from treatment failure and requiring retreatment.5 In the case of cavity pulmonary TB, anti-TB drugs can be delivered to the lesion site via a bronchoscope to solve the issues of poor therapeutic efficacy, such as difficulty in the closure of TB cavities and sputum conversion. However, the drugs selected currently for bronchoscopic local injection have poor sustained release effects and a shorter duration for which an effective drug concentration is maintained. Repeated drug administration will result in poorer patient compliance. To resolve this issue and improve the therapeutic efficacy in cavity pulmonary TB treatment, we developed controlled-release microspheres loaded with multiple anti-TB drugs, which exhibit a longer duration of sustained release and retention effects. The duration at which an effective drug concentration is maintained in the local tissues was prolonged through the sustained release of drugs in the cavity of pulmonary TB, thereby reducing the dose and frequency of oral and intravenous drug administration and improving patient compliance.
Rifapentine, belonging to the rifamycin class of antibiotics, is a new-generation, long-acting drug that exhibits good antibacterial potency against TB. It has been listed as a first-line anti-TB drug by the Medical Letter (US)-2007. Compared with the classical rifampin anti-TB drugs, rifapentine exhibits greater antibacterial effect and fewer adverse reactions. Additionally, it needs to be administered only twice a week, which reduces the number of administrations to patients, leading to better patient compliance.6 Linezolid is a synthetic antibiotic that belongs to the oxazolidinone class approved by the US Food and Drug Administration (FDA) in 2000. It can be used for the treatment of infections caused by Gram-positive bacteria and has been confirmed to exhibit an anti-TB effect by inhibiting the growth of Mycobacterium tuberculosis in a mouse model.7 It can also be used for the treatment of multidrug-resistant tuberculosis (MDR-TB) and extensively drug-resistant TB (XDR-TB).8,9 Both rifapentine and linezolid are soluble in dichloromethane (DCM), and no cross-resistance has been observed between them. Therefore, they can be used in combination to enhance the anti-TB effects. Hence, we selected these two drugs to fabricate drug-loaded, controlled-release microspheres.
Following degradation in the body over a long time, poly(lactic acid-co-glycolic acid) (PLGA) can be metabolized into lactic acid and glycolic acid, which are further converted via the citric acid cycle into carbon dioxide and water prior to being completely eliminated from the body.10 PLGA is nontoxic, nonirritating, and completely degradable, and it possesses good biocompatibility. Besides, it has been approved by the US FDA and European Medicine Agency as a carrier for the sustained release of drugs.11,12 The fabrication technique of drug-loaded PLGA microspheres using the emulsion solvent evaporation method has been well established. For instance, the rifampicin-loaded PLGA microsphere-sodium alginate in situ gel fabricated by Hu et al13 and the rifapentine-loaded PLGA microspheres fabricated by Wu et al14 exhibit significant sustained release effects.
In this study, we used PLGA as the auxiliary material, prepared the rifapentine-linezolid-loaded PLGA microspheres (RLPMs) by oil-in-water (O/W) emulsion solvent evaporation method, and investigated their physiochemical properties, including morphology, particle size, drug loading, and encapsulation efficiency. Besides, we also assessed their in vitro release characteristics and bronchial mucosal retention characteristics.
Materials and methods
Materials
Poly(D,L-lactide-co-glycolide) PLGA(lactide:glycolide 50:50, Mw 24,000–38,000) was purchased from Sigma-Aldrich Co. LLC (St Louis, Missouri, USA). The active pharmaceutical ingredients and standards of rifapentine and linezolid were purchased from Dalian Meilun Biology Technology Co. Ltd. (Dalian, People’s Republic of China). Polyvinyl alcohol (PVA1788 low viscosity) was purchased from Aladdin Co., Ltd. (Shanghai, People’s Republic of China). Dichloromethane (DCM), phosphoric acid, anhydrous methanol, anhydrous ethanol, and potassium dihydrogen phosphate were purchased from Beijing Chemical Works (Beijing, People’s Republic of China). Acetonitrile (high-performance liquid chromatography [HPLC]-grade) was purchased from Thermo Fisher Scientific Inc. (Waltham, MA, USA). The bronchoscope (BF-1T260) and bronchoscopic system (CV-260SL) were purchased from the Olympus Corporation (Tokyo, Japan).
Female Beagle dogs (mean weight: 10 kg) were purchased from Xinglong Experimental Animal Breeding Farm, Beijing, China. Throughout the study, the dogs were housed individually in stainless steel wire cages in a room that was monitored for temperature (25°C±3°C) and humidity (60%±8%). The dogs were fed a normal diet and given free access to water. The research was conducted in accordance with the Declaration of Helsinki and the Guide for Care and Use of Laboratory Animals as adopted and promulgated by the United National Institutes of Health. All experimental protocols were approved by the Review Committee for the Use of Animal Subjects of The 309th Hospital of Chinese PLA.
Microsphere preparation
The fabrication conditions for the microspheres are listed in Table 1. As both rifapentine and linezolid were soluble in DCM, we prepared the microspheres by using the O/W emulsion solvent evaporation method. Briefly, 600 mg PLGA and different mass ratios of rifapentine and linezolid were added and evenly mixed with 10 mL of DCM (dispersed phase) for further use. A beaker containing 100 mL of 2 wt% PVA aqueous solution (continuous phase) was incubated in a water bath (HH-1; Changzhou Zhengrong Instrument Co., Ltd., Changzhou, People’s Republic of China) at a constant temperature of 30°C and stirring speeds of 800, 1,000, and 1,400 rpm. The mixed solution was then added dropwise to the PVA aqueous solution using a 2 mL syringe. After continuous stirring for a certain time, DCM was completely volatilized. The remaining solution was subjected to low-speed centrifugation to harvest the hardened microspheres. Then, the microspheres were washed with purified water and centrifuged three times. The resulting microspheres were freeze-dried and stored in a refrigerator at −20°C.
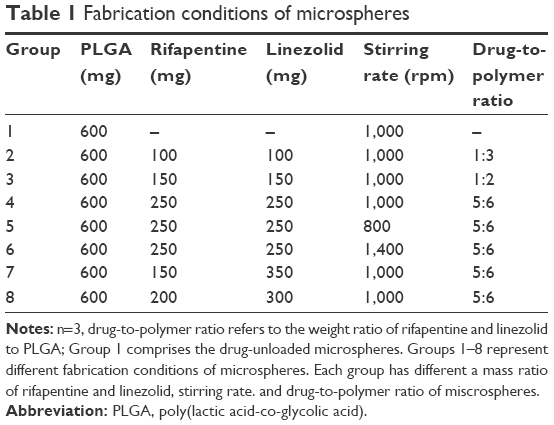 | Table 1 Fabrication conditions of microspheres |
HPLC and standard curves
Rifapentine and linezolid contents in the sample were determined by using HPLC. The HPLC system (Waters, Milford, MA, USA) includes the Waters e2695 system, Waters 2489 UV detector, and Empower Chromatography Data software package. Each test sample (20 μL) was injected into the Epic C18 (4.6×150 mm, 5 μm; ES industries Inc., West Berlin, NJ, USA) column. The flow rate of the mobile phase was 1 mL/min. The mobile phase for rifapentine was 45% KH2PO4 (0.0375 mol/L, pH 4) and 55% acetonitrile with the detection wavelength set at 335 nm. The mobile phase for linezolid was 25% KH2PO4 (0.0375 mol/L, pH 4) and 75% acetonitrile, and the detection wavelength used was 250 nm. The standard curves with concentrations ranging from 1 to 60 μg/mL (R2=0.9999) were drawn by measuring the contents of rifapentine and linezolid standards.
Microsphere morphology
The microsphere morphology was observed using a scanning electron microscope (SEM, JSM-6510LV; JEOL, Tokyo, Japan). The microspheres were mounted onto the copper cylinder by using a double-sided adhesive tape, and then coated with gold in an Auto Fine Coater (JFC-1600; JEOL). Then, the copper grid was placed in an SEM for observing the microsphere morphology.
Particle size and size distribution
The mean particle size and size distribution of the microspheres were measured using the Malvern Mastersizer 2000 particle size analyzer (Malvern Instruments Ltd., Malvern, UK). First, the refractive index of PLGA was set to 1.60 in the parameters of the particle size analyzer. Then, an appropriate amount of microspheres was suspended in constantly stirred distilled water, so that the laser obscuration was more than 5%. The particle size of the microspheres was measured when no air bubbles were present in the distilled water. The mean volume and particle size measured were taken as the mean particle size of the microspheres.
Drug loading and encapsulation efficiency
The microspheres (10 mg) were accurately weighed in a 50 mL flask. DCM (0.2 mL) was added to break the microsphere structure, followed by the addition of an appropriate amount of methanol to calibrate and dissolve rifapentine and linezolid in the microspheres. An appropriate amount of the lysate was filtered through a microporous filter membrane. The contents of rifapentine and linezolid were measured by using HPLC, and the encapsulation efficiency and drug loading were calculated. The drug loading of rifapentine and linezolid were calculated as the percent ratio of the actual drug content to the total microsphere weight, while the encapsulation efficiency was calculated as the percent ratio of the actual drug loading to the theoretical drug loading. The abovementioned experiments were repeated three times.
In vitro release test
The microspheres (10 mg) were enclosed in a sealed dialysis bag (with a molecular weight cut-off greater than 8,000) and placed in a 50 mL screw cap tube filled with phosphate-buffered saline (PBS, pH =7.4) and 0.1 mg/mL ascorbic acid. Ascorbic acid can prevent the oxidation and degradation of rifapentine as well as maintain its stability. Thus, ascorbic acid was added to the PBS release medium as an antioxidant.15 The tubes were placed in a shaking water bath (100 rpm) maintained at 37°C±0.5°C. At predetermined time points, 2 mL samples were collected and replenished with the same volume of fresh release medium. The collected release medium was filtered through a microporous filter membrane, and its drug content was measured using HPLC. The experiment was repeated three times. Finally, the cumulative percentage release and release rate curves of rifapentine and linezolid were plotted.
Bronchial mucosal retention test
The microspheres (500 mg) were dispersed by vortexing in 25 mL 1 wt% of sodium hyaluronate for further use. Five 10 kg female beagle dogs were anesthetized, and their right lower lobes (RLLs) were injected with 5 mL mixed solution via bronchoscope. The bronchial mucosa of the lungs was observed before drug administration and after 0 h, 3, 10, and 20 d of drug administration by using a bronchoscope. The bronchoscopic image information was collected.
Statistical analysis
The results are expressed as means ± standard deviation. All data were analyzed using the SPSS 23.0 software (IBM Corporation, Armonk, NY, USA), and the difference between the groups of data was compared using the one-way analysis of variance (ANOVA) with Tukey’s test, where P≤0.05 indicates a statistically significant difference.
Results and discussion
Investigation of the preparation technique
The scanning electron micrographs of the microspheres prepared under different conditions (Figure 1) show that the differences in the initial drug-to-polymer ratio and stirring speed resulted in differences in the morphology of controlled-release microspheres. The drug-unloaded PLGA microspheres are spherical in shape and have a smooth surface without protrusions or concaves (Figure 1A). When the initial drug-to-polymer ratio was lower or the stirring speed was too high, the resulting microspheres had local deformations and tiny circular concaves that were free from fine particles, with smooth interiors on the surface (Figure 1B, C, and F). When the initial drug-to-polymer ratio was higher or the stirring speed was lower, the surface area of the circular concaves gradually increased, with fine particles observed in the interiors (Figure 1D, E, G, and H). Similar phenomena were observed in PLLA microspheres encapsulating paclitaxel,16 PLGA microspheres encapsulating cyclosporine A,17 and PLGA microspheres encapsulating fusidic acid.18 The fine particles in the concaves on the microsphere surface were formed by the codeposition of undissolved drugs in the polymers as well as the drugs released from the drug-rich domains on the surface of the microspheres.19
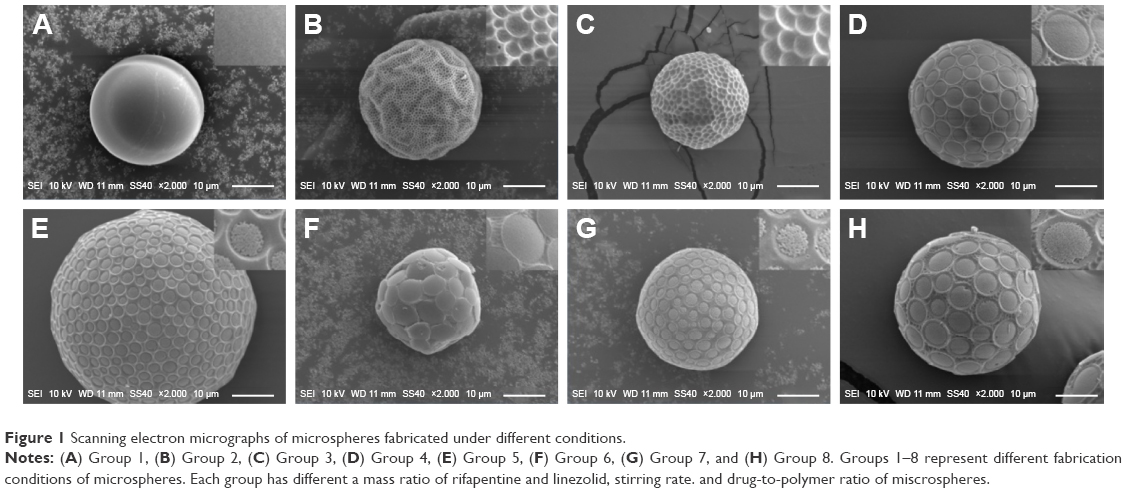 | Figure 1 Scanning electron micrographs of microspheres fabricated under different conditions. |
The particle sizes, drug loading of rifapentine and linezolid, and encapsulation efficiencies of the microspheres prepared under different conditions are summarized in Table 2. Groups 2, 3, and 4 investigated the effects of drug-to-polymer ratio on drug loading and encapsulation efficiency. The results showed that an increase in the initial drug-to-polymer ratio of rifapentine and linezolid led to an increase in the actual drug loading of both drugs from 10.22±0.26 and 3.85%±0.10% to 19.90±0.97 and 8.88%±0.28%, respectively. However, the encapsulation efficiencies decreased to 47.23±2.08 and 15.22%±0.48% from 61.32±1.58 and 23.10%±0.59%, respectively. According to Yeo and Park,20 the dispersed phase forms small droplets in the continuous phase. DCM volatizes from the droplets, and simultaneously, the polymer solidifies gradually, leading to the encapsulation of the dispersed phase. This is followed by the solidification process, which results in the formation of microspheres. The drugs in the dispersed phase diffuse to the continuous phase a few minutes before the formation of microspheres. An increase in the drug-to-polymer ratio prolongs the microsphere solidification process, and more drugs enter the continuous phase through diffusion. This leads to reduced drug encapsulation efficiency.10 Further, given the same drug-to-polymer ratio, linezolid can easily enter the continuous phase via diffusion during the process of microsphere formation owing to its greater solubility in water than that of rifapentine. Therefore, the drug loading and encapsulation efficiency of linezolid were lower than those of rifapentine.
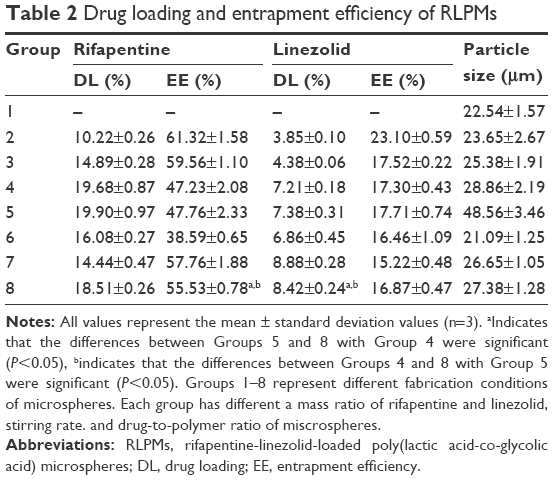 | Table 2 Drug loading and entrapment efficiency of RLPMs |
Groups 4, 5, and 6 investigated the effects of stirring speed on drug loading, encapsulation efficiency, and particle size. The results showed that the particle size, drug loading, and encapsulation efficiency of the microspheres gradually decreased with increasing stirring speed. When the stirring speeds were 800, 1,000, and 1,400 rpm, the particle sizes of the resulting microspheres were 48.56±3.46, 28.86±2.19, and 21.09±1.25 μm, respectively. This is because the shear force applied on the dispersed phase increased with increasing stirring speeds, which resulted in the formation of small droplets with a lower PLGA content per unit volume, in the continuous phase. Therefore, the volume and particle size of the microspheres decreased after solidification. A reduction in the droplet volume increased the total surface contact area between the continuous and dispersed phases. This led to the easier diffusion of the drugs from the dispersed phase to the continuous phase, thereby reducing the drug loading and encapsulation efficiency. The drug loading and encapsulation efficiencies of rifapentine and linezolid did not change greatly at stirring speeds of 800 and 1,000 rpm. However, at a stirring speed of 1,400 rpm, drug loading and encapsulation efficiency reduced significantly. In addition, the microsphere morphology of Group 6 observed under SEM (Figure 1F) showed that the resulting microspheres had a poor spherical shape with obvious deformations, which were worse than the former two groups (Figure 1D and E). Therefore, the stirring speed should not be too high.
Groups 4, 7, and 8 investigated the effects of drug ratios on drug loading and encapsulation efficiency. The results showed that when the ratio of linezolid increased, the drug loading of linezolid also increased from 7.21±0.18 to 8.88%±0.28%, but it was still lower than the minimum drug loading of rifapentine (14.44%±0.47%). According to the studies carried out by Metha et al21 and Boury et al,22 drug loading and encapsulation efficiency are closely related to the interaction between the drug and PLGA. For example, drugs with greater degree of interactions have a relatively higher drug loading and encapsulation efficiency. Therefore, we inferred that greater degree of interaction between rifapentine and PLGA results in higher drug loading and encapsulation efficiency than those of linezolid.
Optimal fabrication technique and particle size distribution
According to the results of ANOVA with Tukey’s test, Group 4, 5, and 8 showed the highest drug loading of rifapentine compared to that of the other groups (P<0.05). There were no significant differences in the drug loading of rifapentine and encapsulation efficiency of linezolid between these three groups (P>0.05). However, Group 8 showed a relatively higher drug loading of rifapentine and encapsulation efficiency of linezolid than those of the former two groups (P<0.05). Hence, we selected Group 8 fabrication technique as the optimum, which was performed as follows. Rifapentine (200 mg), linezolid (300 mg), and PLGA (600 mg) were dissolved in 10 mL DCM. Then, the mixed solution was transferred dropwise using a 2 mL syringe into 100 mL 2% wt PVA aqueous solution at a stirring speed of 1,000 rpm. The resulting microspheres were spherical in shape, with circular concaves containing fine particles on the surface (Figure 1H). The particle size of the microspheres was 27.38±1.28 μm with symmetrical distribution (Figure 2). The drug loading and encapsulation efficiency of rifapentine were 18.51±0.26 and 55.53%±0.78%, respectively, while the drug loading and encapsulation efficiency of linezolid were 8.42±0.24 and 16.87%±0.47%, respectively. In 2015, Wu et al14 optimized the process parameters of O/W emulsion solvent evaporation method to develop the drug delivery system of rifapentine for osteoarticular TB. The drug loading, encapsulation efficiency, and particle size of rifapentine-loaded PLGA microspheres were 17.16±0.40, 85.78±2.00, and 25.267 μm, respectively. The drug loading of RLPMs in this study was higher than that of rifapentine-loaded PLGA microspheres mentioned earlier, while the encapsulation efficiency was lower than that of rifapentine-loaded PLGA microspheres. However, no difference in particle size was observed between the RLPMs in this study and earlier studies. It is well known that improving the encapsulation efficiency could reduce the loss of PLGA in the drug preparation process. In addition, the RLPMs could release rifapentine and linezolid in local lesions, which in turn could improve the antibacterial ability against M. tuberculosis. Thus, RLPMs can improve the treatment of cavitary pulmonary TB.
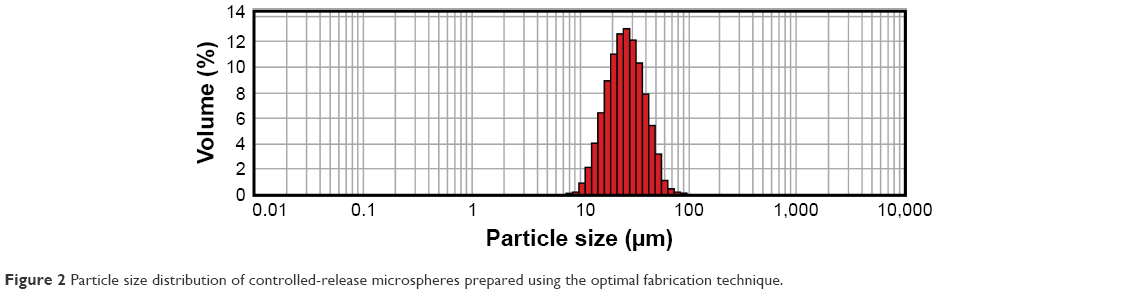 | Figure 2 Particle size distribution of controlled-release microspheres prepared using the optimal fabrication technique. |
In vitro release test results
The cumulative percentage release and the release rate curves of microspheres (Figures 3 and 4) show that during burst release phase, a great amount of rifapentine was released in 3 days; however, a great amount of linezolid was released in 1 day, which had a more significant burst release than rifapentine. Subsequently, at day 14, the release rate of rifapentine and linezolid reduced to 27.61±1.52 and 51.01%±3.31%, respectively. From the experimental results, we concluded that the resulting controlled-release microspheres could effectively control the burst release of drugs and extend the sustained release time of the drug.
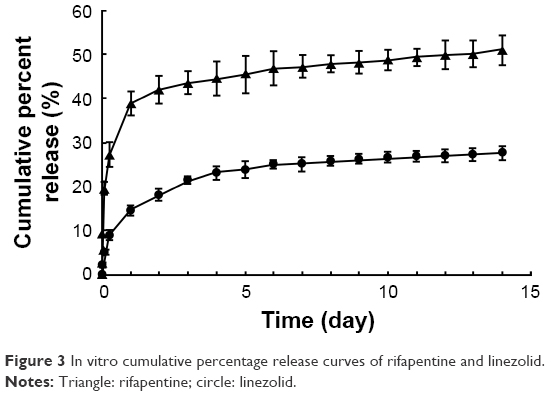 | Figure 3 In vitro cumulative percentage release curves of rifapentine and linezolid. |
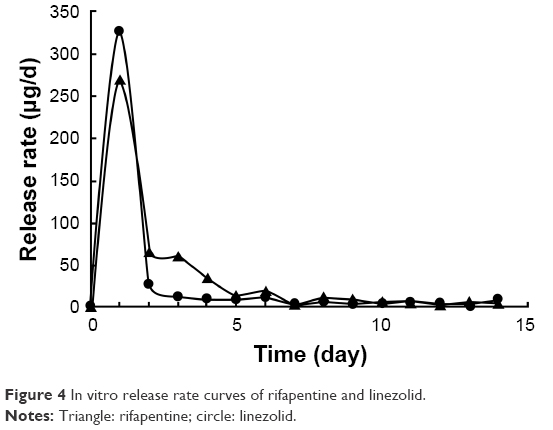 | Figure 4 In vitro release rate curves of rifapentine and linezolid. |
Burst release refers to the release of drugs in a certain amount from the microspheres, prior to the onset of polymer erosion-mediated drug release.23 This phenomenon is mainly associated with the entrance of drugs that are close to the surface of the microspheres to the release medium by diffusion, and the dissolution of free drugs on the surface of the microspheres in the release medium. However, linezolid has a greater hydrophilicity than rifapentine does, and it often tends to diffuse into the outer aqueous phase during the preparation of controlled-release microspheres. This reduces the encapsulation efficiency of linezolid, thereby resulting in its encapsulation in the outer layer or attachment to the surface of the microspheres. Thus, its cumulative percentage release curve during the burst release phase increased even faster. However, increasing the drug loading of rifapentine and linezolid and reducing their encapsulation efficiency exhibited a greater impact on the burst release. The contents of the drugs in the microspheres and free drugs on the surface of the microspheres increased owing to the increase in drug loading as well as the reduction in encapsulation efficiency. This further resulted in an increase in the amount of drugs dispersed to the release medium via diffusion and the amount of free drugs dissolved in the release medium. When the microspheres entered the sustained release phase, which is a slower process, the drug release was mainly associated with the degradation of PLGA microspheres as well as the entrance of drugs from the microspheres into the release medium via diffusion. Thus, the release rate curve rose slowly during the sustained release phase.12,14,24 In 2012, Gilchrist et al19 fabricated fusidic acid-rifampicin-loaded PLGA microspheres, and fusidic acid-rifampicin-loaded PLGA microspheres was characterized exclusively by a large initial burst release phase but minimal release thereafter, which was similar to the findings of this study.
Bronchial mucosal retention test
The retention and sustained release effects of microspheres in the lungs were evaluated by the microsphere bronchial mucosal retention test. Before drug administration, the bronchial mucosa was smooth with no ulcers and bleeding, and the nozzle was unobstructed (Figure 5A). After injecting the drug into the RLLs through an electronic bronchoscope, a large number of bright red, granular microspheres were observed on the surface of the bronchial mucosa under an electron microscope (Figure 5B). A large number of red microspheres were seen on the mucosal surface on days 3 and 10. However, at day 20, only a small number of light red microspheres were present. Besides, after drug administration, the bronchial mucosa was smooth, with no injury and no significant difference from the bronchial mucosa before drug administration (Figure 5C, D, and E). The experimental results showed that the microspheres do not cause injury that leads to ulceration and bleeding of the bronchial mucosa. Since rifapentine was released slowly, the color of the microspheres gradually faded from bright red to light red. A proportion of nonadherent microspheres were eliminated from the body via normal breathing of the dogs or dispersed to other parts of the bronchial mucosa, thereby decreasing the number of microspheres on the bronchial surface. Ultimately, the controlled-release microspheres were retained in the bronchial mucosa of lungs for up to 20 days.
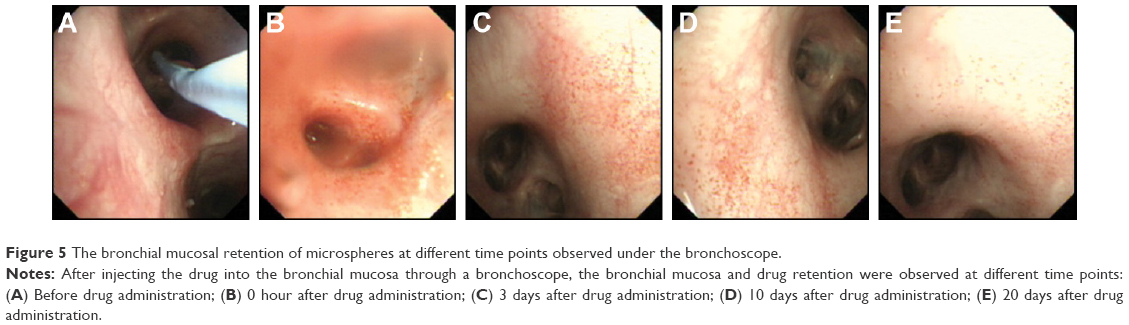 | Figure 5 The bronchial mucosal retention of microspheres at different time points observed under the bronchoscope. |
The in vitro release and bronchial mucosal retention characteristics of the drug-loaded microspheres exhibit an important significance in the treatment of patients with cavity pulmonary TB. After injecting the controlled-release microspheres into the tuberculous cavity through a bronchoscope, the microspheres rapidly released a portion of the anti-TB drugs within a short period. This elevated the local drug concentration, thereby enhancing the local anti-TB potency. Then, the microspheres slowly released the drugs for a longer period, which continually maintained the local concentration of anti-TB drugs in the lung tissues. Thus, microspheres exhibit bactericidal effects over a longer period, which reduces the dose and frequency of oral and intravenous administration, thereby improving patient compliance. Finally, the microspheres can be eliminated from the body through breathing or they can be degraded in the body. Hence, they are harmless to the human body and suitable for use in clinical trials.
Conclusion
In this study, we successfully fabricated controlled-release microspheres that can simultaneously encapsulate rifapentine and linezolid (RLPMs), with an even particle size distribution, by employing the O/W emulsion solvent evaporation method. The microspheres prepared using the optimal fabrication technique exhibited a uniform morphology, spherical shape, and circular concaves on the surface. This study lays the foundation for the use of RLPMs in bronchoscopic interventional therapy of cavitary pulmonary TB. Further research should be carried out to evaluate the release of the drugs in vivo and the safety of administration of controlled-release microspheres to the lungs of animals.
Acknowledgment
This research was supported by the Foundation of 12th Five-year National Science and Technology Major Project (2012ZX10003009-001-001).
Disclosure
The authors report no conflicts of interest in this work.
References
World Health Organization. Global Tuberculosis Report 2015. Geneva, Switzerland: World Health Organization; 2015. | ||
Bothamley G, Lipman M, Kon OM. Cavitating pulmonary tuberculosis: a global challenge. Clin Med. 2012;12(3):299. | ||
Reichman LB, Hershfield ES. Tuberculosis – A Comprehensive International Approach. Yale J Biol Med. 1992;66(4):192. | ||
Yoder MA, Lamichhane G, Bishai WR. Cavitary pulmonary tuberculosis: the holy grail of disease transmission. Curr Sci. 2004;86(1):74–81. | ||
Benator D, Bhattacharya M, Bozeman L, et al. Rifapentine and isoniazid once a week versus rifampicin and isoniazid twice a week for treatment of drug-susceptible pulmonary tuberculosis in HIV-negative patients: a randomised clinical trial. Lancet. 2002;360(9332):528–534. | ||
Aristoff PA, Garcia GA, Kirchhoff PD, Showalter HD. Rifamycins – obstacles and opportunities. Tuberculosis. 2010;90(2):94–118. | ||
Der Lippe BV, Sandven P, Brubakk O. Efficacy and safety of linezolid in multidrug resistant tuberculosis (MDR-TB) – a report of ten cases. J Infect. 2006;52(2):92–96. | ||
Yi L, Yoshiyama T, Okumura M, et al. Linezolid as a potentially effective drug for the treatment of multidrug-resistant tuberculosis in Japan. Jpn J Infect Dis. Epub 2016 Mar 18. | ||
Lee M, Lee J, Carroll MW, et al. Linezolid for treatment of chronic extensively drug-resistant tuberculosis. N Engl J Med. 2012;367(16):1508–1518. | ||
Astete CE, Sabliov CM. Synthesis and characterization of PLGA nanoparticles. J Biomater Sci Polym Ed. 2006;17(3):247–289. | ||
Yuan Z, Gu X. Preparation, characterization, and in vivo study of rhein-loaded poly(lactic-co-glycolic acid) nanoparticles for oral delivery. Drug Des Devel Ther. 2015;9:2301–2309. | ||
Shive MS, Anderson JM. Biodegradation and biocompatibility of PLA and PLGA microspheres. Adv Drug Deliv Rev. 1997;28(1):5–24. | ||
Hu C, Feng H, Zhu C. Preparation and characterization of rifampicin-PLGA microspheres/sodium alginate in situ gel combination delivery system. Colloids Surf B: Biointerfaces. 2012;(95):162–169. | ||
Wu J, Zuo Y, Hu YJ, et al. Development and in vitro characterization of drug delivery system of rifapentine for osteoarticular tuberculosis. Drug Des Devel Ther. 2015;9:1359–1366. | ||
Weber A, Opheim KE, Smith AL, Wong K. High-pressure liquid chromatographic quantitation of rifampin and its two major metabolites in urine and serum. Rev Infect Dis. 1983;5(Suppl 3):S433–S439. | ||
Liggins RT, Burt HM. Paclitaxel loaded poly(L-lactic acid)(PLLA) microspheres. II. The effect of processing parameters on microsphere morphology and drug release kinetics. Int J Pharm. 2004;281(1-2);103-106. | ||
Malaekeh-Nikouei B, Sajadi Tabassi SA, Jaafari MR. The effect of different grades of PLGA on characteristics of microspheres encapsulated with cyclosporine A. Curr Drug Deliv. 2006;3(4):343-349. | ||
Yang C, Plackett D, Needham D, Burt HM. PLGA and PHBV microsphere formulations and solid-state characterization: possible implications for local delivery of fusidic acid for the treatment and prevention of orthopaedic infections. Pharm Res. 2009;26(7):1644-1656. | ||
Gilchrist SE, Rickard DL, Letchford K, Needham D, Burt HM. Phase separation behavior of fusidic acid and rifampicin in PLGA microspheres. Mol Pharm. 2012;9(5):1489–1501. | ||
Yeo Y, Park K. Control of encapsulation efficiency and initial burst in polymeric microparticle systems. Arch Pharm Res. 2004;27(1):1–12. | ||
Mehta RC, Thanoo BC, DeLuca PP. Peptide containing microspheres from low molecular weight and hydrophilic poly (d,l-lactide-co-glycolide). J Control Release. 1996;41(3):249–257. | ||
Boury F, Marchais H, Proust JE, Benoit JP. Bovine serum albumin release from poly(α-hydroxy acid) microspheres: effects of polymer molecular weight and surface properties. J Control Release. 1997;45(1):75–86. | ||
Allison SD. Analysis of initial burst in PLGA microparticles. Expert Opin Drug Deliv. 2008;5(6):615–628. | ||
Janoria KG, Mitra AK. Effect of lactide/glycolide ratio on the in vitro release of ganciclovir and its lipophilic prodrug (GCV-monobutyrate) from PLGA microspheres. Int J Pharm. 2007;338(1–2):133–141. |
 © 2017 The Author(s). This work is published and licensed by Dove Medical Press Limited. The
full terms of this license are available at https://www.dovepress.com/terms
and incorporate the Creative Commons Attribution
- Non Commercial (unported, 3.0) License.
By accessing the work you hereby accept the Terms. Non-commercial uses of the work are permitted
without any further permission from Dove Medical Press Limited, provided the work is properly
attributed. For permission for commercial use of this work, please see paragraphs 4.2 and 5 of our Terms.
© 2017 The Author(s). This work is published and licensed by Dove Medical Press Limited. The
full terms of this license are available at https://www.dovepress.com/terms
and incorporate the Creative Commons Attribution
- Non Commercial (unported, 3.0) License.
By accessing the work you hereby accept the Terms. Non-commercial uses of the work are permitted
without any further permission from Dove Medical Press Limited, provided the work is properly
attributed. For permission for commercial use of this work, please see paragraphs 4.2 and 5 of our Terms.