Back to Journals » Clinical Ophthalmology » Volume 16
Retrograde Optic Nerve Degeneration in Pituitary Adenoma: A Study with RE-PERG
Authors Mavilio A ![]() , Sisto D, Dammacco R
, Sisto D, Dammacco R ![]() , Durante G, Alessio G
, Durante G, Alessio G
Received 30 August 2022
Accepted for publication 29 November 2022
Published 13 December 2022 Volume 2022:16 Pages 4135—4144
DOI https://doi.org/10.2147/OPTH.S384525
Checked for plagiarism Yes
Review by Single anonymous peer review
Peer reviewer comments 2
Editor who approved publication: Dr Scott Fraser
Alberto Mavilio,1 Dario Sisto,2 Rosanna Dammacco,2 Giuseppe Durante,1 Giovanni Alessio2
1Social Health District, Glaucoma Center, Azienda Sanitaria Locale, Brindisi, Italy; 2Department of Neurosciences, Institute of Ophthalmology, University of Bari, Bari, Italy
Correspondence: Alberto Mavilio, Social Health District, Glaucoma Center, Azienda Sanitaria Locale, Via Napoli, 8, Brindisi, BR, 72100, Italy, Email [email protected]
Purpose: RE-PERG is altered in presence of primary neuronal degeneration of retinal ganglion cells, both in glaucoma and other diseases. A previous study showed that in a model of retrograde degeneration (vascular dementia) RE-PERG was normal. In this study, we enrolled patients with pituitary adenoma (PA) to evaluate RE-PERG findings in another model of retrograde degeneration compared with healthy controls (HC). Based on the outcome of the present and our previous studies with RE-PERG, and reviewing the literature, we discuss the physiopathology of glaucoma.
Methods: Twelve PA patients and 14 age-matched HC were recruited. All participants performed visual field (VF) test, retinal nerve fiber layer (RNFL) and ganglion cells complex (GCC) thickness measurement by means of optical coherence tomography (OCT), visual evoked potentials (VEPs) and RE-PERG, a non-invasive, fast steady-state pattern electroretinogram (SS-PERG) sampled in five consecutive blocks of 130 events.
Results: VEPs amplitude was significantly lower in PA with respect to HC (6.8± 0.6 vs 7.4± 0.6 μV; p=0.045). VEPs latency was higher in PA (123.2± 5.8 vs 103.6± 4.1 msec; p< 0.01). As for VF, mean defect (MD) and pattern standard deviation (PSD) were higher in PA (− 6.6± 2.6 vs − 0.01± 1.02 dB; p< 0.01 and 8.5± 3.1 vs 1.5± 0.3; p< 0.01, respectively). RNFL thickness was lower in PA (88± 8.1 vs 97± 9.3 μ; p=0.01). There was no statistically significant difference between PA and HC for RE-PERG. There was a significant correlation among MD, PSD, VEPs amplitude, PERG amplitude and RNFL thickness in the PA group, whereas no correlation was found with SDPh, which remains as normal as in the HC group.
Conclusion: Our findings confirm that RE-PERG is not altered in retrograde degeneration. Based on the outcome of the present and our previous studies about RE-PERG and glaucoma, we assume that in glaucoma a double mechanism of retinal ganglion cells degeneration, both retrograde and primary, can coexist.
Keywords: pattern electroretinogram, steady-state PERG, RE-PERG, visual pathway, visual field, pituitary adenoma, optical coherence tomography, visual evoked potentials
Introduction
Retrograde degeneration of the optic nerve has been studied since the classical work by Maffei and Fiorentini.1 They showed, soon after the experimental section of the optic nerve in cats, extinction of VEPs, then progressive reduction of PERG response, which completely disappeared within 4 months, with preservation of outer retinal response, as evaluated by flash ERG.
Their findings have been subsequently confirmed by other authors2–6 also by means of hemifield PERG,7,8 multifocal ERG and multifocal VEPs.9,10
PERG amplitude reduction, reversible after surgery, was also detected in microadenomas.2 It is well known that in cases of compression of the visual pathway, such as in pituitary adenomas, there is an early increase in VEP latency, followed by a reduction in the VEPs amplitude. It is also known that hemifield stimulation with a large check stimulus is more sensitive than full-field VEP in detecting chiasmal dysfunction.11–14
As for PERG, it is initially normal and subsequently altered as neuronal degeneration occurs. PERG has been shown to be a practical prognostic test for visual outcomes in preoperative assessment compression of the optic nerve in pituitary tumors. Abnormal PERG correlates with a lack of postoperative recovery, presumably demonstrating significant retrograde degeneration of retinal ganglion cells.6,13,14
Both the reductions in the VEPs and PERG amplitude are due to the progressive loss of retinal ganglion cells (RGCs), the latter following the first.3
Glaucoma is also commonly considered a form of optic neuropathy due to retrograde degeneration. Mechanical theory states that the raised IOP determines, at the level of the lamina cribrosa, mechanical stress and strain of the optic nerve, which can lead to interruption of the supply of neurotrophic factors to the RGCs and subsequently to RGCs loss.15,16
For this reason, PERG progressive alterations similar to those found in the experimental section of the optic nerve have been reported in animal models of glaucoma.17 Nevertheless, other evidence suggests that, both in experimental models and in human patients with glaucoma, a primary neuronal degeneration of RGCs can be observed.18–20
In addition, primary glaucomatous neurodegeneration of RGCs, mediated by microRNAs detectable in aqueous humour and not directly due to raised IOP, has also been proposed.21
We developed a new electrophysiological test, called RE-PERG, based on a modified SS-PERG sampled in five consecutive blocks of 130 events each. In this test, we evaluate amplitude, which is related to the number of living neurons, and standard deviation of the phase (SDPh), which is associated with the metabolic state of living neurons. It has been reported that phase variations are related to very early RGCs’ dendritic dysfunction that may precede cell death.22,23 Such early RGCs dendrites degeneration has also been shown using scanning electron microscopy in the inner retina assessed to have a none-to-moderate loss of RGCs number in human glaucoma patients.24
In our first work, we showed, in early glaucoma, a SDPh increase in the presence of a normal PERG amplitude, thus accounting for precocious RGCs suffering without significant cell loss.25 In two other works, we showed that, when evaluating glaucoma subjects with confounding factors such as cataracts and myopia, SDPh is a parameter more reliable than PERG amplitude.26,27
In subsequent work, we tested our RE-PERG in Alzheimer’s disease (AD) and in vascular dementia (VD), based on studies reporting primary RGCs degeneration in AD. In contrast, it is known that visual pathway alterations in VD are due to retrograde degeneration starting from the site of cerebral ischemia. We report altered SdPh in AD patients, with respect to VD patients and HC, confirming that SDPh could be considered a specific biomarker for primary neuronal degeneration of RGCs.28 Considering PA as a model of retrograde degeneration similar to glaucoma, the aim of this work is to verify if RE-PERG findings are altered in case of retrograde degeneration and, therefore, if our test is altered only in the presence of primary neurodegeneration of RGCs.
Materials and Methods
From January 2021 to May 2022, we enrolled 12 consecutive PA patients without ophthalmoscopic signs of optic atrophy and 14 age-matched HC. All PA patients were newly diagnosed by one of the authors (A.M.) after complaining of visual disturbances (mainly visual impairment and subjective visual field loss) and then enrolled in the study. All patients were recruited at the Brindisi Social Health District, Brindisi, Italy. General exclusion criteria were as follows: general diseases and therapies able to influence the findings of VF, OCT, VEPs and PERG.
Ophthalmic exclusion criteria were as follows: diabetes even in the absence of retinopathy, ocular hypertension and glaucoma as diagnosed by EGS guidelines,30 congenital optic nerve head anomalies, retinopathy or any other ocular condition able to determine the influence on VF, OCT, VEPs and PERG, best corrected visual acuity (BCVA) <20/40 (Snellen acuity), spherical refraction >±5.0 D, cylinder correction >±2.0 D, optic media opacities. The control group consisted of age- and gender-matched healthy subjects. Although PA determined bilateral ocular involvement, only one eye of each patient was included in the study.
Ophthalmic Evaluation
All the patients underwent a comprehensive ophthalmic evaluation, with a review of medical history, slit-lamp examination, best-corrected visual acuity measurement (Snellen acuity), Goldmann applanation tonometry, gonioscopy, and dilated fundus examination.
Instrumental evaluation
Spectral-Domain OCT was performed by means of Zeiss Cirrus HD-OCT 500 (software version 7,0,1,290, Carl Zeiss Meditec, Dublin, CA).
SAP was performed by means of Humphrey Field Analyzer, model 745i II (Carl Zeiss Meditec, Dublin, CA), using the 24–2 program, SITA-Standard Strategy.
VEPs and PERG were recorded employing RETIMAX Advanced version 7.0.1 (CSO, Florence, Italy).
SD-OCT, SAP and RE-PERG procedures were used in previously published studies.25–28
As for VEPs, the examination was conducted using a high-resolution ionized-gas electrically charged plasma display (contrast: 90% luminance: 80 cd/m2; field size: 30° [width] × 30° [height]). According to ISCEV standards, VEP was conducted monocularly using a black-white checkerboard with a 2 cm of diagonal square pattern at a distance of 114 cm and a frequency of 2 Hz.29 Registration was conducted using a 1–30 Hz band pass system, with an analysis duration of 300 ms. To verify good reliability, the recording was repeated twice with 100 stimuli per response. The 10–20 international system was applied for the electrode montage with an impedance of less than 5 Ω for each electrode. The VEP parameters recorded were latencies to N75, P100 and N145 waves and the peak-to-peak amplitude of the P100 wave. Hemifield VEP abnormality was detected by O1-O2 montage to double channels.
We performed a one-way ANOVA analysis to compare all the parameters between PA group with respect to HC one. The relationships between the electrophysiological values and other parameter values were calculated using Pearson’s correlation tests. A chi-squared test was used to compare the groups with respect to the categorical variables (sex). Statistical analyses were performed using MedCalc® 20.111. Circular statistics were performed by means of Oriana® Ver. 4.02. A p-value of ≤0.05 was considered statistically significant.
This trial follows the tenets of the Declaration of Helsinki for human studies. The study was approved by Ethics Committee of the Brindisi Social Health District. Informed written consent was obtained by all the patients.
Results
Specific data about PA and HC subjects are provided in Table 1. Table 2 summarizes the mean and standard deviation values of the parameters studied. All patients showed normal, open angles at the gonioscopy. No fundus alterations (including optic nerve anomalies) were found during the ophthalmoscopic examination.
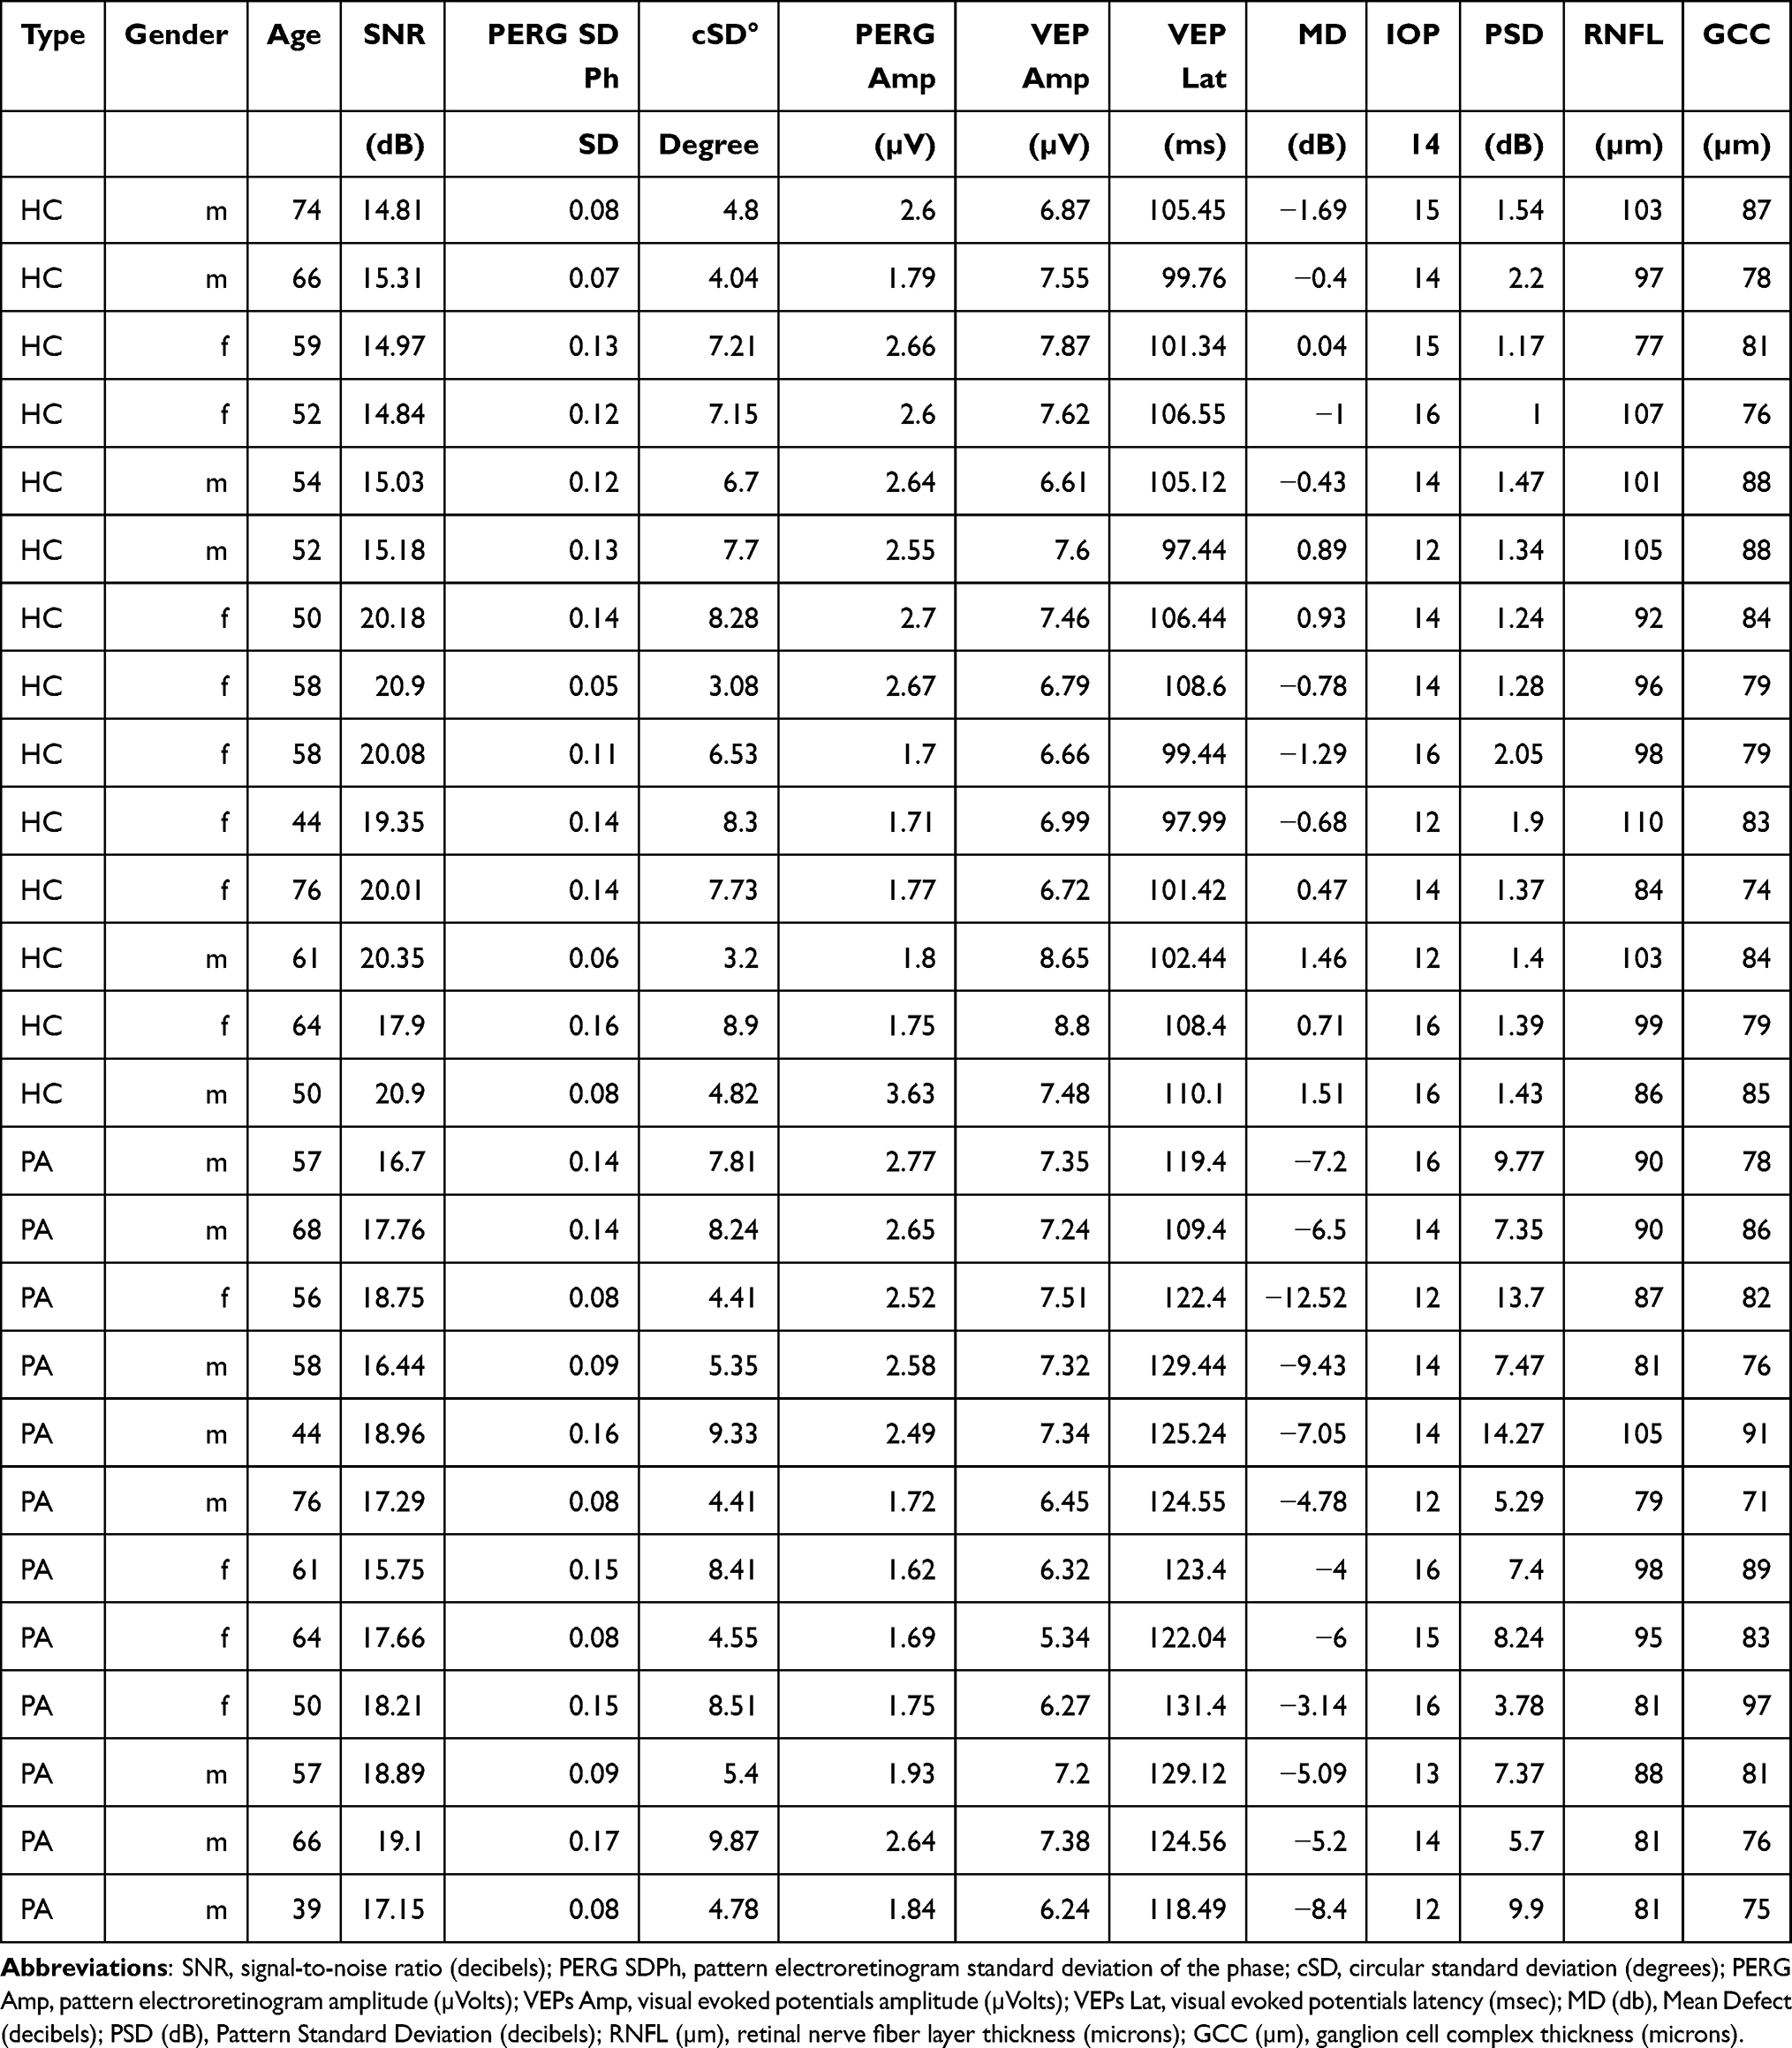 |
Table 1 Demographic and Specific Data of Healthy Control (HC) and Pituitary Adenoma (PA) Patients |
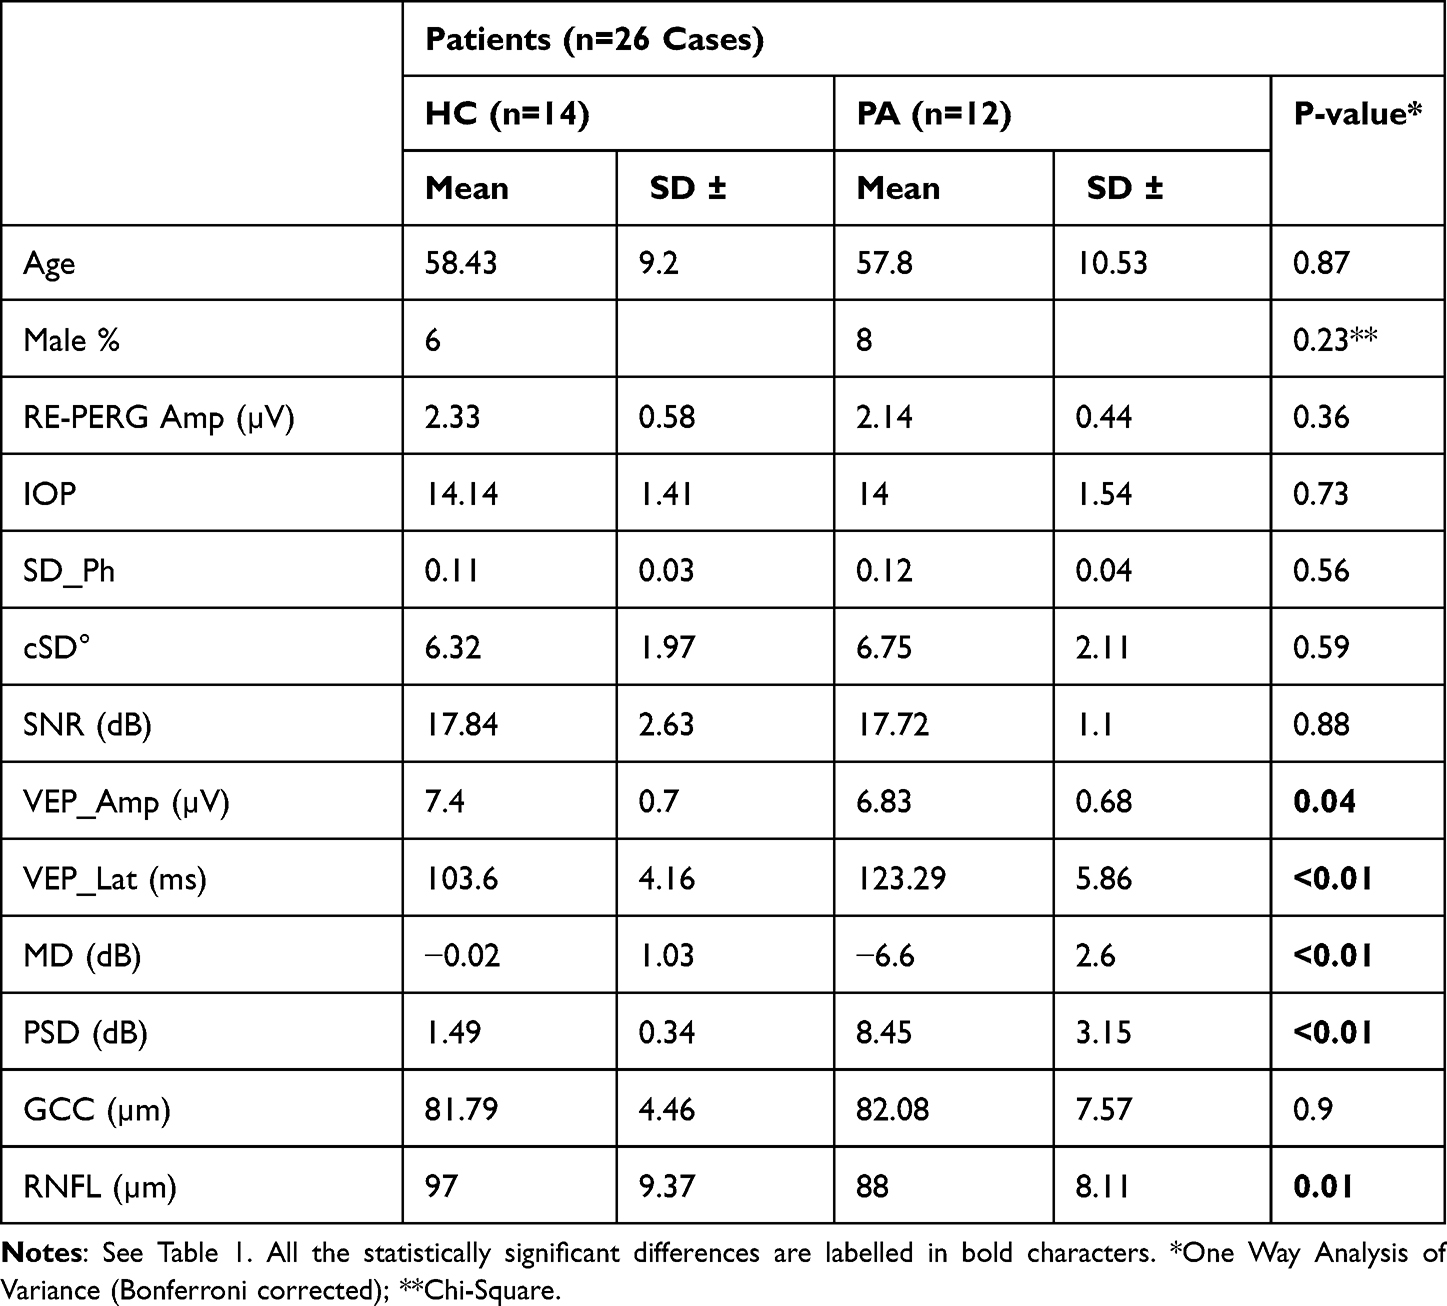 |
Table 2 Demographic and Relevant Ocular Characteristic of Study Participants |
The mean age was 58.4±9.1 years in HC (six male, eight female) and 57.8±10.5 in PA (eight male, six female) without statistical difference between groups.
There was no statistically significant difference between PA and HC for GCC thickness and RE-PERG parameters. VEPs amplitude was significantly lower in PA with respect to HC (6.8±0.6 vs 7.4±0.6 µV; p=0.045). VEPs latency was higher in PA (123.2±5.8 vs 103.6±4.1 msec; p<0.01). As for VF, mean defect (MD) and pattern standard deviation (PSD) were higher in PA (−6.6±2.6 vs −0.01±1.02 dB; p<0.01 and 8.5±3.1 vs 1.4±0.3; p<0.01, respectively). RNFL thickness was lower in PA (88±8.1 vs 97±9.3 µ; p=0.01).
Correlation studies show, as expected, a significant correlation among MD, PSD, VEPs amplitude, PERG amplitude and RNFL thickness in the PA group, whereas no correlation was found with SDPh, which remains as normal as in the HC group (Table 3; see also Figures 1–3).
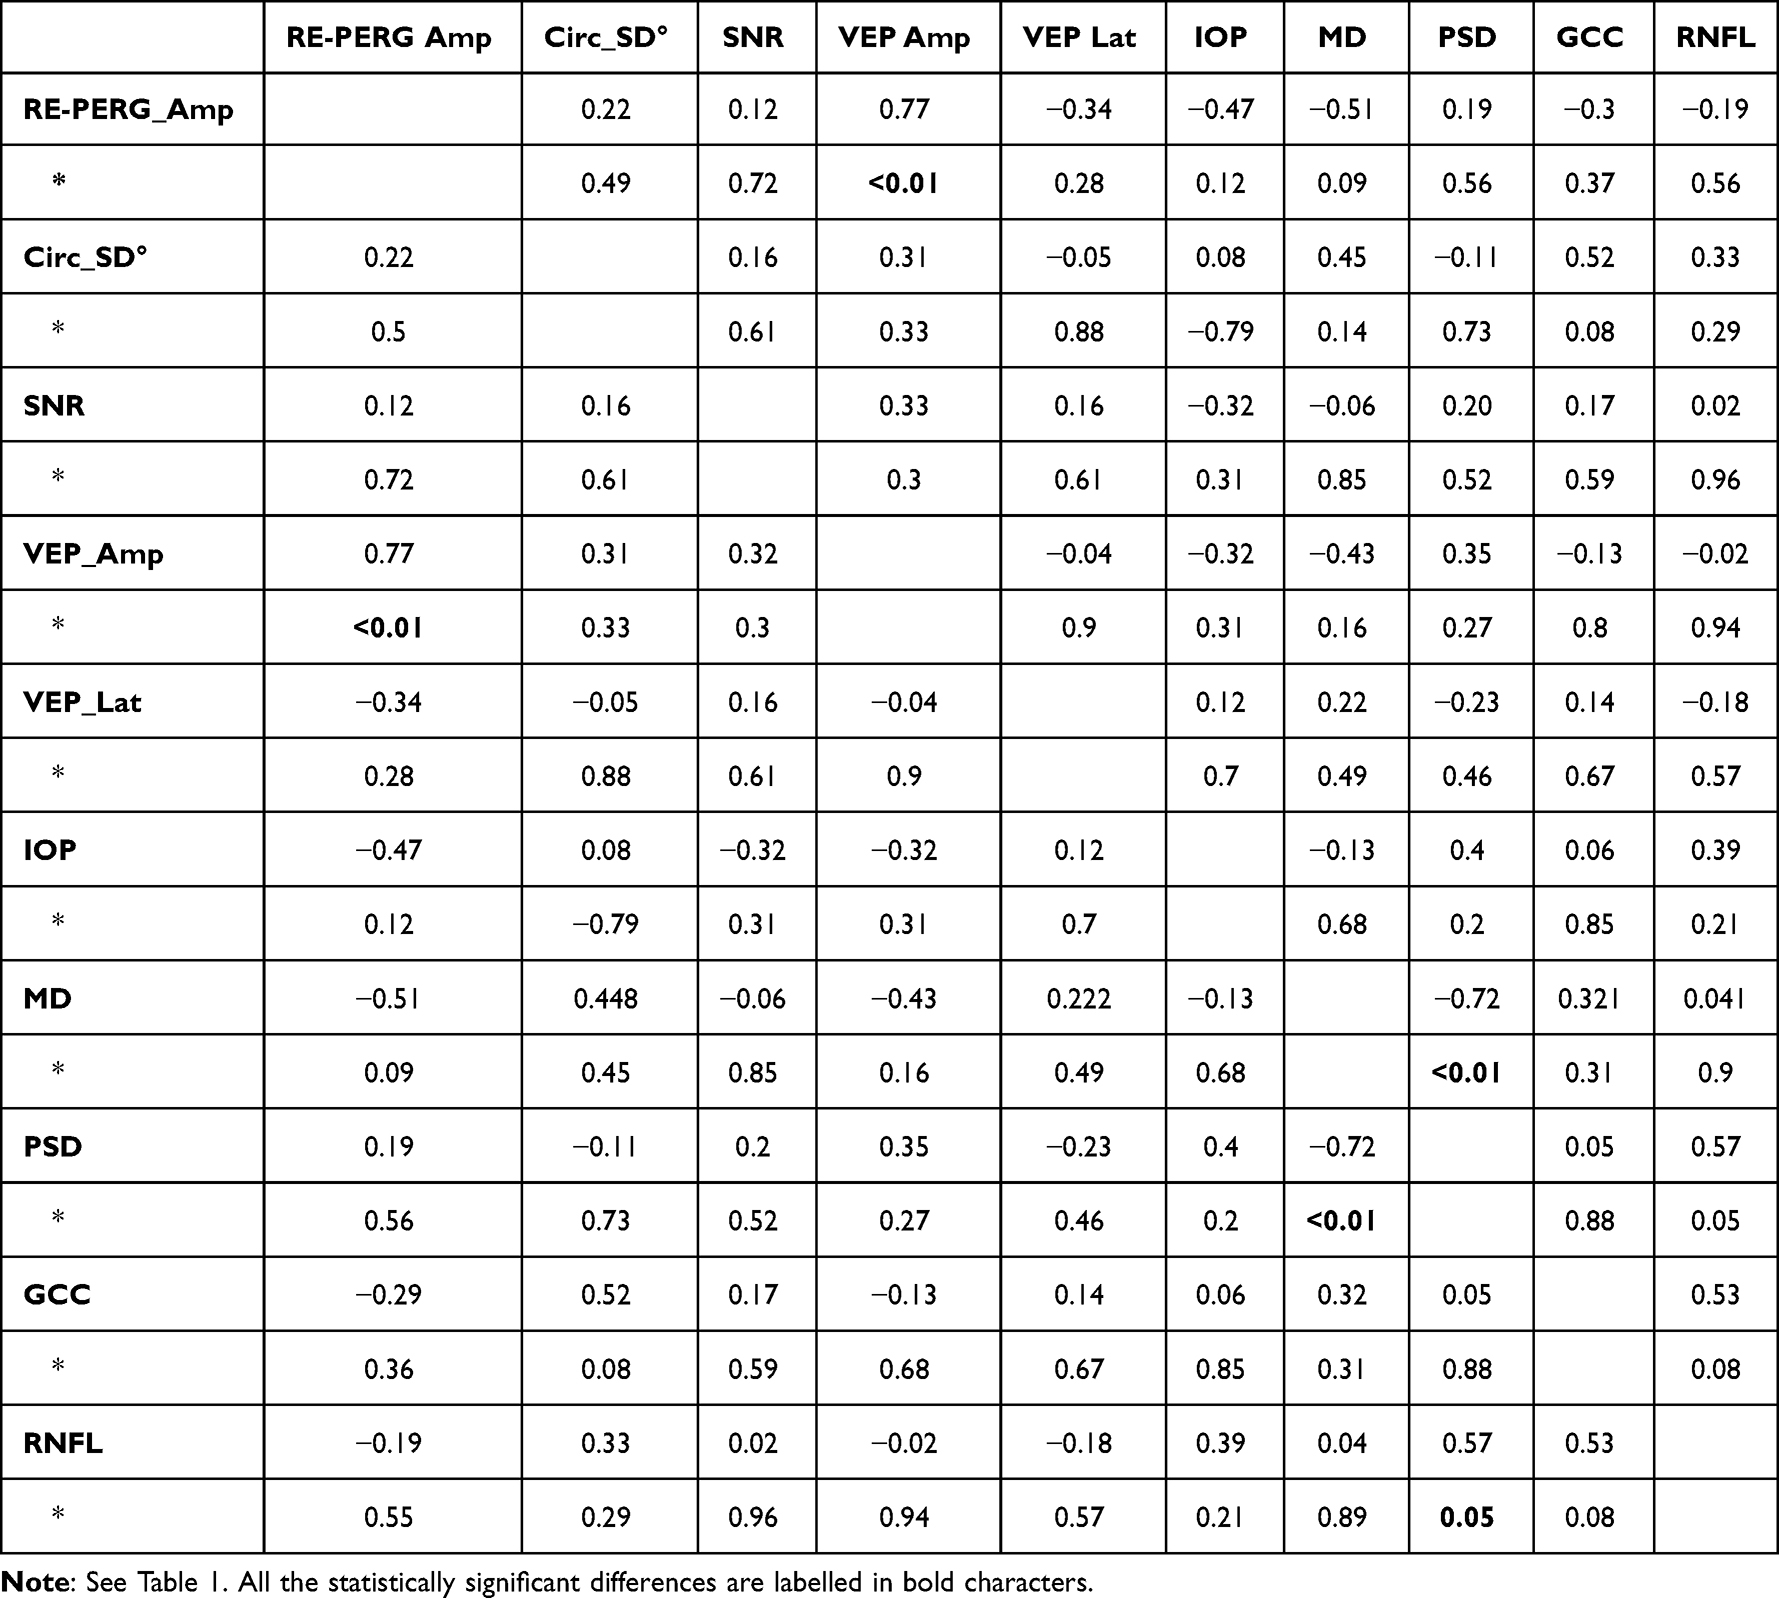 |
Table 3 Significance Level P (*) of Correlation Coefficient in PA Patients |
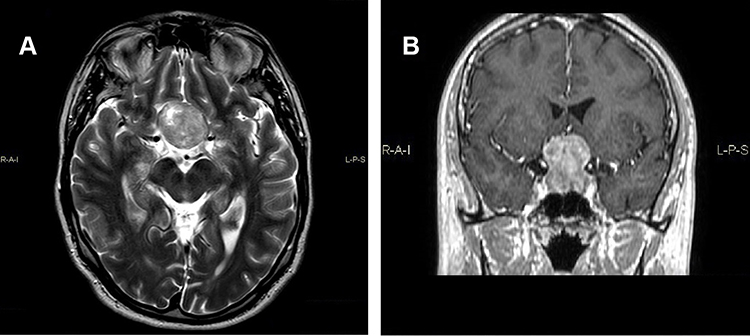 |
Figure 1 MRI of Orbits for Suspected Chiasmatic Syndrome (PA patient no. 5). (A) Coronal T2-weighted MRI image showing a pituitary mass extending to the left compressing the optic chiasm, primarily on the left side. (B) Post-contrast T1-weighted coronal MRI image showing the tumor with gadolinium. |
 |
Figure 2 Perimetry and OCT of the same patient (right eye on the right, left eye on the left). The inferior thinning of both RNFL and GCC are consistent with the superior visual field loss (see deviation map). |
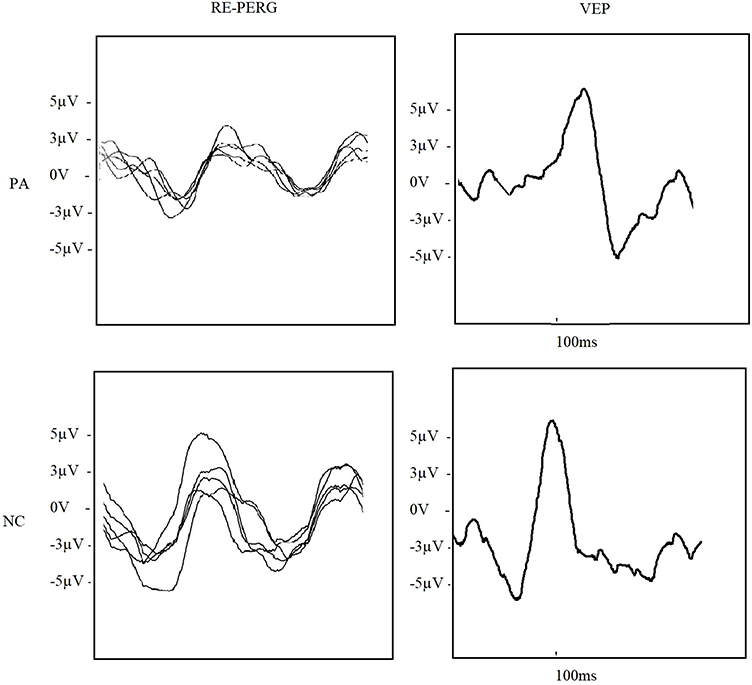 |
Figure 3 Five consecutive steady-state PERG (RE-PERG) of the PA patient, showing reduced amplitude with low intrasession variability of inner retinal response, and visual evoked potential (VEPs) lower amplitude and higher latency of cortical response (above), in comparison to a NC (below). |
Table 1. Demographic and specific data of healthy control (HC) and pituitary adenoma (PA) patients. SNR: signal-to-noise ratio (decibels); PERG SDPh: pattern electroretinogram standard deviation of the phase; cSD°: circular standard deviation (degrees); PERG Amp: pattern electroretinogram amplitude (µVolts); VEPs Amp: visual evoked potentials amplitude (µVolts); VEPs Lat: visual evoked potentials latency (msec); MD (db): Mean Defect (decibels); PSD (dB): Pattern Standard Deviation (decibels); RNFL (µm): retinal nerve fiber layer thickness (microns); GCC (µm): ganglion cell complex thickness (microns).
Table 2. Demographic and relevant ocular characteristics of study participants. For abbreviations, see Table 1. All the statistically significant differences are labelled in bold characters. * – One Way Analysis of Variance (Bonferroni corrected); ** - Chi-Square.
Table 3. Significance level P (*) of correlation coefficient in PA patients. For abbreviations, see Table 1. All the statistically significant differences are labelled in bold characters.
Discussion
Since its introduction, we considered RE-PERG alterations in glaucoma as a sign of primary neurodegeneration of RGCs, and not as a consequence of retrograde degeneration of the optic nerve. Thus, considering the retrograde degeneration of the optic nerve in PA similar to that which occurs in glaucoma, we wanted to verify our hypothesis.
Our results confirm that, in patients with PA, consistent with MD, PSD and RNFL thickness values, VEPs amplitude was reduced, and VEPs latency was higher, as previously reported,12 whereas the PERG SD-Ph showed no difference between groups. Therefore, this study suggests that RE-PERG is not altered in the presence of retrograde degeneration.
Pending further studies with a larger cohort of patients to confirm our data, some considerations can be made.
Glaucoma is considered a form of retrograde degeneration of the optic nerve. In classical mechanical theory, the site where the raised IOP exerts its pathological function is the lamina cribrosa (LC), in which we can observe a mechanical strain and, as a consequence of this, increasing cupping or depth, and development of focal defects. It has been shown that strain is eye-specific and mediated by intraocular pressure, cerebrospinal fluid pressure, scleral and lamina cribrosa morphology, and structural stiffness. The most recent OCT tools, able to perform LC imaging, have confirmed all these findings.16
LC strain leads to stress and strain of the optic nerve and, finally, to reduction or interruption of the supply of neurotrophic factors to the RGCs, resulting in apoptosis of the latter.15
It is also known that, in glaucoma, in addition to rising IOPs, the pathogenesis of RGCs loss includes glutamate excitotoxicity, oxidative stress, failure in axonal transport, neurotrophic factors deprivation, mitochondrial dysfunction, autoimmune dysregulation, central insulin signalling deficit and others, such as recently resumed by Faiq et al.20 Other studies reported findings compatible with primary neurodegeneration, not mediated by axon mechanical stress, of RGCs, based on different mechanisms.
Guo et al found that, in an animal model of glaucoma, RGCs early expressed abnormal levels of amyloid-ɞ (Aɞ) starting 2 weeks after IOP rise and that it was possible to reduce RGCs apoptosis by targeting Aɞ formation and aggregation pathway, as detected by Detection of Apoptosing Retina Cells (DARC) real-time images, without any intervention on IOP. Their findings account for a mechanism of RGCs degeneration not mediated by mechanical stress.18
Gupta et al found, in human glaucoma with uncontrolled IOP, deposition of abnormal tau protein AT8 in the inner nuclear layer, such as in other central nervous system diseases, and considered this as a possible primitive neurodegenerative mechanism.19
Izzotti et al showed that starting from the trabecular meshwork cells damaged by oxidative stress, there is a release of extracellular microRNAs inducing glial cell activation, which is a known pathogenic mechanism in neurodegenerative diseases. Released microRNAs include miR-21 (apoptosis), miR-450 (cell aging, maintenance of contractile tone), miR-107 (Nestin expression, apoptosis), miR-149 (endothelial and extracellular matrix homeostases). The uveoscleral pathway, via suprachoroidal space, should be a potential route of access from the anterior region to the posterior segment of the eye and could represent the path followed to reach the inner layer of the peripapillary retina and transmit damage signals from the anterior to the posterior segment of the eye in glaucoma.21
Conclusions
It is still unclear if all these pathogenetic mechanisms are a direct consequence of IOP rise but not related to the stress of lamina cribrosa or are a product of the same metabolic alterations that lead to IOP rise or, finally, are totally independent of IOP (such as in normotensive glaucoma).31 Whatever the cause, based on the current literature and on the outcome of the present study, in our opinion, in glaucoma, there are two coexisting mechanisms of RGCs damage: a retrograde degeneration starting from the lamina cribrosa, and primary neurodegeneration of the RGCs’ cellular soma, the latter being identified by RE-PERG as an increase of SDph.
Funding
No financial support was received for this submission.
Disclosure
Dr Alberto Mavilio reports a patent IT-201800003274-A1 issued to Ufficio Italiano Brevetti e Marchi. The authors report no other conflicts of interest in this work.
References
1. Maffei L, Fiorentini A. Electroretinographic responses to alternating gratings before and after section of the optic nerve. Science. 1981;211:953–955. doi:10.1126/science.7466369
2. Ventura LM, Venzara FX, Porciatti V. Reversible dysfunction of retinal ganglion cells in non-secreting pituitary tumors. Doc Ophthalmol. 2009;118:155–162. doi:10.1007/s10633-008-9143-8
3. Brecelj J. Visual electrophysiology in the clinical evaluation of optic neuritis, chiasmal tumours, achiasmia, and ocular albinism: an overview. Doc Ophthalmol. 2014;129:71–84. doi:10.1007/s10633-014-9448-8
4. Chou TH, Park KK, Luo X, et al. Retrograde signaling in the optic nerve is necessary for electrical responsiveness of retinal ganglion cells. Invest Ophthalmol Vis Sci. 2013;54:1236–1243. doi:10.1167/iovs.12-11188
5. Lachowicz E, Lubinski W. The clinical value of the multi-channel PVEP and PERG in the diagnosis and management of the patient with pituitary adenoma: a case report. Doc Ophthalmol. 2018;137:37–45. doi:10.1007/s10633-018-9647-9
6. Parmar DN, Sofat A, Bowman R, et al. Visual prognostic value of the pattern electroretinogram in chiasmal compression. Br J Ophthalmol. 2000;84:1024–1026. doi:10.1136/bjo.84.9.1024
7. Monteiro MLR, Cunha LP, Costa-Cunha LVF, et al. Relationship between optical coherence tomography, pattern electroretinogram and automated perimetry in eyes with temporal hemianopia from chiasmal compression. Invest Ophthalmol Vis Sci. 2009;50:3535–3541. doi:10.1167/iovs.08-3093
8. Cunha LP, Oyamada MK, Monteiro MLR. Pattern electroretinograms for the detection of neural loss in patients with permanent temporal visual field defect from chiasmal compression. Doc Ophthalmol. 2008;117:223–232. doi:10.1007/s10633-008-9126-9
9. RBd A, Oyamada MK, Zacharias LC, et al. Morphological and functional inner and outer retinal layer abnormalities in eyes with permanent temporal hemianopia from chiasmal compression. Front Neurol. 2017;8:619. doi:10.3389/fneur.2017.00619
10. Jayaraman M, Ambika S, Gandhi RA, et al. Multifocal visual evoked potential recordings in compressive optic neuropathy secondary to pituitary adenoma. Doc Ophthalmol. 2010;121:197–204. doi:10.1007/s10633-010-9246-x
11. Flanagan JG, Harding GF. Multi-channel visual evoked potentials in early compressive lesions of the chiasm. Doc Ophthalmol. 1988;69(3):271–281. doi:10.1007/BF00154408
12. Brecelj J. A VEP study of the visual pathway function in compressive lesions of the optic chiasm. Full-field versus half-field stimulation. Electroencephalogr Clin Neurophysiol. 1992;84(3):209–218. doi:10.1016/0168-5597(92)90002-S
13. Kaufman DI, Wray SH, Lorance R, Woods M. An analysis of the pathophysiology and the development of treatment strategies for compressive optic-nerve lesions using pattern electroretinogram and visual evoked-potential. InNeurology. 1986;36(4):232.
14. Rüther K, Ehlich P, Philipp A, Eckstein A, Zrenner E. Prognostic value of the pattern electroretinogram in cases of tumors affecting the optic pathway. Graefe’s Arch Clin Exp. 1998;236(4):259–263. doi:10.1007/s004170050074
15. Burgoyne CF, Downs JC, Bellezza AJ, et al. The optic nerve head as a biomechanical structure: a new paradigm for understanding the role of IOP-related stress and strain in the pathophysiology of glaucomatous optic nerve damage. Prog Ret Eye Res. 2005;24:39–73. doi:10.1016/j.preteyeres.2004.06.001
16. Crawford Downs J, Girkin CA. Lamina cribrosa in glaucoma. Curr Opin Ophthalmol. 2017;28(2):113–119. doi:10.1097/ICU.0000000000000354
17. Saleb M, Nagaraju M, Porciatti V. Longitudinal evaluation of retinal ganglion cell function and IOP in the DBA/2J mouse model of glaucoma. Invest Ophthalmol Vis Sci. 2007;48:4564–4572. doi:10.1167/iovs.07-0483
18. Guo L, Salt TE, Luong V, et al. Targeting amyloid-ɞ in glaucoma treatment. Proc Natl Acad Sci USA. 2007;104(33):13444–13449. doi:10.1073/pnas.0703707104
19. Gupta N, Fong J, Ang LC, Yucel YH. Retinal tau pathology in human glaucomas. Can J Ophthalmol. 2008;43:53–60. doi:10.3129/i07-185
20. Faiq MA, Wollstein G, Schuman JS, et al. Cholinergic nervous system and glaucoma: from basic science to clinical application. Prog Retin Eye Res. 2019;72:100767. doi:10.1016/j.preteyeres.2019.06.003
21. Izzotti A, Ceccaroli C, Longobardi MG, et al. Molecular damage in glaucoma: from anterior to posterior eye segment. MmicroRNA Role Microrna. 2015;4(1):3–17. doi:10.2174/2211536604666150707124640
22. Porciatti V, Ventura LM. Adaptive changes of inner retina function in response to sustained pattern stimulation. Vision Res. 2009;49(5):505–513. doi:10.1016/j.visres.2008.12.001
23. Veber AJ, Harman CD. Structure-function relations of parasol cells in the normal and glaucomatous primate retina. Invest Ophthalmol Vis Sci. 2005;46(9):3197–3207. doi:10.1167/iovs.04-0834
24. Tribble JR, Vasalauskaite A, Redmond T, et al. Midget retinal ganglion cell dendritic and mitochondrial degeneration is an early feature of human glaucoma. Brain Commun. 2019;1:1. doi:10.1093/braincomms/fcz035
25. Mavilio A, Scrimieri F, Errico D. Can variability of pattern ERG signal help to detect retinal ganglion cells dysfunction in glaucomatous eyes? Biomed Res Int. 2015;2015:571314. doi:10.1155/2015/571314
26. Mavilio A, Sisto D, Ferreri P, et al. RE-PERG, a new procedure for electrophysiologic diagnosis of glaucoma that may improve PERG specificity. Clin Ophtalmol. 2017;11:209–218. doi:10.2147/OPTH.S122706
27. Mavilio A, Sisto D, Ferreri P, et al. RE-PERG, a new paradigm for glaucoma diagnosis, in myopic eyes. Clin Ophtalmol. 2019;13:1315–1322. doi:10.2147/OPTH.S211337
28. Mavilio A, Sisto D, Prete F, et al. RE-PERG in early-onset Alzheimer’s disease: a double-blind, electrophysiological pilot study. PLoS One. 2020;15(8):e0236568. doi:10.1371/journal.pone.0236568
29. Odom JV, Bach M, Brigell M, et al. ISCEV standard for clinical visual evoked potentials:(2016 update). Doc Ophthalmol. 2016;133(1):1–9. doi:10.1007/s10633-016-9553-y
30. Terminology and guidelines for glaucoma. Available from: http://www.eugs.org/eng/EGS_guidelines.asps .
31. Chang EE, and Goldberg JL. Glaucoma 2.0: Neuroprotection, Neuroregeneration, Neuroenhancement. Opthalmology 2012; 119(5): 97986. doi:; 119(5): 97986. doi:10.1016/j.ophtha.2011.11.003
 © 2022 The Author(s). This work is published and licensed by Dove Medical Press Limited. The
full terms of this license are available at https://www.dovepress.com/terms
and incorporate the Creative Commons Attribution
- Non Commercial (unported, 3.0) License.
By accessing the work you hereby accept the Terms. Non-commercial uses of the work are permitted
without any further permission from Dove Medical Press Limited, provided the work is properly
attributed. For permission for commercial use of this work, please see paragraphs 4.2 and 5 of our Terms.
© 2022 The Author(s). This work is published and licensed by Dove Medical Press Limited. The
full terms of this license are available at https://www.dovepress.com/terms
and incorporate the Creative Commons Attribution
- Non Commercial (unported, 3.0) License.
By accessing the work you hereby accept the Terms. Non-commercial uses of the work are permitted
without any further permission from Dove Medical Press Limited, provided the work is properly
attributed. For permission for commercial use of this work, please see paragraphs 4.2 and 5 of our Terms.
Recommended articles
Preoperative Peripapillary Retinal Nerve Fiber Layer Thickness as the Prognostic Factor of Postoperative Visual Functions After Endoscopic Transsphenoidal Surgery for Pituitary Adenoma
Thammakumpee K, Buddawong J, Vanikieti K, Jindahra P, Padungkiatsagul T
Clinical Ophthalmology 2022, 16:4191-4198
Published Date: 15 December 2022