Back to Journals » Clinical Ophthalmology » Volume 16
Preoperative Peripapillary Retinal Nerve Fiber Layer Thickness as the Prognostic Factor of Postoperative Visual Functions After Endoscopic Transsphenoidal Surgery for Pituitary Adenoma
Authors Thammakumpee K, Buddawong J, Vanikieti K, Jindahra P ![]() , Padungkiatsagul T
, Padungkiatsagul T ![]()
Received 11 October 2022
Accepted for publication 30 November 2022
Published 15 December 2022 Volume 2022:16 Pages 4191—4198
DOI https://doi.org/10.2147/OPTH.S392987
Checked for plagiarism Yes
Review by Single anonymous peer review
Peer reviewer comments 2
Editor who approved publication: Dr Scott Fraser
Kanyarat Thammakumpee,1,2 Jiraporn Buddawong,1 Kavin Vanikieti,1 Panitha Jindahra,3 Tanyatuth Padungkiatsagul1
1Department of Ophthalmology, Faculty of Medicine Ramathibodi Hospital, Mahidol University, Bangkok, Thailand; 2Department of Ophthalmology, Faculty of Medicine, Burapha University, Chonburi, Thailand; 3Department of Medicine, Faculty of Medicine Ramathibodi Hospital, Mahidol University, Bangkok, Thailand
Correspondence: Tanyatuth Padungkiatsagul, Department of Ophthalmology, Faculty of Medicine Ramathibodi Hospital, Mahidol University, 270 Rama VI Road, Bangkok, 10400, Thailand, Tel +662 201 1526, Email [email protected]
Purpose: To evaluate the prognostic ability of preoperative peripapillary retinal nerve fiber layer thickness (pRNFLT) for predicting postoperative visual functions, including the visual field index (VFI) and visual acuity (VA), of subjects with pituitary adenoma (PA) who were treated with endoscopic transsphenoidal surgery for pituitary adenoma (ETSS-PA) exclusively.
Subjects and Methods: This 11-year retrospective study was performed at a single institution in Thailand. Sixty-six eyes of 33 subjects who had a PA compressing the anterior visual pathway and were treated with ETSS-PA alone were included. The pRNFLT was measured globally and in the four quadrants preoperatively, using optical coherence tomography. Multivariable analysis and area under the curve (AUC) were used to demonstrate the prognostic ability of preoperative pRNFLT for postoperative visual functions (> 1 month but < 6 months after ETSS-PA).
Results: The mean postoperative VFI and median postoperative VA were 79.45% ± 24.24% and 0.14 [interquartile range: 0.02, 0.40] logarithm of the minimum angle of resolution. Among the 56 eyes with a reliable postoperative VFI, thicker preoperative temporal (odds ratio, 1.18; p = 0.024) and inferior (odds ratio, 1.07; p = 0.013) pRNFLT values were associated with a postoperative VFI > 90%. The strongest association occurred with the preoperative temporal pRNFLT (AUC = 0.821, 95% CI: 0.720– 0.923) with a cut-off value of 60 μm. Multivariable analysis for all 66 eyes showed that thicker preoperative inferior-quadrant pRNFLT (odds ratio, 1.05; p = 0.001) was associated with a postoperative VA of at least 20/25. The strongest performance was found with the preoperative inferior pRNFLT (AUC = 0.732, 95% CI: 0.615– 0.849) with a cut-off value of 105 μm.
Conclusion: Preoperative pRNFLT offers clinical utility for predicting visual functions after ETSS-PA. Temporal pRNFLT ≥ 60 μm and inferior pRNFLT ≥ 105 μm predicted postoperative VFI > 90% and postoperative VA better than or equal to 20/25, respectively.
Keywords: optical coherence tomography, pituitary adenoma, peripapillary retinal nerve fiber layer, visual field, visual acuity, endoscopic transsphenoidal surgery
Introduction
Pituitary adenomas (PAs) accounts for 10% of intracranial neoplasms.1 When the PA is larger than 10 mm high, patients may present with visual disturbances due to the compression of the optic chiasm, which located just above the tumor.2,3 PA, which is the most common cause of optic chiasm compression,4 causes axonal damage through disruption of conduction, decreasing axoplasmic flow, demyelination and ischemia from direct compression or stretching of the chiasmatic vessels.5 The most common indication for surgical treatment of PA is compressive optic chiasmopathy; endoscopic transsphenoidal surgery for pituitary adenoma (ETSS-PA) is the most common surgical technique used for resection of such a tumor.6–8
The factors prognostic of visual recovery after surgical treatment of PA have been studied. Barzaghi et al reported that prognostic factors associated with visual field (VF) recovery after ETSS-PA were low preoperative mean-deviation absolute value, small craniocaudal tumor diameter (< 30 mm) and younger age at the time of surgery.9 Of ophthalmic structural parameters, the loss of peripapillary retinal nerve fiber layer thickness (pRNFLT), measured with optical coherence tomography (OCT), indicates loss of retinal ganglion cell axons resulting from chronic compression of the optic chiasm.10 There have been various studies supporting the use of pRNFLT as a prognostic factor for postoperative visual recovery after ETSS-PA.11–15 However, these studies did not evaluate the postoperative visual functions in terms of their actual values. Instead, they evaluated outcomes in terms of postoperative visual recovery, i.e. the changes in visual functions at after surgery, compared with preoperative visual functions.
Given the effects of race and ethnicity on pRNFLT,16,17 the ability to generalize prior studies’ results from populations of different races and ethnicities is limited. To-date, there have been few studies that have identified pRNFLT as predictive of postoperative visual recovery or visual functions after ETSS-PA for Asian individuals. For example, a study conducted in South Korea reported that preoperative global pRNFLT ≥ 23.6 µm was associated with better postoperative VF defect recovery after ETSS-PA.14 Moreover, there were also other limitations in the previous studies.10,13 First, they included both transsphenoidal and transcranial approaches in the cohorts without separate analysis on either condition.10 In addition, they included individuals with PA who had undergone tumor resection and/or radiotherapy prior to enrollment.13
Therefore, the primary goal of our study was to evaluate the utility of preoperative pRNFLT for predicting postoperative visual functions in terms of their actual values among Thai subjects with PA who were treated with ETSS-PA alone.
Materials and Methods
This study followed the tenets of the Declaration of Helsinki and was approved by the Institutional Review Board (IRB) of the Faculty of Medicine Ramathibodi Hospital, Mahidol University, Bangkok, Thailand (IRB number: COA. MURA2021/838), which waived the need for written informed consent from the subjects due to the retrospective nature of the study. All data were kept confidentially in our database. Electronic medical records were reviewed to identify all subjects with PA who underwent ETSS-PA in Ramathibodi Hospital, Mahidol University, Bangkok, Thailand from 1 April, 2011, to 31 December, 2021.
Subjects/Eyes Selection
Included were subjects who met all of the following criteria: 1) PA with associated compression of the anterior visual pathways confirmed by magnetic resonance imaging; 2) underwent ETSS-PA in Ramathibodi Hospital during the relevant period; 3) tissue diagnosis of PA confirmed by histopathology; 4) had both preoperative visual acuity (VA) and VF assessments, as well as pRNFLT measured with OCT within 3 months prior to ETSS-PA; and 5) had both VA and VF assessments > 1 month but < 6 months after ETSS-PA. Exclusion criteria included the following: 1) age < 18 years at the time of ETSS-PA; 2) history of previous treatments for PA, such as tumor resection, hormonal therapy, radiotherapy or chemotherapy; and 3) presence of postoperative complications, including intracranial hemorrhage, cerebrospinal fluid leakage and postoperative infection. Furthermore, eyes with one or more of the following were excluded: 1) presence of visually significant cataracts and/or diseases other than PA that could affect VA and/or VF; and 2) spherical refractive error outside the range of > 5 diopters, or > 2 diopters of astigmatism.
Demographic Data, Visual Functions Assessment, and Preoperative pRNFLT Measurement
Demographic data (age at ETSS-PA, sex and spherical equivalent refraction) and visual function assessments, including VA and VFs within 3 months prior to ETSS-PA and again between 1 and 6 months after ETSS-PA, were reviewed. VA was assessed using the Early Treatment Diabetic Retinopathy Study (ETDRS) chart. Postoperative VA was categorized into 2 groups, “good VA” (i.e. postoperative VA better than or equal to 20/25), and “worse than 20/25 VA”. VF assessment was performed using the 24–2 SITA program (Humphrey Field Analyzer, Carl-Zeiss Meditec, Dublin, CA). Eyes with an unreliable VF assessment, which was defined as > 33% false positive, > 33% false negative or > 20% fixation loss, were excluded from the VF analysis. The visual field index (VFI) was used as a proxy for the degree of VF defect (the greater the VF defect, the lower the VFI percentage). “Favorable VF” was defined as a postoperative VFI > 90%, whereas “unfavorable VF” was defined as postoperative VFI ≤ 90%. The preoperative pRNFLT measurement was performed using the Cirrus HD-OCT Model 4000 (Carl-Zeiss Meditec) within 3 months prior to ETSS-PA. The optic nerve head cube 200×200 scan protocol was used. OCT images of low signal strength (signal strength < 6) or with segmentation error(s) were excluded. The mean thickness of the pRNFLT was measured both globally, and separately in all four quadrants (superior, temporal, inferior and nasal).
Statistical Analysis
Continuous variables were expressed using mean or median, with normally distributed results shown as mean ± standard deviation (SD) and non-normally distributed results shown as median and interquartile range (IQR). Categorical variables were expressed as frequency and percentage. Age at ETSS-PA and preoperative pRNFLT (globally and in all four quadrants) were compared between groups using independent t-tests. Sex was compared between groups using a Chi-squared test. Spherical equivalent refraction was compared between groups using the Wilcoxon rank sum test. For multivariable analysis, logistic regression was applied, to simultaneously regress postoperative visual functions with variables (age at ETSS-PA, sex and preoperative pRNFLT). The likelihood ratio test was applied to select and retain only significant variables in the final equation. All analyses were performed using STATA 17.0 (StataCorp LLC, College Station, TX). P-values of < 0.05 were considered statistically significant. The optimal cut-off values were identified using the maximal Youden’s index value.19 ETDRS VA values were converted to logarithm of the minimum angle of resolution (logMAR) values for statistical analysis. VA categories of counting fingers, hand motion, light perception and no light perception were converted to 2.6, 2.7, 2.8 and 2.9 logMAR, respectively.20,21
Results
Demographic Data, Preoperative and Postoperative Visual Functions, and Preoperative pRNFLT Measurement
The study included data from 66 eyes of 33 subjects who underwent ETSS-PA. The mean age at ETSS-PA was 52.2 ± 15.3 years. Of the 33 subjects, 15 (45.5%) were female. The median spherical equivalent refraction was −0.38 (−0.75, 0.00) diopters. The median preoperative VA was 0.32 (0.12, 0.74) logMAR and median postoperative VA was 0.14 (0.02, 0.40) logMAR (p < 0.001). There were 56 eyes with both reliable preoperative VFI and reliable postoperative VFI. The mean preoperative VFI was 67.68% ± 29.51% and mean postoperative VFI was 79.45% ± 24.24% (p < 0.001). The preoperative global and quadrant pRNFLT measurements are shown in Table 1.
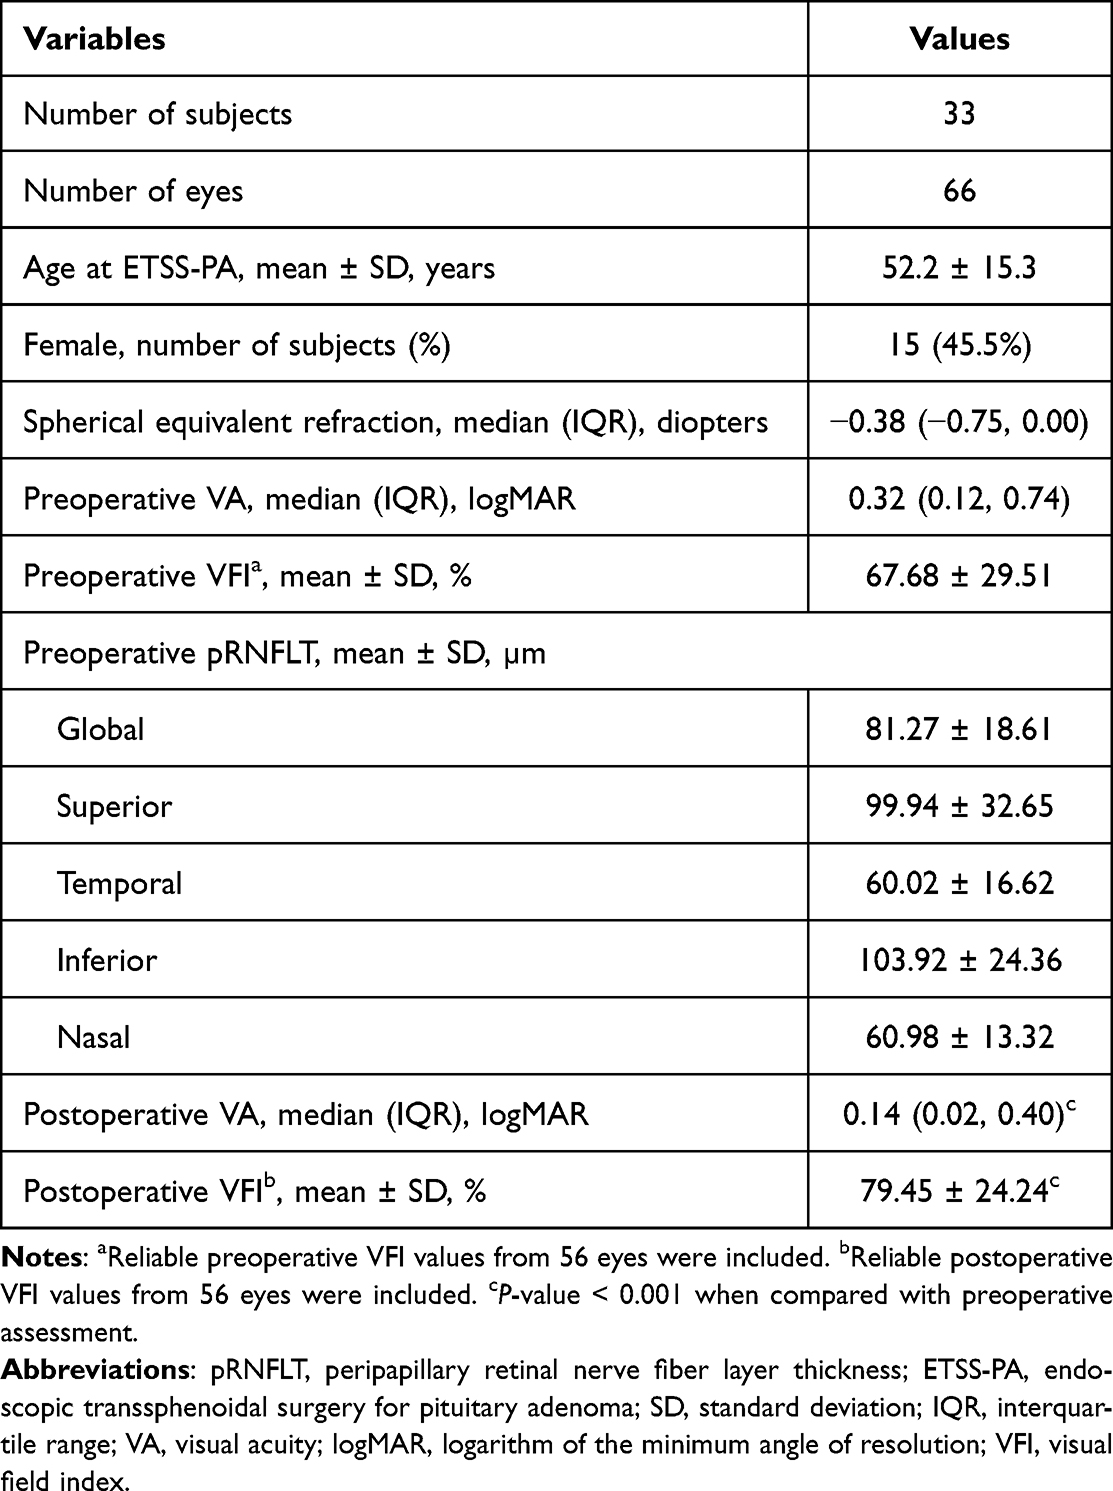 |
Table 1 Demographic Data, Preoperative and Postoperative Visual Functions, and Preoperative pRNFLT Measurement |
Association Between Preoperative pRNFLT Measurement and Postoperative VFI
Based on postoperative VFI, the 56 eyes were categorized into a favorable-VF group and an unfavorable-VF group. The mean age at ETSS-PA was significantly younger in the favorable-VF group than the unfavorable-VF group (46.43 ± 14.22 versus 58.18 ± 13.85 years, respectively, p = 0.006). Compared with the unfavorable-VF group, the favorable-VF group had a higher proportion of females (71.43% versus 21.43%, p < 0.001). There was no significant difference in spherical equivalent refraction between the groups (p = 0.383). Preoperative pRNFLT measurements in the favorable-VF group were significantly thicker than those in the unfavorable-VF group globally, and in the superior, temporal and inferior quadrants (Table 2). Multivariable analysis revealed that female sex (odds ratio, 20.65; p = 0.014), and thicker preoperative temporal (odds ratio, 1.18; p = 0.024) and inferior (odds ratio, 1.07; p = 0.013) pRNFLT values were associated with favorable VF, as shown in Table 3. The strongest association was observed for the preoperative temporal pRNFLT (area under the curve (AUC) = 0.821, 95% confidence interval (CI): 0.720–0.923) with a cut-off value of 60 µm. The sensitivity and specificity of this preoperative temporal pRNFLT cut-off value for predicting favorable VF after ETSS-PA were 85% and 78%, respectively.
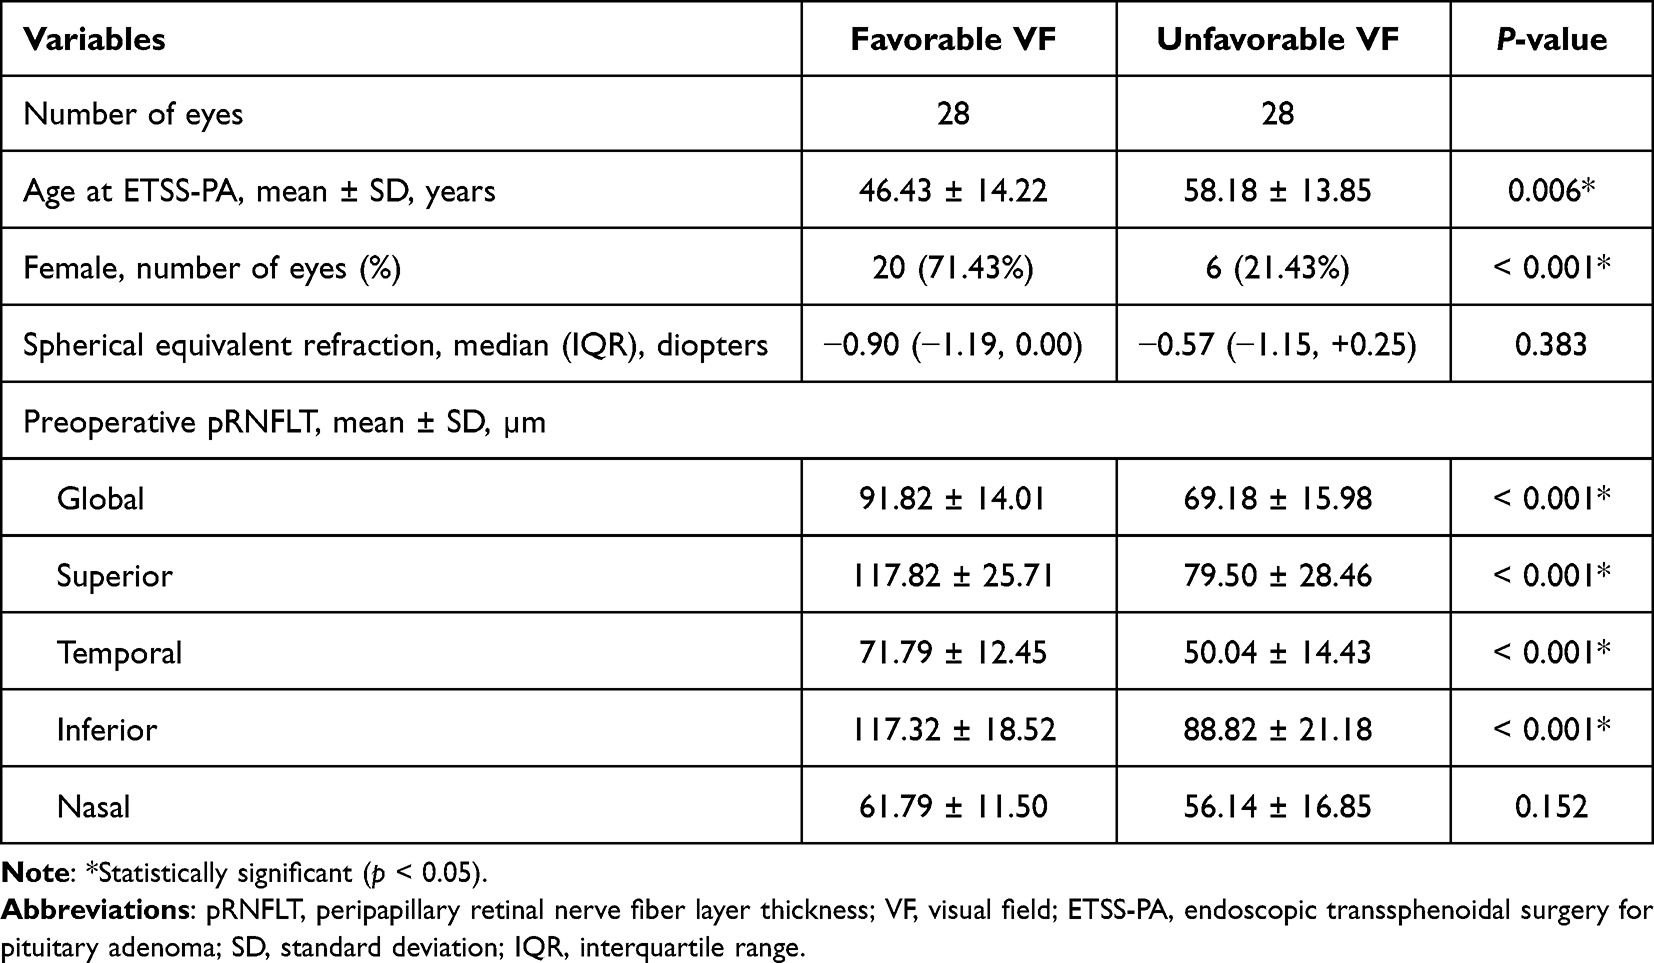 |
Table 2 Comparison of Demographic Data and Preoperative pRNFLT Measurements Between Eyes with Favorable and Unfavorable VF |
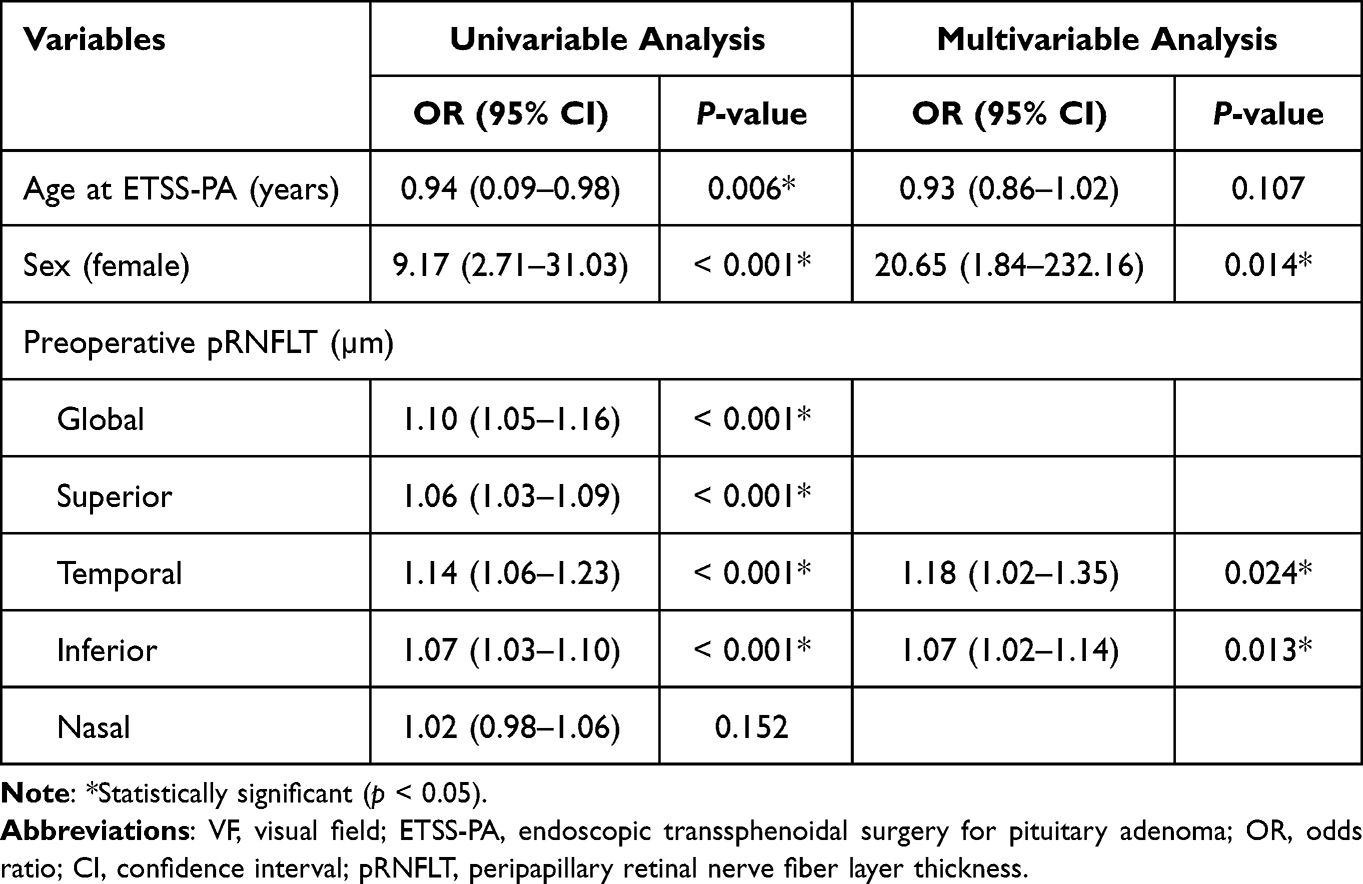 |
Table 3 Factors Associated with Favorable VF After ETSS-PA |
Association Between Preoperative pRNFLT Measurement and Postoperative VA
The mean age at ETSS-PA was significantly younger in the good-VA group than in the worse than 20/25 VA group (47.63 ± 13.76 versus 55.38 ± 15.50 years, respectively, p = 0.040). There was no significant difference in terms of sex or spherical equivalent refraction (p = 0.173 and p = 0.979, respectively). Eyes in the postoperative good-VA group had significantly thicker preoperative pRNFLT measurements globally and in the superior, temporal and inferior quadrants (Table 4). The multivariable analysis revealed that thicker preoperative inferior-quadrant pRNFLT (odds ratio, 1.05; p = 0.001) was associated with good postoperative VA, as shown in Table 5. The maximal predictive performance was found with preoperative inferior pRNFLT (AUC = 0.732, 95% CI: 0.615–0.849) with a cut-off value of 105 µm. The sensitivity and specificity of this preoperative inferior pRNFLT cut-off value for predicting good VA postoperatively after ETSS-PA were 68% and 79%, respectively.
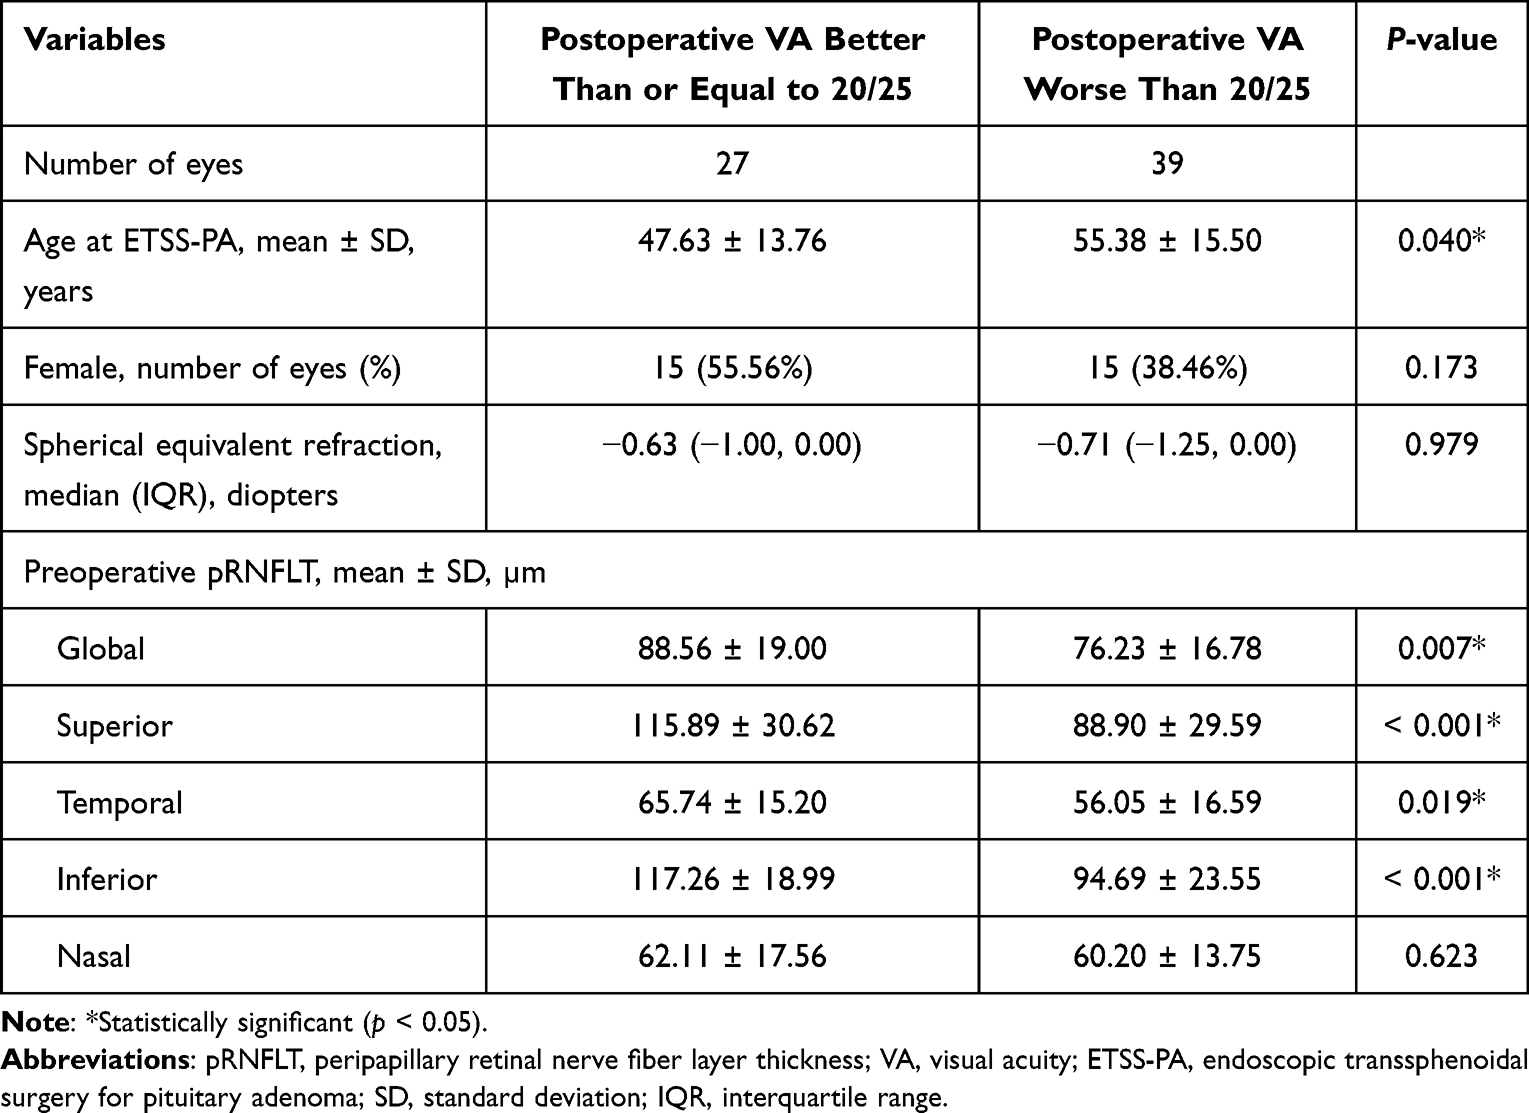 |
Table 4 Comparison of Demographic Data and Preoperative pRNFLT Measurement Between Eyes with Postoperative VA Better Than or Equal to 20/25 versus Worse Than 20/25 |
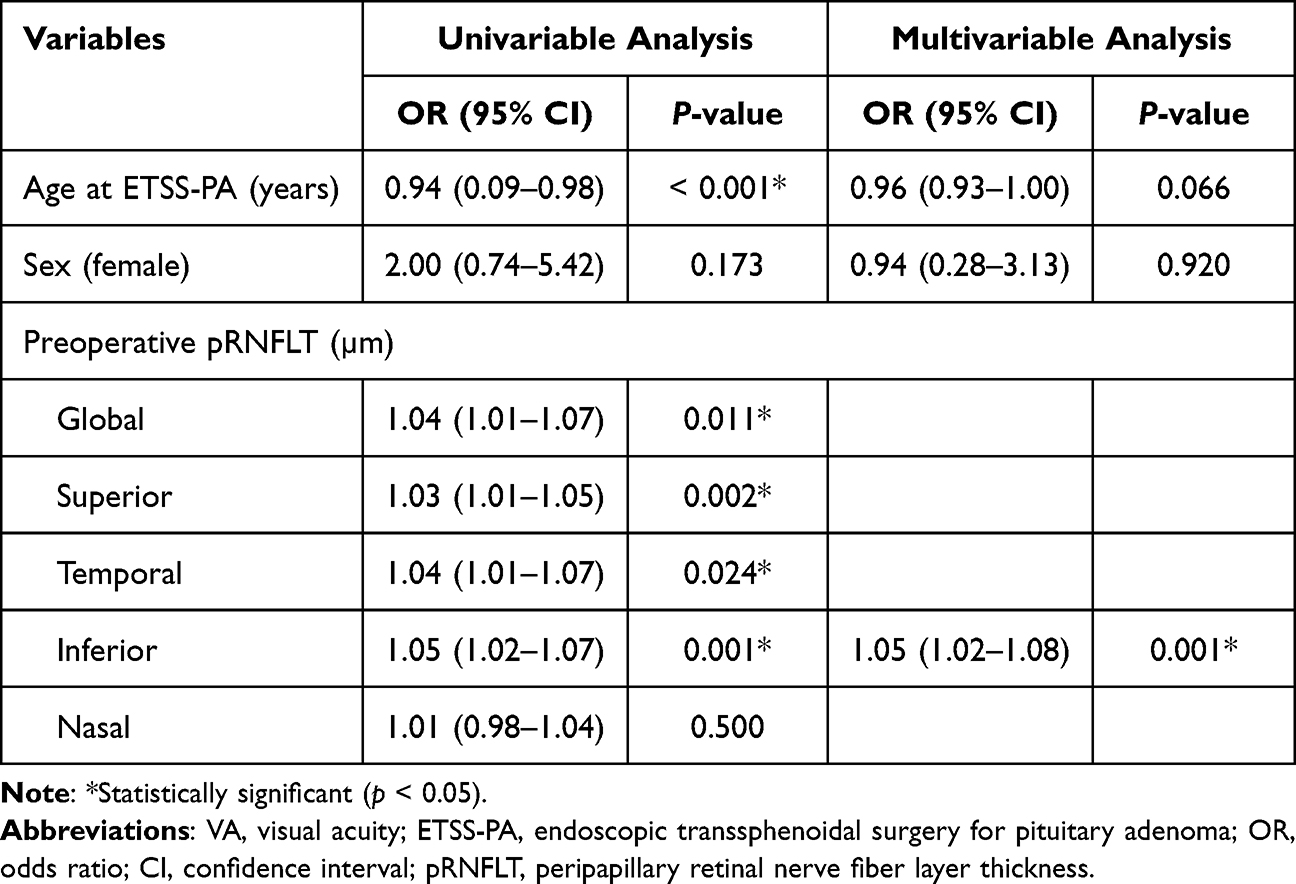 |
Table 5 Factors Associated with Postoperative VA Better Than or Equal to 20/25 After ETSS-PA |
Discussion
We evaluated the performance of preoperative pRNFLT, both as a global measure and in each of the four quadrants, for predicting postoperative visual functions among subjects with PA who underwent ETSS-PA. We found that the prognostic performance of pRNFLT in predicting favorable VF postoperatively was best in the temporal quadrants. This finding is comparable with previous study conducted in South Korea, which demonstrated that preoperative temporal pRNFLT ≥ 58 µm was associated with better postoperative VF defect recovery after ETSS-PA.18 We also found that the prognostic performance of pRNFLT in predicting good VA (VA better than or equal to 20/25) postoperatively was best in the inferior quadrant. Only a few studies have identified preoperative pRNFLT as the prognostic factor of postoperative VA after ETSS-PA. Iqbal et al reported that recovery in VA occurred after ETSS-PA postoperatively only when preoperative global pRNFLT was greater than 85 µm.15 Nevertheless, this study did not measure preoperative pRNFLT separately in each of the four quadrants. In addition to prior studies, in which preoperative pRNFLT has been investigated as a prognostic factor for postoperative visual recovery after ETSS-PA,15,18 our results provide better insight into postoperative visual functions in terms of their actual values.
Of interest, our study found an association between female sex and favorable VF status (odds ratio, 20.65; p = 0.014). An earlier medical attention seeking due to PA-related menstrual cycle interruption in females, compared with males, who do not seek medical attention until they have severe hypogonadism or problems due to space-occupying lesions or hypopituitarism, might explain this finding.22
Our study comprehensively established the potential preoperative pRNFLT cut-off values in predicting postoperative VFI > 90% and good postoperative VA within the Thai population. These proposed cut-off values can give ophthalmologists and neurosurgeons enhanced information on postoperative visual prognoses and might, accordingly, help improve preoperative counseling before ETSS-PA. Furthermore, there were significant improvements in postoperative VFI compared with preoperative VFI and postoperative VA compared with preoperative VA. These significant improvements in postoperative VFI and VA after ETSS-PA are consistent with the findings in previous studies.18,23
Our study had several strengths. First, to the best of our knowledge, this is the first study among the Thai population to establish an association between preoperative pRNFLT and postoperative visual functions after ETSS-PA. Second, our study included both VFI and VA, measured pre- and postoperatively. Third, this study included a large number of subjects with PA who had no history of previous treatments for PA, such as tumor resection, hormonal therapy, radiotherapy or chemotherapy, and who were treated with ETSS-PA exclusively. Fourth, this study reports the cut-off values of preoperative pRNFLT for favorable VF and postoperative good VA. Finally, we used multivariable analysis to quantify the preoperative pRNFLT effect on the probability of favorable VF and postoperative good VA after regressing these postoperative visual functions with subject age at ETSS-PA and sex.
There were some limitations in this study. First, we did not evaluate other components of visual function, such as color vision or contrast sensitivity. Second, this study did not evaluate the thickness of the macular ganglion cell layer and the inner plexiform layer. Finally, postoperative visual functions were not assessed beyond 6 months after surgery.
Conclusions
Postoperative VFI greater than 90% is more likely to be found if the preoperative temporal pRNFLT is greater than or equal to 60 µm, and postoperative VA better than or equal to 20/25 is more likely to be found if preoperative pRNFLT in the inferior quadrant is greater than or equal to 105 µm. These findings provide greater clarity regarding the potential clinical utility of preoperative pRNFLT for predicting postoperative visual functions after ETSS-PA.
Acknowledgments
The authors would like to thank Ms. Sasiporn Sitthisorn, Department of Clinical Epidemiology and Biostatistics, Faculty of Medicine Ramathibodi Hospital, Mahidol University, Bangkok, Thailand, for her advice on the statistical analysis. We thank Claire Barnes, PhD, from Edanz (https://www.edanz.com/ac) for editing a draft of this manuscript.
Disclosure
The authors declare that they have no conflicts of interest in this work.
References
1. Lim CT, Korbonits M. Update on the clinicopathology of pituitary adenomas. Endocr Pract. 2018;24(5):473–488. doi:10.4158/EP-2018-0034
2. Ferrante E, Ferraroni M, Castrignano T, et al. Non-functioning pituitary adenoma database: a useful resource to improve the clinical management of pituitary tumors. Eur J Endocrinol. 2006;155(6):823–829. doi:10.1530/eje.1.02298
3. Agustsson TT, Baldvinsdottir T, Jonasson JG, et al. The epidemiology of pituitary adenomas in Iceland, 1955–2012: a nationwide population-based study. Eur J Endocrinol. 2015;173(5):655–664. doi:10.1530/EJE-15-0189
4. Kerrison JB, Lynn MJ, Baer CA, Newman SA, Biousse V, Newman NJ. Stages of improvement in visual fields after pituitary tumor resection. Am J Ophthalmol. 2000;130(6):813–820. doi:10.1016/S0002-9394(00)00539-0
5. Wadud SA, Ahmed S, Choudhury N, Chowdhury D. Evaluation of ophthalmic manifestations in patients with intracranial tumours. Mymensingh Med J. 2014;23(2):268–271.
6. Iglesias P, Rodríguez Berrocal V, Díez JJ. Giant pituitary adenoma: histological types, clinical features and therapeutic approaches. Endocrine. 2018;61(3):407–421. doi:10.1007/s12020-018-1645-x
7. Freda PU, Beckers AM, Katznelson L, et al. Pituitary incidentaloma: an endocrine society clinical practice guideline. J Clin Endocrinol Metab. 2011;96(4):894–904. doi:10.1210/jc.2010-1048
8. Chanson P, Salenave S. Diagnosis and treatment of pituitary adenomas. Minerva Endocrinol. 2004;29(4):241–275.
9. Barzaghi LR, Medone M, Losa M, Bianchi S, Giovanelli M, Mortini P. Prognostic factors of visual field improvement after trans-sphenoidal approach for pituitary macroadenomas: review of the literature and analysis by quantitative method. Neurosurg Rev. 2012;35(3):369–378;discussion 378–379. doi:10.1007/s10143-011-0365-y
10. Danesh-Meyer HV, Wong A, Papchenko T, et al. Optical coherence tomography predicts visual outcome for pituitary tumors. J Clin Neurosci. 2015;22(7):1098–1104. doi:10.1016/j.jocn.2015.02.001
11. Jacob M, Raverot G, Jouanneau E, et al. Predicting visual outcome after treatment of pituitary adenomas with optical coherence tomography. Am J Ophthalmol. 2009;147(1):64–70(e62). doi:10.1016/j.ajo.2008.07.016
12. Kurian DE, Horo S, Horo S, et al. Predictive value of retinal nerve fibre layer thickness for postoperative visual improvement in patients with pituitary macroadenoma. BMJ Open Ophthalmol. 2022;7(1):e000964. doi:10.1136/bmjophth-2021-000964
13. Jeon C, Park KA, Hong SD, et al. Clinical efficacy of optical coherence tomography to predict the visual outcome after endoscopic endonasal surgery for suprasellar tumors. World Neurosurg. 2019;132:e722–e731. doi:10.1016/j.wneu.2019.08.031
14. Moon JS, Shin SY. Segmented retinal layer analysis of chiasmal compressive optic neuropathy in pituitary adenoma patients. Graefes Arch Clin Exp Ophthalmol. 2020;258(2):419–425. doi:10.1007/s00417-019-04560-3
15. Iqbal M, Irfan S, Goyal JL, Singh D, Singh H, Dutta G. An analysis of retinal nerve fiber layer thickness before and after pituitary adenoma surgery and its correlation with visual acuity. Neurol India. 2020;68(2):346–351. doi:10.4103/0028-3886.280634
16. Ho H, Tham YC, Chee ML, et al. Retinal nerve fiber layer thickness in a multiethnic normal Asian population: the Singapore Epidemiology of Eye Diseases Study. Ophthalmology. 2019;126(5):702–711. doi:10.1016/j.ophtha.2018.11.031
17. Poon LY, Antar H, Tsikata E, et al. Effects of age, race, and ethnicity on the optic nerve and peripapillary region using spectral-domain OCT 3D volume scans. Transl Vis Sci Technol. 2018;7(6):12. doi:10.1167/tvst.7.6.12
18. Park SH, Kang MS, Kim SY, et al. Analysis of factors affecting visual field recovery following surgery for pituitary adenoma. Int Ophthalmol. 2021;41(6):2019–2026. doi:10.1007/s10792-021-01757-6
19. Hajian‐Tilaki K. The choice of methods in determining the optimal cutoff value for quantitative diagnostic test evaluation. Stat Methods Med Res. 2018;27(8):2374–2383. doi:10.1177/0962280216680383
20. Grover S, Fishman GA, Anderson RJ, et al. Visual acuity impairment in patients with retinitis pigmentosa at age 45 years or older. Ophthalmology. 1999;106(9):1780–1785. doi:10.1016/S0161-6420(99)90342-1
21. McAnany JJ, Genead MA, Walia S, et al. Visual acuity changes in patients with Leber congenital amaurosis and mutations in CEP290. JAMA Ophthalmol. 2013;131(2):178–182. doi:10.1001/2013.jamaophthalmol.354
22. Arasho BD, Schaller B, Sandu N, et al. Gender-related differences in pituitary adenomas. Exp Clin Endocrinol Diabetes. 2009;117(10):567–572. doi:10.1055/s-0029-1202831
23. Chung YS, Na M, Yoo J, et al. Optical coherent tomography predicts long-term visual outcome of pituitary adenoma surgery: new perspectives from a 5-year follow-up study. Neurosurgery. 2020;88(1):106–112. doi:10.1093/neuros/nyaa318
 © 2022 The Author(s). This work is published and licensed by Dove Medical Press Limited. The
full terms of this license are available at https://www.dovepress.com/terms
and incorporate the Creative Commons Attribution
- Non Commercial (unported, 3.0) License.
By accessing the work you hereby accept the Terms. Non-commercial uses of the work are permitted
without any further permission from Dove Medical Press Limited, provided the work is properly
attributed. For permission for commercial use of this work, please see paragraphs 4.2 and 5 of our Terms.
© 2022 The Author(s). This work is published and licensed by Dove Medical Press Limited. The
full terms of this license are available at https://www.dovepress.com/terms
and incorporate the Creative Commons Attribution
- Non Commercial (unported, 3.0) License.
By accessing the work you hereby accept the Terms. Non-commercial uses of the work are permitted
without any further permission from Dove Medical Press Limited, provided the work is properly
attributed. For permission for commercial use of this work, please see paragraphs 4.2 and 5 of our Terms.
Recommended articles
Retrograde Optic Nerve Degeneration in Pituitary Adenoma: A Study with RE-PERG
Mavilio A, Sisto D, Dammacco R, Durante G, Alessio G
Clinical Ophthalmology 2022, 16:4135-4144
Published Date: 13 December 2022
Fovea-Sparing Internal Limiting Membrane (ILM) Peeling and ILM Plug: A Novel Approach for Managing Optic Disc Pit Maculopathy
Chakraborty S, Sheth JU
Clinical Ophthalmology 2024, 18:3343-3351
Published Date: 19 November 2024
Partial Detachment of an ILM Inverted Flap After a Successful Closure of a Full-Thickness Traumatic Macular Hole
Al Taisan AA
International Medical Case Reports Journal 2024, 17:1025-1028
Published Date: 12 December 2024
Real-World Efficacy of Intravitreal Faricimab for Macular Edema Secondary to Retinal Vein Occlusion: Short-Term Outcomes and Optical Coherence Tomography Biomarker Analysis
Inokuchi S, Mizuki Y, Kamata A, Onishi J, Hayashi T, Mizuki N
Clinical Ophthalmology 2025, 19:3669-3679
Published Date: 4 October 2025
Incremental Predictive Value of Preoperative Macular Optical Coherence Tomography for Postoperative Visual Acuity After Phacoemulsification Cataract Surgery: A Retrospective Cohort Study
AlJohani S, Alshehri A, Al Khathami A, Alshehri RS, AlJaafar NA, Albadran RA, Alismail MMA, Shaheen A
Clinical Ophthalmology 2026, 20:589672
Published Date: 17 April 2026