Back to Journals » Clinical Ophthalmology » Volume 11
Retinal and choroidal thickness after femtosecond laser-assisted and standard phacoemulsification
Authors Asena BS, Karahan E, Kaskaloglu M
Received 15 November 2016
Accepted for publication 29 March 2017
Published 21 August 2017 Volume 2017:11 Pages 1541—1547
DOI https://doi.org/10.2147/OPTH.S127792
Checked for plagiarism Yes
Review by Single anonymous peer review
Peer reviewer comments 2
Editor who approved publication: Dr Scott Fraser
Bilgehan Sezgin Asena,1 Eyyup Karahan,2 Mahmut Kaskaloglu1
1Department of Ophthalmlolgy, Kaskaloglu Eye Hospital, 2Department of Ophthalmlolgy, Batigoz Eye Hospital, Izmir, Turkey
Purpose: The purpose of this study was to compare the short-term changes in retina and choroidal tissue after femtosecond laser-assisted cataract surgery (FLACS) and standard phacoemulsification (PE) surgery.
Methods: In all, 25 eyes undergoing FLACS and 27 eyes undergoing PE surgery were included in this nonrandomized, retrospective, cross-sectional study. Central retinal thickness (CRT) and choroidal thickness (CT) were measured pre- and postoperatively (at day 1, 1 week later, and after 1 month) with spectral domain optical coherence tomography (OCT) in all patients and were compared. For group comparisons, chi-square test and independent t-test were used. Postoperative values were compared to the baseline using a paired t-test. The magnitude of the change from baseline to the peak was analyzed by multiple regression models in an attempt to explain possible influence variables.
Results: Pre and postoperative CRT measurements were similar in both groups. The mean subfoveal CT at day 1, after 1 week, and 1 month were significantly higher than baseline CT measurements in the PE group.
Conclusion: FLACS might have an advantage in regard to postoperative choroidal changes.
Keywords: femtosecond laser, cataract, visual acuity, central retinal thickness, choroidal thickness, optical coherence tomography
Introduction
Phacoemulsification (PE) technique has become the standard of care due to its faster rehabilitation and lower complication rates in cataract surgery. Despite advances in PE technique, pseudophakic cystoid macular edema (PCME) is still one of the most common causes of vision loss following surgery.1 Although the exact pathogenesis of PCME is not clear, multifactorial pathogenesis including the release of inflammatory mediators such as prostaglandins, light toxicity, and mechanical irritation are thought to cause a breakdown of the blood–aqueous barrier and the blood–retinal barrier, thus producing increased vascular permeability and macular edema.2,3 In most cases, PE does not change the macroscopic fundus appearance of the retina. However, increase in central retinal thickness (CRT), even without PCME, after uneventful cataract surgery has become a safety concern for this frequently performed operation.4–6 Changes in subfoveal choroidal thickness (CT) after uneventful cataract surgery are sparsely studied with varying results.6–9
Femtosecond laser-assisted cataract surgery (FLACS) was approved by the Food and Drug Administration in 2009 and is promising in terms of increased predictability and consistent results by offering automated steps during critical phases of cataract surgery.10 FLACS also offers a decrease in cumulative dissipated energy that might reduce the release of inflammatory mediators within the aqueous chamber, which may result in less macular edema.11,12 Initial studies on the effect of FLACS surgery on macular thickness revealed promising results compared to standard PE.13,14 Standard PE and FLACS techniques have not yet been compared with a view to observe changes in postoperative CT, which could be important in developing PCME. From this point of view, short-term CRT and CT changes need to be evaluated after standard PE and FLACS with posterior chamber intraocular lens (IOL) implantation.
Materials and methods
This retrospective case series included patients with different grades (I–IV) of cataract who had uneventful FLACS and standard PE surgery. Patients who had FLACS were compared to those who had standard PE surgery in terms of the postoperative CRT and CT. All surgeries were performed by the same experienced surgeon (BSA) at Kaskaloglu Eye Hospital between January 2015 and March 2015. In line with the tenets of the Declaration of Helsinki, informed consent for FLACS and standard PE surgery was obtained from all patients who declared that they were able to comply with the treatment procedure and the follow-up schedule. Patient consent for review of their charts and records for the current study was not required by the Instutional Review Board of Van Education and Training Hospital because of the retrospective design of the study.
The Lens Opacities Classification System (LOCS) III grading score was used.15 Preoperative LOCS score was estimated by an independent physician using a slit-lamp (Inami L-0185; Inami & Co, Tokyo, Japan) at maximum illumination without light filtering. Exclusion criteria were history of any ocular diseases and surgery, particularly those, which can cause changes in the macula. Since diabetes, hypertension, and cigarette smoking may well affect CT, those were excluded as well.
All patients underwent a full ophthalmic examination including best-corrected visual acuity (BCVA), slit-lamp evaluation, intraocular pressure measurement (Goldmann tonometry), macular and optic disc examination to exclude other ocular pathologies, and CRT and CT measurements by using high-resolution spectral domain optical coherence tomography (SD-OCT; 3D OCT-2000® Topcon; Topcon Corp., Tokyo, Japan). Preoperative and postoperative (at day 1, day 7, and 4 weeks after surgery) CRT and CT measurements were components of standard examination for cataract patients in the present clinic. The differences of CT and CRT were corrected for the resolution limits of the OCT device used in the clinic. In order to calculate the power of IOL needed, biometry was conducted using optical (IOLMaster; Carl Zeiss Meditec Inc, Jena, Germany) and immersion (Ocuscan; Alcon Labs Inc, Fort Worth, TX, USA) techniques.
Procedure
All procedures were carried out under topical anesthesia with proparacaine hydrochloride 0.5% (Alcaine®; Alcon Labs Inc). Standard preoperative medications administered for pupillary dilation an hour before surgery were tropicamide 0.5% (Tropamide®; Bilim Ilac, Istanbul, Turkey), phenylephrine hydrochloride 0.25% (Mydfrin®; Alcon Labs Inc), and nepafenac 0.1% ophthalmic suspension (Nevanac®; Alcon Labs Inc).
In the FLACS group, femtosecond laser procedure was performed using the LenSx laser system with the SoftFit™ interface (version 2.20 software, Laser SoftFit™; Alcon Labs Inc). The LenSx laser is a 50 kHz infrared laser with a pulse width of 600–8,002 femtosecond, a central laser wavelength of 1,030 nm, and a maximum pulse energy of 15 mJ. The SoftFit™ patient interface has an additional soft contact lens between the corneal surface and the curved interface. The interface surface had a diameter of 10.8 mm and a curvature of 8.3 mm. This disposable patient interface was docked to the eye and the individual patient treatment was programmed into the laser system. The system automatically imaged the ocular structures with the integrated OCT imaging system and determined the treatment parameters. All patients in the FLACS group had capsulotomy, lens fragmentation, and corneal incisions by the laser. A 5 mm diameter capsulotomy with pupil centration was created by scanning a cylindrical pattern as ablation pattern. Hybrid pattern (the central 2.5 mm core liquefied and the peripheral parts fragmented into four parts with two cuts) was used as the fragmentation pattern. A 2.40 mm three-plane trapezoidal primary incision and two 1.20 mm 30°-angled secondary incisions were created. Parameters included laser pulse energy at 7 mJ for corneal incisions and 5 mJ for capsulotomy and lens fragmentation.
The PE group underwent conventional cataract surgery. A 2.40 mm main corneal incision with a metal keratome and continuous curvilinear capsulorrhexis using rhexis forceps were performed before PE.
After hydrodissection, PE was performed using the Infiniti system® (Alcon Labs Inc) in both groups. Lens segmentation was undertaken in both groups using a quick chop approach. In all cases, after removal of the lens cortex, a foldable IOL was implanted uneventfully in the capsular bag.
Intraoperative measurements included determining the effective PE time (EPT). The EPT is measured in seconds and represents the total PE time multiplied by the average percentage power used. It is a metric of the length of PE time at 100% power in continuous mode.
CRT and subfoveal CT were measured preoperatively, on the first day, first week, and the first month postoperatively, by using high-resolution SD-OCT (3D OCT-2000® Topcon) with 6 mm single line scanning (λ=840 nm, 27.000 A-scans/s, and 5 μm axial resolution). All CT and CRT measurements were performed by one grader (EK) and the grader was masked for the surgery method. The protocol of the enhanced choroidal mode cross scan was conducted centering on the fovea as described previously.16 Scans with low quality and blinks were not included and were repeated. In order to avoid the circadian change in CT measurements, all measurements were performed at the same time of the day (between 08:00 and 09:00 am). For each eye, CT and CRT were measured three times repeatedly at regular intervals of 20 minutes and the mean values were recorded. Eyes with >5% difference between three measurements were excluded from the study.
The standard postoperative regimen included one drop each of 0.5% moxifloxacin (Vigamox; Alcon Labs Inc), nepafenac 0.1% ophthalmic suspension (Nevanac; Alcon Labs Inc), and 0.1% dexamethasone ophthalmic suspension (Maxidex; Alcon Labs Inc) four times a day for 2 weeks and was the same for both groups. Steroid drops then were reduced to twice daily for another week. The patients were followed up at day 1, day 7, and 4 weeks after surgery.
Data were extracted from patient charts and surgical videos, which included preoperative and postoperative corrected distance visual acuity, cataract grading, and preoperative and postoperative CRT and CT. Intraoperative measurements included EPT. Patient charts and findings were analyzed retrospectively.
Statistical analysis
Statistical analysis was performed with SPSS for Windows 16.0 (SPSS Inc., Chicago, IL, USA). For intergroup comparisons, chi-square test and independent t-test were used. Power calculation was carried out for CT and CRT by using SPSS general linear model repeated measures section. The magnitude of the change from baseline to the peak was analyzed with possible explanatory variables by multiple regression models. A P-value <0.05 was considered statistically significant.
Results
The FLACS group comprised 25 eyes of 25 patients who had undergone FLACS. The mean age of the 16 female and 9 male patients was 70.5±6.7 years (range 59–84 years). The PE group comprised 27 eyes of 27 patients who had undergone standard PE surgery. The mean age of the 17 female and 10 male patients was 70.2±9.6 years (range 51–90 years) (Table 1).
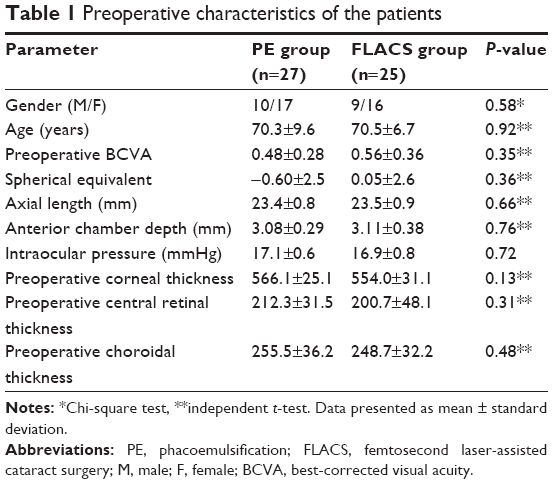 | Table 1 Preoperative characteristics of the patients |
Mean cataract grade was 2.81±0.65 in the FLACS group and 2.78±0.71 in the PE group, with no statistically significant differences between the groups. The EPT was 1.98±1.01 seconds in the FLACS group and 4.23±1.96 seconds in the PE group. The EPT was statistically significantly lower in the FLACS group (P<0.0001). There was no correlation between EPT and the difference of CT compared with basal CTs at day 1 (r=0.13, P=0.36), week 1 (r=0.18, P=0.20), and month 1 (r=0.06, P=0.70).
One month following surgery, the inflammation indicated by the presence of cells or flares in the anterior chamber disappeared in all patients. There was no complication in the postoperative course of any patient. There was no significant difference between the two groups in terms of age, preoperative BCVA (P=0.35), refractive errors (P=0.36), axial length (P=0.66), anterior chamber depth (P=0.76), intraocular pressure (P=0.72), preoperative CRT (P=0.31), or preoperative subfoveal CT (P=0.48) (Table 1). No PCME or subretinal fluid developed in any patient.
Mean preoperative and postoperative CRT and CT values are shown in Table 2. CRT was not different in any visit compared with baseline retinal thickness in both groups. In the FLACS group, there was no significant difference between baseline CT and postoperative CT values (P=0.37, 0.10, and 0.59). In the PE group, the mean subfoveal CT 1 day, 1 week, and 1 month after surgery were significantly higher compared with the baseline CT (P=0.003, 0.02, and 0.02, respectively) (Tables 3 and 4, Figure 1). Observed power was 0.849 for CT, 0.323 for CRT.
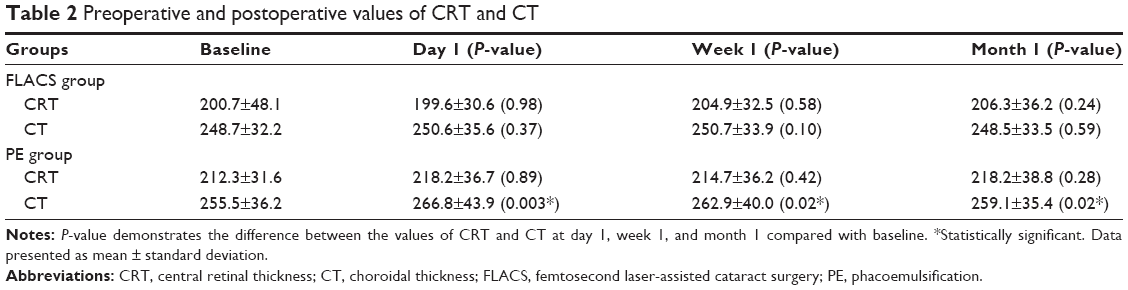 | Table 2 Preoperative and postoperative values of CRT and CT |
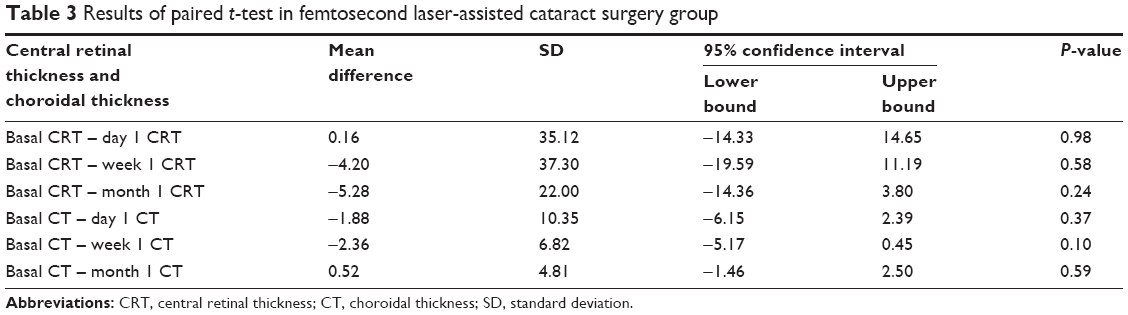 | Table 3 Results of paired t-test in femtosecond laser-assisted cataract surgery group |
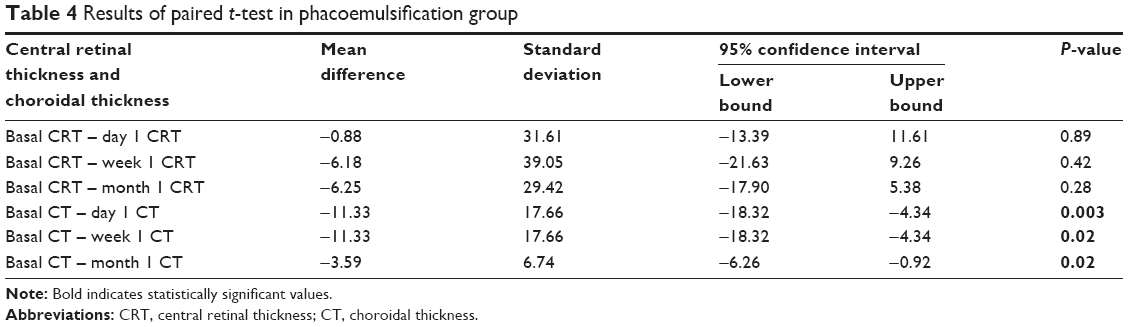 | Table 4 Results of paired t-test in phacoemulsification group |
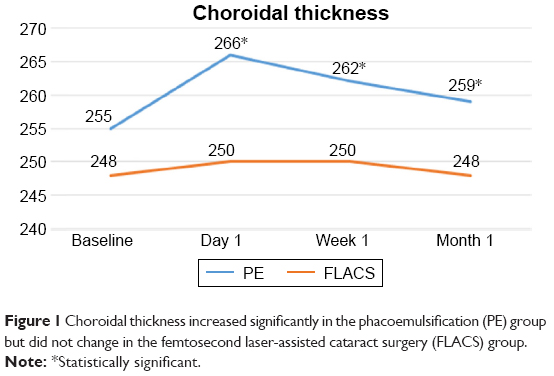 | Figure 1 Choroidal thickness increased significantly in the phacoemulsification (PE) group but did not change in the femtosecond laser-assisted cataract surgery (FLACS) group. |
Multiple regression analysis revealed that age, gender, spherical equivalent, axial length, anterior chamber depth, intraocular pressure, baseline CRT, and baseline CT were not predictors of significant choroidal thickening at day 1, week 1, or month 1 in the PE group (Table 5).
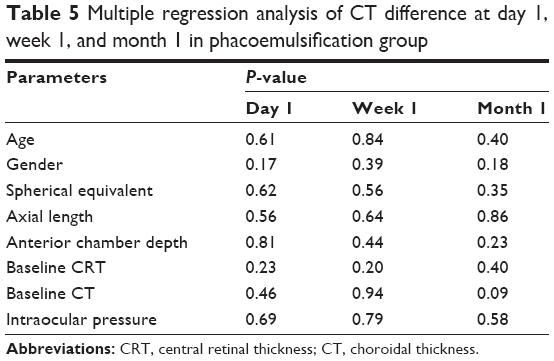 | Table 5 Multiple regression analysis of CT difference at day 1, week 1, and month 1 in phacoemulsification group |
Discussion
Proposed etiologic factors of PCME include inflammation, vitreous traction, and hypotony.17 Of these, the core mechanism is likely surgically induced anterior segment inflammation that results in the release of endogenous inflammatory mediators. A critical threshold of inflammatory mediators in the aqueous is likely required for detectable edema.
PCME is estimated to occur in 20%–30% of patients undergoing PE, based on fluorescein fundus angiography findings.3,18,19 OCT-based studies suggest that this rate ranges from 4% to 11%,20,21 but may be up to 41% in 6 weeks following surgery.4 Since the majority of these patients do not experience any visual disturbances,18 the term “clinical PCME” was coined, and is defined as symptomatic vision loss of 20/40 or worse, and is seen much less frequently with today’s surgical techniques, at a rate of ~0.1%–2.35%.22,23 However, macular thickness changes without the development of PCME have been reported in many studies.4,6–8
In the current study, CRT did not change in the PE group after surgery. Though most studies in the literature described a significant increase in CRT after standard PE surgery,4–6,8,13,14,21,24–26 the majority of these studies found no correlation between BCVA and the amount of thickness change. Yet, a few reports found an insignificant change in CRT after standard PE surgery.27 Some studies reported that the changes started early after PE surgery (within the first week)13,21,26 and progressively increased until the first month after PE surgery.6,8,21,26 Other studies reported a progressive increase in the macular thickness until 6–12 weeks after PE surgery.4,5,25
CRT did not differ postoperatively in the FLACS group in the current study. Ecsedy et al compared the effect of standard PE and FLACS on the macular thickness within the first month after surgery.13 They found a significantly higher macular thickness in the PE group 1 week after cataract surgery compared to the FLACS group, but this difference decreased and became only marginally significant 1 month after surgery.13 Similarly, Nagy et al described macular edema mainly in the outer nuclear layer in both the PE and FLACS groups, but the macular thickness was significantly less after FLACS.14
A recent study described an acute expression of pro-inflammatory genes and proteins in the neurosensory retina as well as in the choroid of mice undergoing lens extraction (with increased expression of IL-1β within the retina pigment epithelium/choroid of both operated eyes and fellow eyes compared with unoperated control eyes).28 This led investigators to search for a possible role of choroid in the inflammatory reaction after cataract surgery. The CT increased significantly 1 day, 1 week, and 1 month after PE surgery in the current study. This is in accordance to most relevant studies, which found an increase in CT after standard PE surgery.7–9 For instance, Ohsugi et al found an increase in CT, which continued 6 months after surgery and was negatively correlated with increased intraocular pressure and axial length.7 Pierru et al described an increase in CT starting 1 day after surgery and continuing until 3 months after surgery.8 They also found a negative correlation between CRT and increased age and increased axial length. Noda et al also found an increase in CRT after standard PE, which continued until 6 months after surgery with a larger increase in male patients and patients with a thicker baseline subfoveal CT.9 In contrast, Falçao et al described an insignificant change in CT after PE surgery in a smaller series.6 Regression analysis was also performed in the current study, but no correlation was found between age, gender, spherical equivalent, axial length, anterior chamber depth, intraocular pressure, baseline CRT, baseline CT, and changes in CT.
FLACS demonstrated somewhat better results over standard PE surgery regarding CRT, as described in this study and elsewhere.13,14 Yet, little is known about the effects of FLACS on CT; so it is believed that this rare study of its kind, which compares the results with standard PE surgery, sheds new light on the effects of FLACS. The fact that there was no change in CT 1 day, 1 week, and 1 month after FLACS may suggest that FLACS is also safe for subretinal tissues in the subfoveal area. Reducing surgically induced inflammation and trauma may decrease the incidence of PCME. Several studies have reported significant reductions in EPT using the femtosecond laser technique compared with the conventional technique.29,30 In the present study, the EPT was also statistically significantly lower in the FLACS group. However, results showed no correlation between EPT and the difference of CT in this study. The difference between postoperative CTs in FLACS and standard PE groups cannot be explained by EPT, although EPT was significantly different between FLACS and standard PE groups.
With lower EPT values, FLACS may offer more advantages than standard PE surgery in terms of postoperative retinal thickness and CT. Other surgical measures such as cumulative dissipated energy, ultrasound total time, and total time under microscope light and laser are needed for comparison with further studies.
This study has limitations that should be addressed. The sample size was small, representing results at a single center. Another weakness was the short follow-up period. Although most changes in CRT occur within the first month after surgery according to relevant studies in the literature, further follow-up might still be required to determine the effect of FLACS and standard ultrasound technique on retinal and choroidal tissues.
In conclusion, CT was more affected when using the standard PE technique rather than FLACS. The comparatively lower effect of FLACS on CT may be important to reduce the incidence of PCME. The small sample size is a serious limitation of this study. Especially, the observed power for CRT weakens the statistical power of the study. Prospective design with a bigger sample size is needed to find meaningful differences with respect to PCME. Although this may have no importance in standard patients, similar prospective trials are needed to assess the effects of the two methods on posterior segment structures, especially for those with comorbidities such as age-related macular degeneration (AMD) or uveitis in view of the recent publicity regarding a potential association between cataract surgery and late AMD.31–36
Acknowledgment
The Institutional Review Board of Van Education and Training Hospital approved this study (affirmation number: 2017/2).
Disclosure
The authors report no conflicts of interest in this work.
References
Yonekawa Y, Kim IK. Pseudophakic cystoid macular edema. Curr Opin Ophthalmol. 2012;23(1):26–32. | ||
Hudes GR, Li WY, Rockey JH, White P. Prostacyclin is the major prostaglandin synthesized by bovine retinal capillary pericytes in culture. Invest Ophthalmol Vis Sci. 1988;29(10):1511–1516. | ||
Guo S, Patel S, Baumrind B, et al. Management of pseudophakic cystoid macular edema. Surv Ophthalmol. 2015;60(2):123–137. | ||
Lobo CL, Faria PM, Soares MA, Bernardes RC, Cunha-Vaz JG. Macular alterations after small-incision cataract surgery. J Cataract Refract Surg. 2004;30(4):752–760. | ||
Cagini C, Fiore T, Iaccheri B, Piccinelli F, Ricci MA, Fruttini D. Macular thickness measured by optical coherence tomography in a healthy population before and after uncomplicated cataract phacoemulsification surgery. Curr Eye Res. 2009;34(12):1036–1041. | ||
Falcão MS, Gonçalves NM, Freitas-Costa P, et al. Choroidal and macular thickness changes induced by cataract surgery. Clin Ophthalmol. 2014;8:55–60. | ||
Ohsugi H, Ikuno Y, Ohara Z, et al. Changes in choroidal thickness after cataract surgery. J Cataract Refract Surg. 2014;40(2):184–191. | ||
Pierru A, Carles M, Gastaud P, Baillif S. Measurement of subfoveal choroidal thickness after cataract surgery in enhanced depth imaging optical coherence tomography. Invest Ophthalmol Vis Sci. 2014;55(8):4967–4974. | ||
Noda Y, Ogawa A, Toyama T, Ueta T. Long-term increase in subfoveal choroidal thickness after surgery for senile cataracts. Am J Ophthalmol. 2014;158(3):455–459. | ||
Nagy ZZ. New technology update: femtosecond laser in cataract surgery. Clin Ophthalmol. 2014;18(8):1157–1167. | ||
Palanker DV, Blumenkranz MS, Andersen D, et al. Femtosecond laser-assisted cataract surgery with integrated optical coherence tomography. Sci Transl Med. 2010;2(58):58–85. | ||
Conrad-Hengerer I, Hengerer FH, Schultz T, Dick HB. Effect of femtosecond laser fragmentation on effective phacoemulsification time in cataract surgery. J Refract Surg. 2012;28(12):879–883. | ||
Ecsedy M, Mihaltz K, Kovacs I, Takacs A, Filkorn T, Nagy ZZ. Effect of femtosecond laser cataract surgery on the macula. J Refract Surg. 2011;27(10):717–722. | ||
Nagy ZZ, Ecsedy M, Kovács I, et al. Macular morphology assessed by optical coherence tomography image segmentation after femtosecond laser-assisted and standard cataract surgery. J Cataract Refract Surg. 2012;38(6):941–946. | ||
Chylack LT Jr, Wolfe JK, Singer DM, et al. The Lens Opacities Classification System III. The Longitudinal Study of Cataract Study Group. Arch Ophthalmol. 1993;111(6):831–836. | ||
Yamashita T, Yamashita T, Shirasawa M, Arimura N, Terasaki H, Sakamoto T. Repeatability and reproducibility of subfoveal choroidal thickness in normal eyes of Japanese using different SD-OCT devices. Invest Ophthalmol Vis Sci. 2012;53(3):1102–1107. | ||
Wolter JR. The histopathology of cystoid macular edema. Albrecht Von Graefe’s Arch Klin Exp Ophthalmol. 1981;216:85–101. | ||
Ursell PG, Spalton DJ, Whitcup SM, Nussenblatt RB. Cystoid macular edema after phacoemulsification: relationship to blood–aqueous barrier damage and visual acuity. J Cataract Refract Surg. 1999;25(11):1492–1497. | ||
Gulkilik G, Kocabora S, Taskapili M, Engin G. Cystoid macular edema after phacoemulsification: risk factors and effect on visual acuity. Can J Ophthalmol. 2006;41(6):699–703. | ||
Belair ML, Kim SJ, Thorne JE, et al. Incidence of cystoid macular edema after cataract surgery in patients with and without uveitis using optical coherence tomography. Am J Ophthalmol. 2009;148(1):128–135. | ||
Perente I, Utine CA, Ozturker C, et al. Evaluation of macular changes after uncomplicated phacoemulsification surgery by optical coherence tomography. Curr Eye Res. 2007;32(3):241–247. | ||
Henderson BA, Kim JY, Ament CS, Ferrufino-Ponce ZK, Grabowska A, Cremers SL. Clinical pseudophakic cystoid macular edema. Risk factors for development and duration after treatment. J Cataract Refract Surg. 2007;33(9):1550–1558. | ||
Loewenstein A, Zur D. Postsurgical cystoid macular edema. Dev Ophthalmol. 2010;47:148–159. | ||
Capella MJ, Barraquer E. Estudio comparativo entre cirugía de catarata por microincisión coaxial y facoemulsificación estándar [Comparative study of coaxial microincision cataract surgery and standard phacoemulsification]. Arch Soc Esp Oftalmol. 2010;85(8):268–273. Spanish. | ||
Kusbeci T, Eryigit L, Yavas G, Inan UU. Evaluation of cystoid macular edema using optical coherence tomography and fundus fluorescein angiography after uncomplicated phacoemulsification surgery. Curr Eye Res. 2012;37(4):327–333. | ||
Sari ES, Ermis SS, Yazici A, Koytak A, Sahin G, Kilic A. The effect of intracameral anesthesia on macular thickness and ganglion cell-inner plexiform layer thickness after uneventful phacoemulsification surgery: prospective and randomized controlled trial. Graefes Arch Clin Exp Ophthalmol. 2014;252(3):433–439. | ||
Ghosh S, Roy I, Biswas PN, et al. Prospective randomized comparative study of macular thickness following phacoemulsification and manual small incision cataract surgery. Acta Ophthalmol. 2010;88(4):102–106. | ||
Xu H, Chen M, Forrester JV, Lois N. Cataract surgery induces retinal pro-inflammatory gene expression and protein secretion. Invest Ophthalmol Vis Sci. 2011;52(1):249–255. | ||
Nagy Z, Takacs A, Filkorn T, Sarayba M. Initial clinical evaluation of an intraocular femtosecond laser in cataract surgery. J Refract Surg. 2009;25(12):1053–1060. | ||
Abell RG, Kerr NM, Vote BJ. Toward zero effective phacoemulsification time using femtosecond laser pretreatment. Ophthalmology. 2013;120:942–948. | ||
Wang JJ, Fong CS, Rochtchina E, et al. Risk of age-related macular degeneration 3 years after cataract surgery: paired eye comparisons. Ophthalmology. 2012;119(11):2298–2303. | ||
Casparis H, Lindsley K, Kuo IC, Sikder S, Bressler NB. Surgery for cataracts in people with age-related macular degeneration. Cochrane Database Syst Rev. 2012;13(6):CD006757. | ||
Klein BE, Howard KP, Lee KE, Iyengar SK, Sivakumaran TA, Klein R. The relationship of cataract and cataract extraction to age-related macular degeneration: the Beaver Dam Eye Study. Ophthalmology. 2012;119(8):1628–1633. | ||
Cugati S, Mitchell P, Rochtchina E, Tan AG, Smith W, Wang JJ. Cataract surgery and the 10-year incidence of age-related maculopathy: the Blue Mountains Eye Study. Ophthalmology. 2006;113(11):2020–2025. | ||
Wang JJ, Klein R, Smith W, Klein BE, Tomany S, Mitchell P. Cataract surgery and the 5-year incidence of late-stage age-related maculopathy: pooled findings from the Beaver Dam and Blue Mountains eye studies. Ophthalmology. 2003;110(10):1960–1967. | ||
Chew EY, Sperduto RD, Milton RC, et al. Risk of advanced age-related macular degeneration after cataract surgery in the Age-Related Eye Disease Study: AREDS report 25. Ophthalmology. 2009;116(2):297–303. |
 © 2017 The Author(s). This work is published and licensed by Dove Medical Press Limited. The
full terms of this license are available at https://www.dovepress.com/terms
and incorporate the Creative Commons Attribution
- Non Commercial (unported, 3.0) License.
By accessing the work you hereby accept the Terms. Non-commercial uses of the work are permitted
without any further permission from Dove Medical Press Limited, provided the work is properly
attributed. For permission for commercial use of this work, please see paragraphs 4.2 and 5 of our Terms.
© 2017 The Author(s). This work is published and licensed by Dove Medical Press Limited. The
full terms of this license are available at https://www.dovepress.com/terms
and incorporate the Creative Commons Attribution
- Non Commercial (unported, 3.0) License.
By accessing the work you hereby accept the Terms. Non-commercial uses of the work are permitted
without any further permission from Dove Medical Press Limited, provided the work is properly
attributed. For permission for commercial use of this work, please see paragraphs 4.2 and 5 of our Terms.