Back to Journals » Diabetes, Metabolic Syndrome and Obesity » Volume 12
Resveratrol affects hepatic gluconeogenesis via histone deacetylase 4
Authors Zhao H, Shu L ![]() , Huang W, Song G, Ma H
, Huang W, Song G, Ma H
Received 19 December 2018
Accepted for publication 7 February 2019
Published 25 March 2019 Volume 2019:12 Pages 401—411
DOI https://doi.org/10.2147/DMSO.S198830
Checked for plagiarism Yes
Review by Single anonymous peer review
Peer reviewer comments 3
Editor who approved publication: Professor Ming-Hui Zou
Hang Zhao,1,2 Linyi Shu,1,2 Wenli Huang,1,2 Guangyao Song,1,2 Huijuan Ma1–3
1Department of Internal Medicine, Hebei Medical University, Shijiazhuang, Hebei 050017, China; 2Endocrinology Department, Hebei General Hospital, Shijiazhuang, Hebei 050051, China; 3Hebei Key Laboratory of Metabolic Diseases, Hebei General Hospital, Shijiazhuang, Hebei 050051, China
Purpose: The aim of this study was to determine whether resveratrol (Rev) affects the expression, phosphorylation, and nuclear and cytoplasmic distribution of histone deacetylase 4 (HDAC4), which in turn affects gluconeogenesis in hepatocytes under an insulin-resistant state.
Materials and methods: HepG2 cells were treated with 0.25 mmol/L palmitic acid (PA) to establish an insulin resistance model. The cells were divided into five groups: control, PA, PA + Rev 100 µM, PA + Rev 50 µM, and PA + Rev 20 µM. After treatment for 24 hours, mRNA and protein expression levels of gluconeogenesis pathway-related molecules and HDAC4 were examined. Next, HepG2 cells were transfected with siRNA-HDAC4. The cells were divided into control, PA, PA + Rev 20 µM, PA + Rev 20 µM + siRNA-HDAC4 negative control, and PA + Rev 20 µM + siRNA-HDAC4 knockdown groups to determine the expression of gluconeogenesis pathway proteins.
Results: Compared with the control group, the gluconeogenesis pathway-related molecules, glucose-6-phosphatase catalytic subunit (G6PC), phosphoenolpyruvate carboxykinase 1 (PCK1) and forkhead box protein O1 (FOXO1), were increased, and the phosphorylation of FOXO1 decreased after PA treatment. The p-HDAC4 level decreased with the increase in HDAC4 in the nucleus and the decrease in HDAC4 in the cytoplasm in the PA group. Treatment with Rev 20 µM suppressed gluconeogenesis and promoted HDAC4 shuttling into the cytoplasm from the nucleus. However, 100 and Rev 50 µM exerted the opposite effects. Finally, after HDAC4 knockdown, the expression levels of the key gluconeogenesis molecules, G6PC, PCK1, and FOXO1, were increased, and p-FOXO1 was decreased, indicating that gluconeogenesis was enhanced.
Conclusion: A low concentration of Rev inhibited gluconeogenesis under insulin-resistance conditions via translocation of HDAC4 from the nucleus to the cytoplasm.
Keywords: insulin resistance, histone deacetylase, gluconeogenesis, resveratrol
Introduction
Type 2 diabetes is a major burden on public health worldwide, and its incidence has increased rapidly over the past few decades. In 2013, 382 million people worldwide suffered from diabetes, and it is estimated that the number of patients will rise to 592 million by 2035.1 Insulin resistance is the central process in the pathogenesis of type 2 diabetes. The liver, as the main organ of glucose metabolism, is responsible for gluconeogenesis. Increased hepatic glucose output caused by hepatic gluconeogenesis disorder is a major cause of insulin resistance in the liver. Therefore, reducing hepatic glucose production may provide broad prospects for the treatment of hepatic insulin resistance and new drug development. Patients who take long-term medications have poor compliance, and the drugs have some side effects. Thus, the control level of diabetes or insulin resistance is low. Therefore, ingredients in our diet that control blood glucose and improve insulin sensitivity are of interest to many researchers.
Resveratrol (3,4′,5-trihydroxyindole) is a polyphenolic phytoalexin found in grape skin, peanuts, soybeans, pomegranates, and other fruits and plants. In vivo and in vitro studies have confirmed that resveratrol is a potent activator of Sirt1,2,3 which is a key molecule in the energy metabolism pathway that mediates the use of nutrients.4 As a member of class II histone deacetylases (HDACs), HDAC4 is highly expressed in the liver, brain, and bone. In addition to deacetylation, its N-terminal domain undergoes reversible phosphorylation, thereby controlling the nuclear and cytoplasmic distribution of HDAC4, which regulates transcriptional inhibition. HDAC4 and Sirt1 are both histone deacetylases, and it is unknown whether resveratrol affects the expression of HDAC4 or its phosphorylation, which in turn affects gluconeogenesis in hepatocytes. To clarify this question, we established an in vitro insulin resistance model in HepG2 cells. We investigated the changes in HDAC4 protein expression and its cellular distribution after resveratrol treatment, and whether resveratrol affects gluconeogenesis.
Materials and methods
Cell culture
The human liver tumor cell line HepG2 was purchased from the National Infrastructure of Cell Line Resource of China and maintained at the Clinical Medical Research Center of Hebei Provincial People’s Hospital. HepG2 cells were cultured in minimum essential medium (MEM) (HyClone, Logan UT, USA) with 10% FBS (HyClone), 1% nonessential amino acids (Thermo Fisher Scientific, Waltham, MA, USA), and 1% streptomycin (HyClone).
Establishment of an insulin resistance model
Glucose concentration determination
We used palmitic acid (PA) to establish an insulin resistance model as described previously.5 A PA (Sigma-Aldrich Co., St Louis, MO, USA) stock solution (0.1 mol/L) was prepared in absolute ethanol, and a 10% BSA stock solution was prepared with pure water (note: BSA was used to deliver PA to the cells). BSA and PA were formulated at a ratio of 9:1 by volume to prepare the working PA solution. HepG2 cells were treated with serum-free medium containing 0.25 mmol/L of PA. The glucose concentration in the medium was determined by a glucose oxidase assay kit (Applygen, Beijing, China) at 0, 12, and 24 hours of treatment to evaluate establishment of the insulin resistance model.
Expression of the insulin signaling pathway molecule, AKT/p-AKT
The insulin stock solution was prepared in a volume ratio of 1:49 of insulin (10 mg/mL; Sigma-Aldrich Co.) and MEM medium. After incubating HepG2 cells in a six-well plate with PA for 24 hours, 5.7 µL of insulin stock solution was added (final concentration: 100 nmol/L), and then protein was extracted 40 minutes later. The expression of the insulin signal transduction molecule, AKT, and its phosphorylated form was determined by Western blot analysis to further evaluate the hepatocyte insulin resistance.
Cytotoxicity assessment of resveratrol
Resveratrol (Sigma-Aldrich Co.) was dissolved in dimethyl sulfoxide (Sigma-Aldrich Co.) at a concentration of 50 mmol/L, and then diluted to various concentrations in medium (100, 50, and 20 µM). HepG2 cells were cultured in a 96-well plate. At ~80% confluence, cells were treated with various concentrations of resveratrol. The cell survival rate was determined by a Cell Counting Kit (Dojindo, Kumamoto, Japan) according to the manufacturer’s instructions.
Effects of resveratrol on the gluconeogenesis pathway and HDAC4 expression
Cell treatment
The cells were divided into five groups: control (Con), PA, PA + 100 µM resveratrol (PA + Rev 100 µM), PA + 50 µM resveratrol (PA + Rev 50 µM), and PA + 20 µM resveratrol (PA + Rev 20 µM). The different treatments were applied for 24 hours.
Cytotoxicity assessment
The cell survival rates of the five groups were determined by a Cell Counting Kit as described earlier.
Improvement of insulin sensitivity of HepG2 cells
The glucose concentration in the medium at various time points (0, 12, and 24 hours) after treatment was determined by a glucose oxidase assay kit as described earlier.
Real-time reverse transcription-PCR (RT-PCR)
RNA was extracted with TRIzol reagent (Thermo Fisher Scientific), and a NanoDrop 2000 (Thermo Fisher Scientific) was used to determine the RNA concentration and purity. Reverse transcription of RNA into cDNA was performed using a PrimeScript™ RT reagent kit with gDNA Eraser (RR047A). Amplification was performed using a SYBR® Premix Ex Taq™ II kit (RR820A) with an ABI 7300 Real-Time PCR System (Thermo Fisher Scientific). The PCR conditions were: 95°C for 3 minutes, followed by 41 cycles at 95°C for 30 seconds, 95°C for 5 seconds, and 60°C for 31 seconds. Gene expression levels were normalized to GAPDH expression using the 2−ΔΔ Cq method.6 The primer sequences used are presented in Table 1.
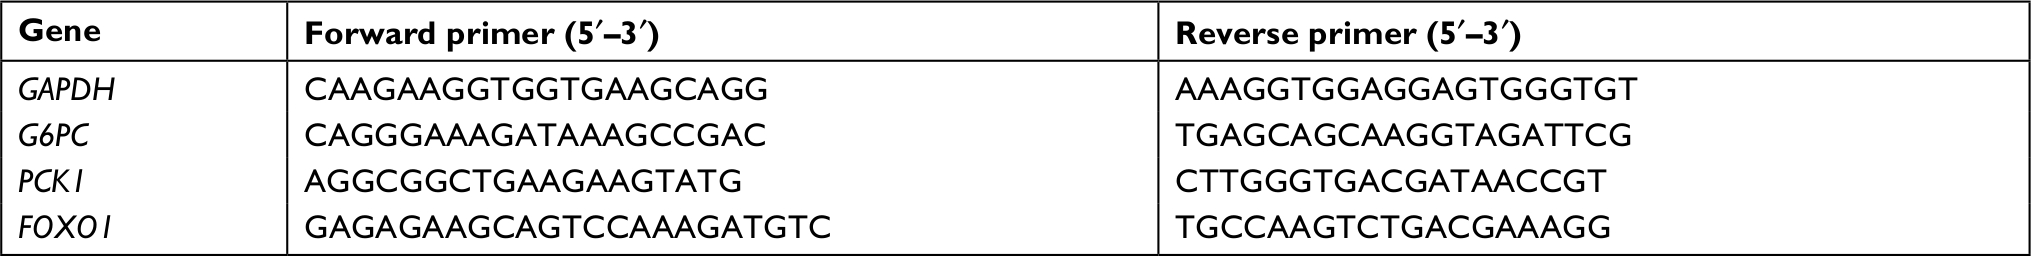 | Table 1 Primer sequences used in RT-PCR Abbreviation: RT-PCR, real-time reverse transcription PCR. |
Western blot analysis
Total protein was extracted from cells by RIPA lysis buffer. The protein concentration was determined by a Pierce™ BCA Protein Assay Kit (Thermo Fisher Scientific). Protein samples were resolved by SDS-PAGE. The separated proteins were then transferred to a polyvinylidenefluoride membrane that was blocked with 5% dry skim milk for 2 hours. The primary antibodies were diluted to the appropriate concentration in the blocking solution. The membrane was incubated with the antibody overnight at 4°C. After washing, a horseradish peroxidase (HRP)-labeled antibody was incubated with the membrane for ~50 minutes at room temperature. The membrane was washed after incubations. The band was detected with enhanced chemiluminescent reagent (Thermo Fisher Scientific) under a gel imager. In addition, nuclear and cytoplasmic proteins of HepG2 cells were extracted using a nuclear and cytoplasmic protein extraction kit (Sangon Biotech, Shanghai, China). Western blotting of the fractions was performed as described earlier. The intensity of the protein bands was quantified by densitometry using Image-J software. Normalization was performed by incubating the same membrane with an antibody against β-actin or histone H3. The antibody-related information is as follows. Anti-β-actin: mouse antibody, 1:3,000 (3700s; CST); anti-AKT: rabbit antibody, 1:1,000 (9272s; CST); anti-p-AKT (Ser473): rabbit antibody, 1:3,000 (4058s; CST); anti-Histone H3, rabbit antibody, 1:4,000 (4499s; CST); anti-G6PC: rabbit antibody, 1:2,000 (22169–1-AP; Proteintech); anti-PCK1: rabbit antibody, 1:1,000 (16754–1-AP; Proteintech); anti-FOXO1: rabbit antibody, 1:1,000 (18592–1-AP; Proteintech); anti-p-FOXO1 (p-Ser256): rabbit antibody, 1:1,000 (1339; Abcam); anti-HDAC4: rabbit antibody, 1:1,000 (17449–1-AP; Proteintech), and anti-p-HDAC4 (p-Ser246): rabbit antibody, 1:1,000 (3443s; CST). A HRP-labeled goat anti-rabbit IgG antibody (1:8,000) and goat anti-mouse IgG antibody (1:3,000) were purchased from Signalway Antibody (Pearland, TX, USA).
Effect of resveratrol on the gluconeogenesis pathway after HDAC4 knockdown
Preparation of the transfection complex
Cell transfection was performed at ~60% confluence. DEPC water (125 µL) was added to the siRNA (GenePharma, Shanghai, China) to prepare an RNA oligo stock solution of 20 µM, which was stored at −20°C. Then, 200 µL of Opti-MEM (Thermo Fisher Scientific), 5 µL of RNA oligo stock solution, and 10 µL of siRNA-Mate transfection reagent (GenePharma) were used to prepare the transfection complex.
Transfection efficiency
The cells were divided into two groups: siRNA-HDAC4 negative control (NC) and siRNA-HDAC4 knockdown (knockdown). The groups were treated with 200 µL of transfection complex in 1.8 mL of medium per well, and the final siRNA concentration was ~50 nM. The cells were cultured at 37°C for 24 hours. RNA was then extracted and the knockdown efficiency of HDAC4 was detected by RT-PCR. Protein was extracted after knockdown for 48 hours and HDAC4 expression was determined by Western blot analysis.
Transfection grouping
HepG2 cells were seeded in six-well plates and divided into a control group (Con), PA group (PA), PA + Rev 20 µM group (Rev), PA + Rev 20 µM + siRNA-HDAC4 negative control group (siRNA-NC), and PA + Rev 20 µM + siRNA-HDAC4 knockdown group (siRNA-HDAC4). The transfections were performed as described earlier.
Glucose concentration after HDAC4 knockdown
After transfection for 24 hours, PA and resveratrol were added, and the glucose concentration was determined after another 24 hours.
Gluconeogenesis pathway-related protein expression after HDAC4 knockdown
After siRNA transfection for 24 hours, PA and resveratrol were added to the corresponding groups for 24 hours, and then protein was extracted for Western blotting.
Statistical analyses
All data were processed using SPSS 22.0 software. Results are expressed as the mean ± SD. Two sample comparisons of data that satisfied the normal distribution were performed using Student’s t-test. Multiple comparisons were performed by one-way ANOVA, unless a nonparametric test was needed. P<0.05 was considered statistically significant.
Results
Establishment of an insulin resistance model in HepG2 cells
Glucose concentration in the medium
At 0 and 12 hours of PA treatment, there were no significant differences in the glucose concentrations in the culture medium between the Con and PA groups. At 24 hours, the glucose concentration in the medium of the PA group was significantly higher than that in the medium of the Con group, indicating that as PA induced insulin resistance, more gluconeogenesis occurred in these cells, and more glucose was released into the media.7 Therefore, we concluded that the insulin resistance model was successfully established (Figure 1A).
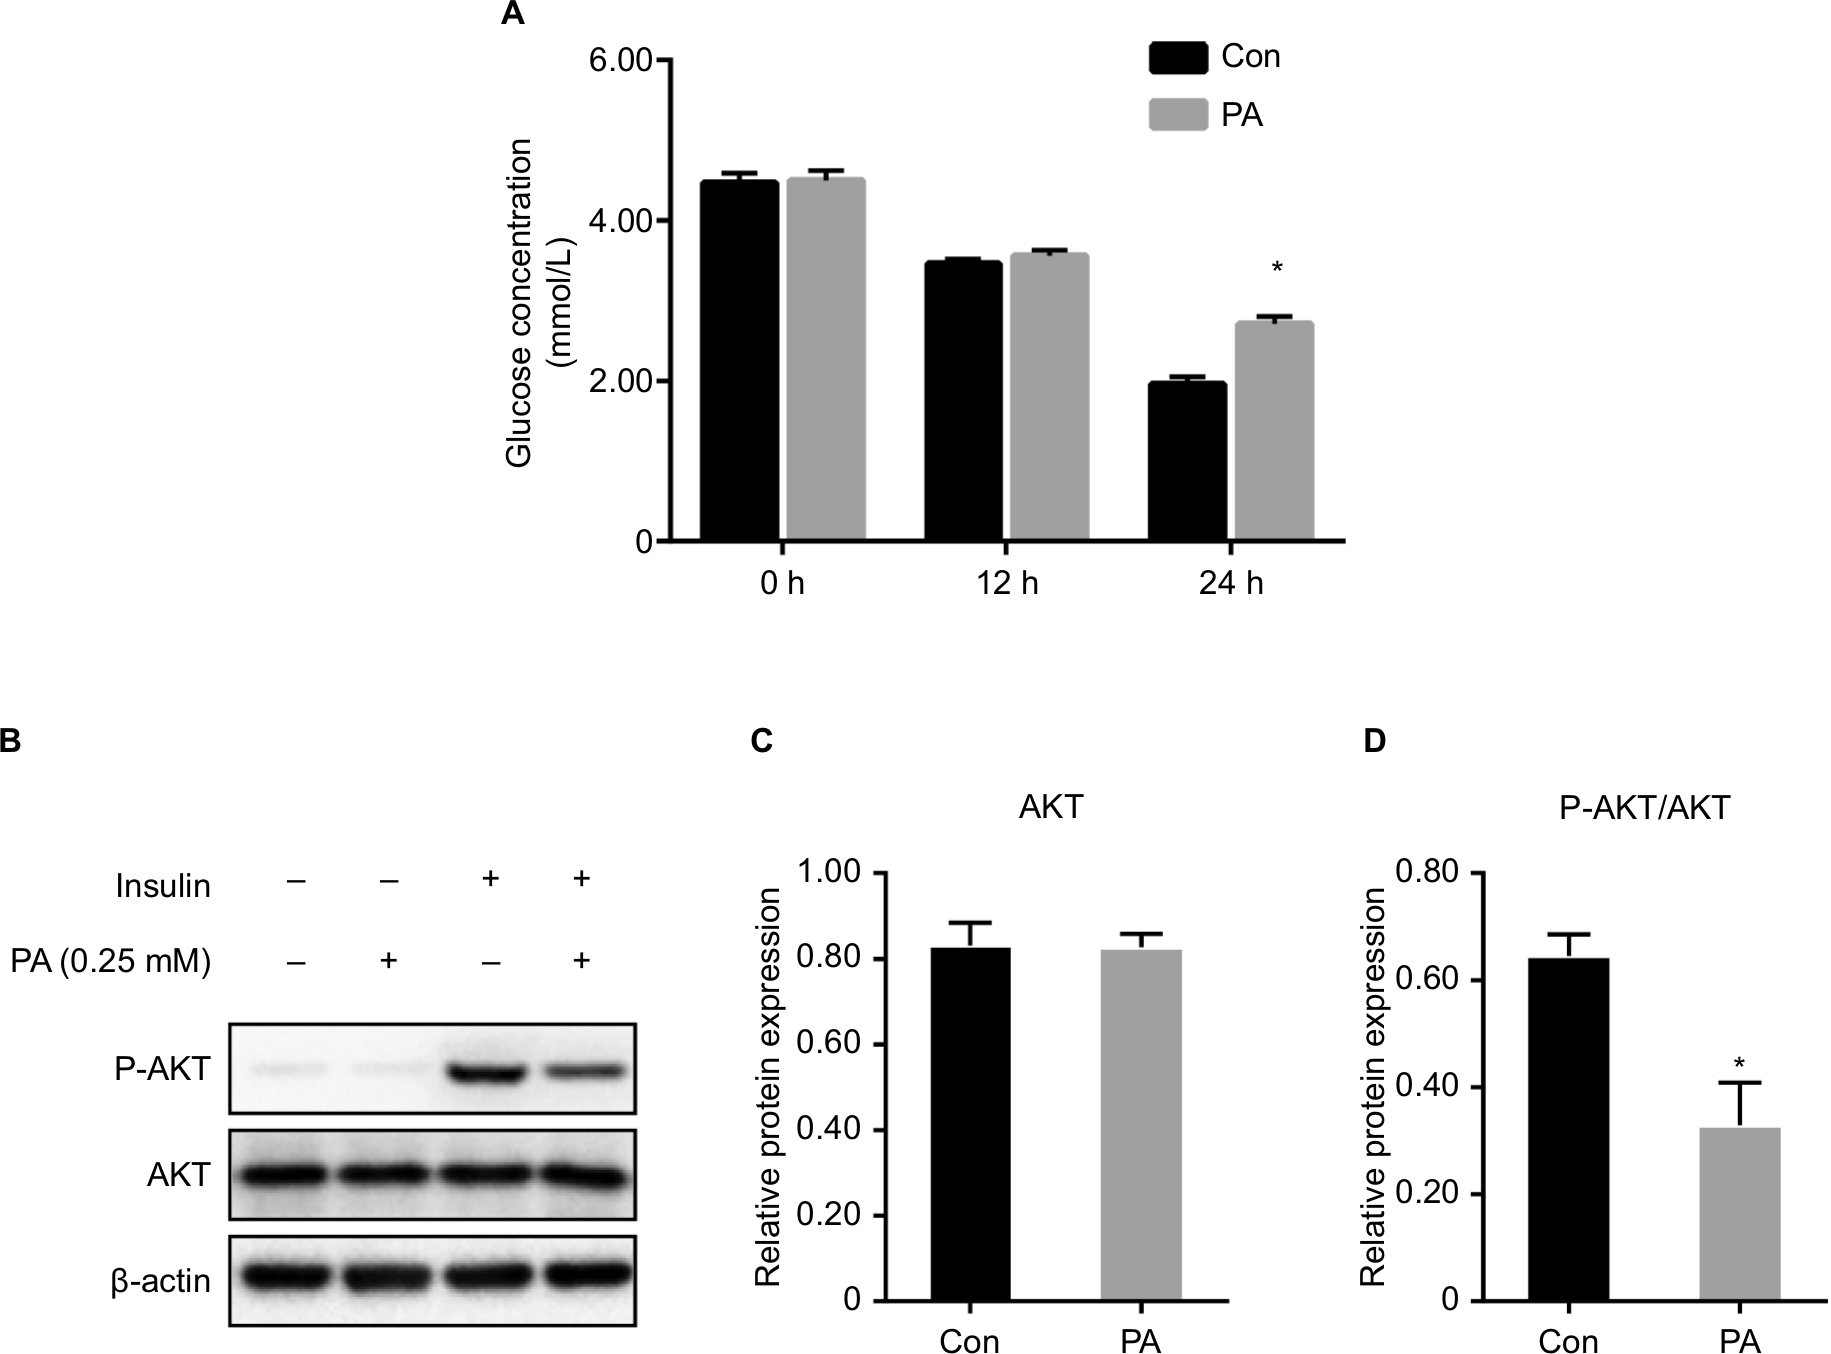 | Figure 1 Establishment of insulin resistance in vitro. Notes: (A) Glucose concentration in the culture medium after PA treatment for 0, 12, and 24 hours. Data are presented as the mean ± SD (n=6). (B–D) Expression of the insulin signaling pathway molecule, AKT/p-AKT. (B) Protein bands. (C) Densitometric analysis of protein expression of AKT. (D) Densitometric analysis of protein expression of p-AKT. Data are presented as the mean ± SD (n=3). *P<0.05 vs Con. Abbreviations: AKT, protein kinase B; Con, control group; PA, palmitic acid group. |
AKT and p-AKT expression
There was no significant difference in the total AKT between the Con group and the PA group. Compared with the Con group, the p-AKT level in the PA group was significantly decreased, indicating that the insulin signaling pathway was impaired after PA intervention and the hepatocyte insulin resistance model was successfully established (Figure 1B–D).
Cell survival rate
Cell survival rate after treatment with various concentrations of resveratrol
The survival rate of the Con group was 92.05%. After treatment with 100, 50, or 20 µM resveratrol for 24 hours, the survival rates were 57.91%, 69.44%, and 88.63%, respectively. These results suggest that high concentrations of resveratrol are toxic for the cells (Figure 2A).
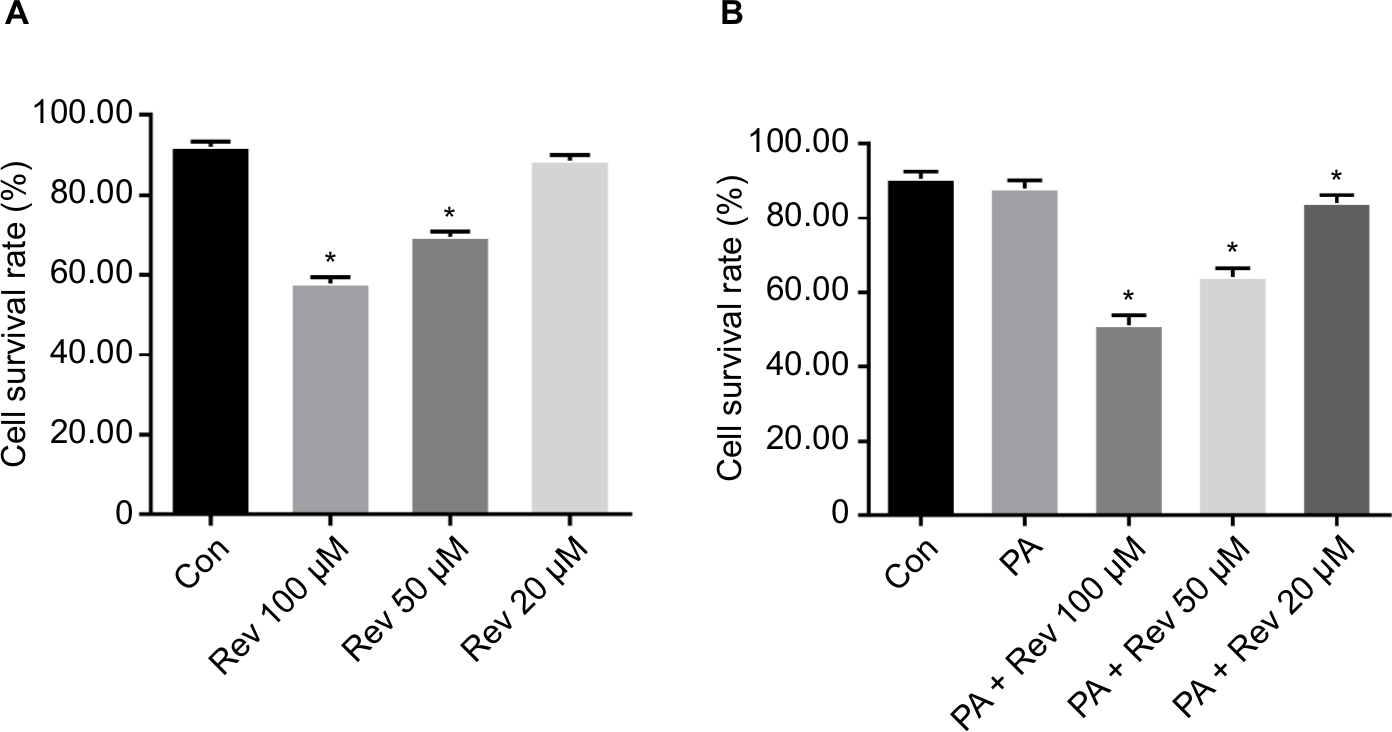 | Figure 2 Cell survival rates. Notes: (A) Cell survival rates after treatment with various concentrations of resveratrol. (B) Cell survival rates of the different groups. Data are presented as the mean ± SD (n=6). *P<0.05 vs Con. Abbreviations: Con, control group; PA, palmitic acid group; PA + Rev 100 µM, palmitic acid + resveratrol 100 µM group; PA + Rev 50 µM, palmitic acid + resveratrol 50 µM group; PA + Rev 20 µM, palmitic acid+ resveratrol 20 µM group. |
Cell survival rate of the different treatment groups
The cell survival rate of the PA group was lower than that of the Con group, though there was no statistical difference. After treatment with PA combined with different resveratrol concentrations, the survival rate of the PA + 100 µM, PA + 50 µM, and PA + 20 µM groups was significantly lower than that of the PA group. However, the difference between the Con group and the PA + 20 µM group was smaller than that between the other two groups and the Con group (Figure 2B).
Effect of resveratrol on the gluconeogenesis pathway
Improvement of insulin resistance in HepG2 cells
There was no significant difference in the glucose concentration between the groups at 0 and 12 hours. However, the glucose concentration in the PA group was significantly higher than that in the Con group at 24 hours. Interestingly, high concentrations of resveratrol (100 and 50 µM) increased the glucose concentration, whereas a low resveratrol concentration (20 µM) reduced the glucose level (Figure 3A).
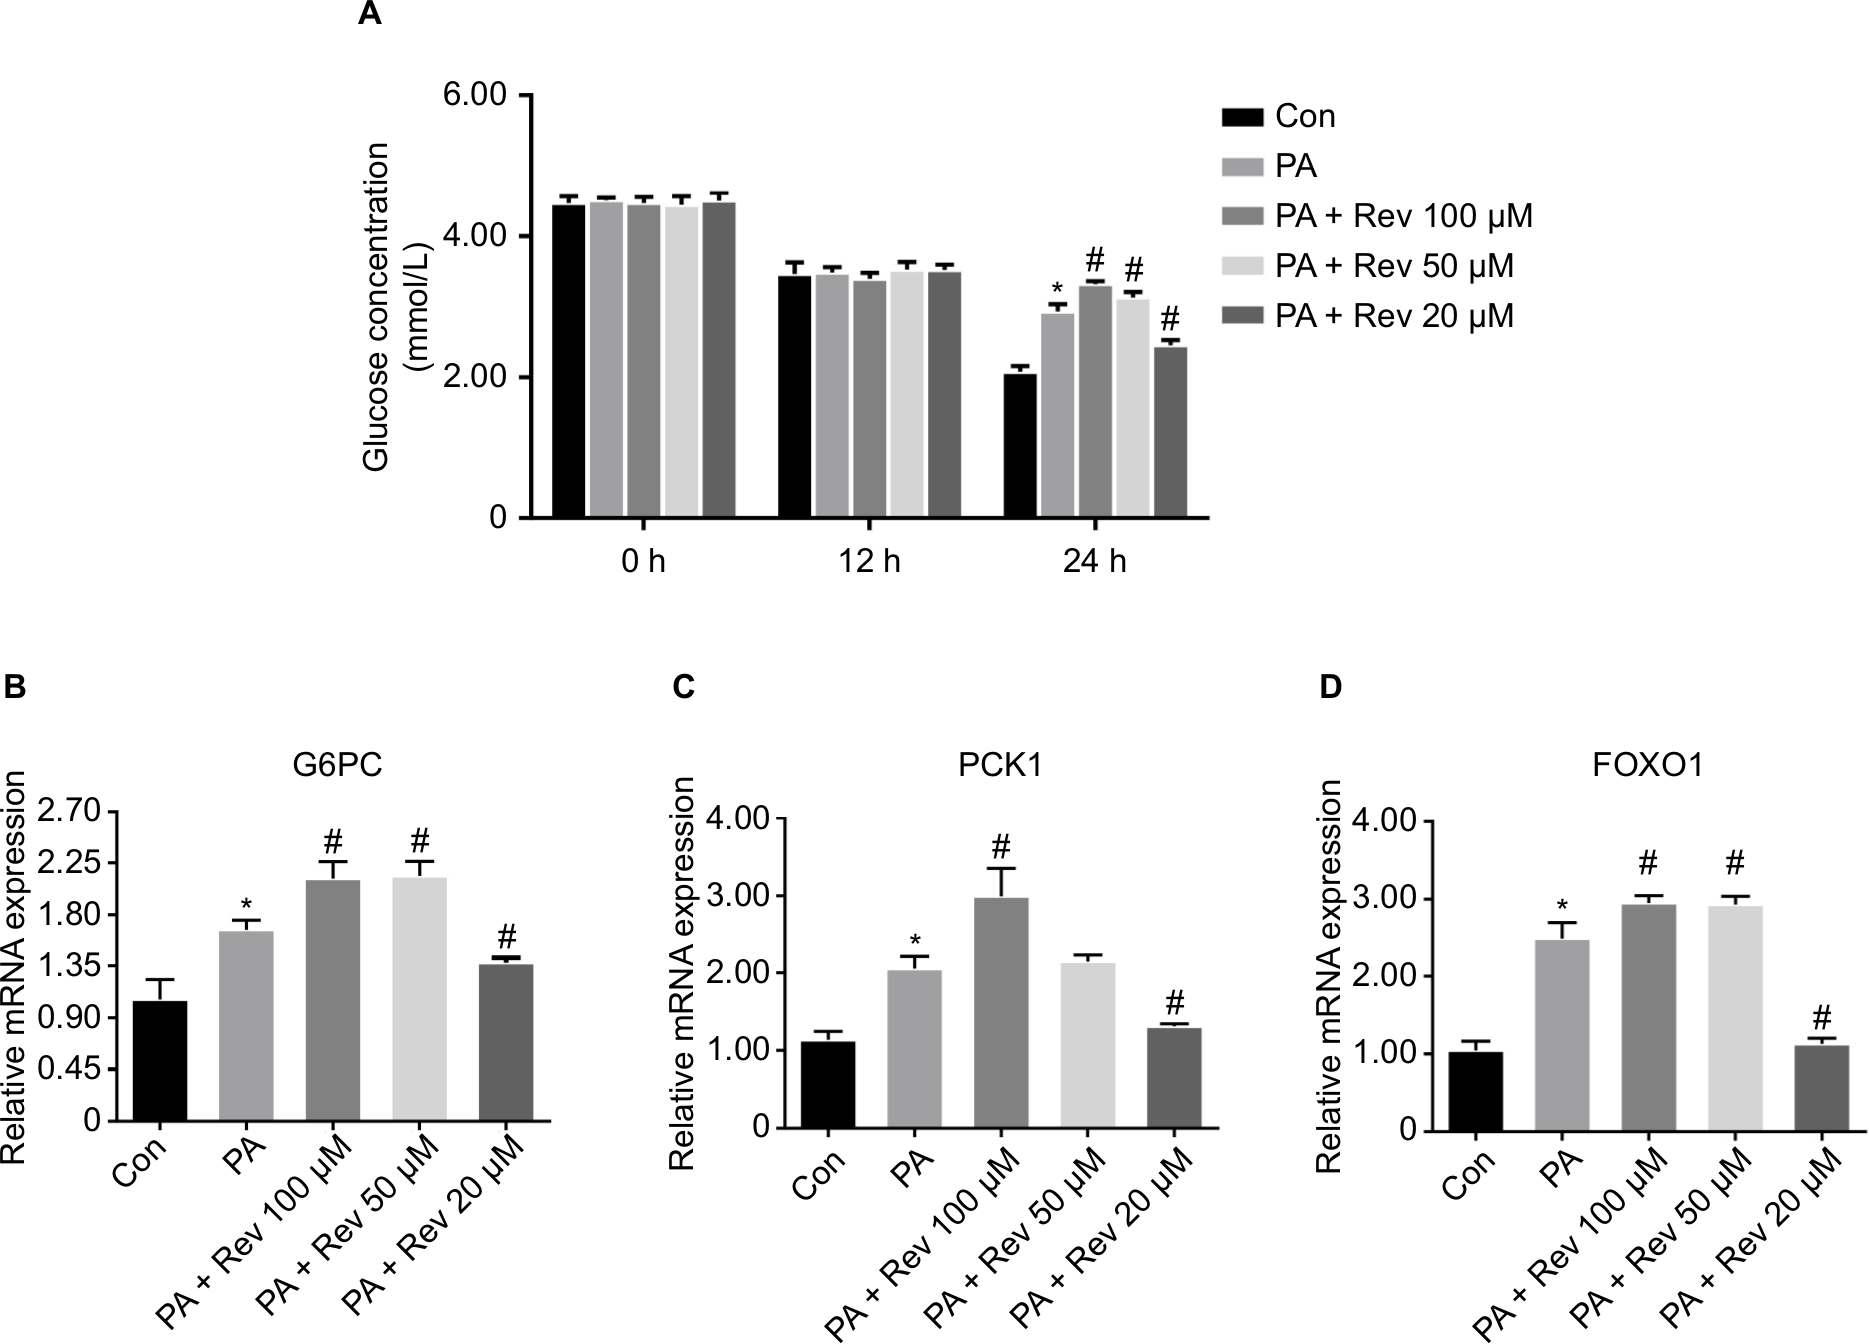 | Figure 3 Improvement of insulin sensitivity and relative mRNA expression of gluconeogenesis pathway-related genes in HepG2 cells. Notes: (A) Glucose concentrations in HepG2 cells after PA and resveratrol treatments. Data are presented as the mean ± SD (n=4). (B–D) mRNA expression of gluconeogenesis pathway molecules: (B) G6PC, (C) PCK1, and (D) FOXO1. Data are presented as the mean ± SD (n=8). *P<0.05 vs Con, #P<0.05 vs PA. Abbreviations: G6PC, glucose-6-phosphatase catalytic subunit; PCK1, phosphoenolpyruvate carboxykinase 1; FOXO1, forkhead box protein O1; Con, control group; PA, palmitic acid group; PA + Rev 100 µM, palmitic acid + resveratrol 100 µM group; PA + Rev 50 µM, palmitic acid + resveratrol 50 µM group; PA + Rev 20 µM, palmitic acid + resveratrol 20 µM group. |
Relative mRNA expression of gluconeogenesis-related genes
Compared with the Con group, the mRNA expression of glucose-6-phosphatase catalytic subunit (G6PC), phosphoenolpyruvate carboxykinase 1 (PCK1), and forkhead box protein O1 (FOXO1) in the PA group was significantly higher. The mRNA levels of the same genes were further increased in the Rev 100 µM group, but decreased in the Rev 20 µM group compared with the PA group. The Rev 50 µM group showed a trend similar to that of the Rev 100 µM group (Figure 3B–D).
Relative protein expression of gluconeogenesis pathway molecules
G6PC, PCK1, and FOXO1 protein levels were higher in the PA group than in the Con group, and the FOXO1 phosphorylation level was significantly lower in the PA group than in the Con group. These results indicated that gluconeogenesis was enhanced in the insulin-resistant state. With a high resveratrol concentration, the protein levels of G6PC, PCK1, and FOXO1 were increased, and the expression level of p-FOXO1 (Ser 256) was decreased. However, after treatment with 20 µM resveratrol, G6PC, PCK1, and FOXO1 were decreased and p-FOXO1 (Ser 256) was increased. These results suggest that at a low concentration resveratrol suppressed gluconeogenesis (Figure 4).
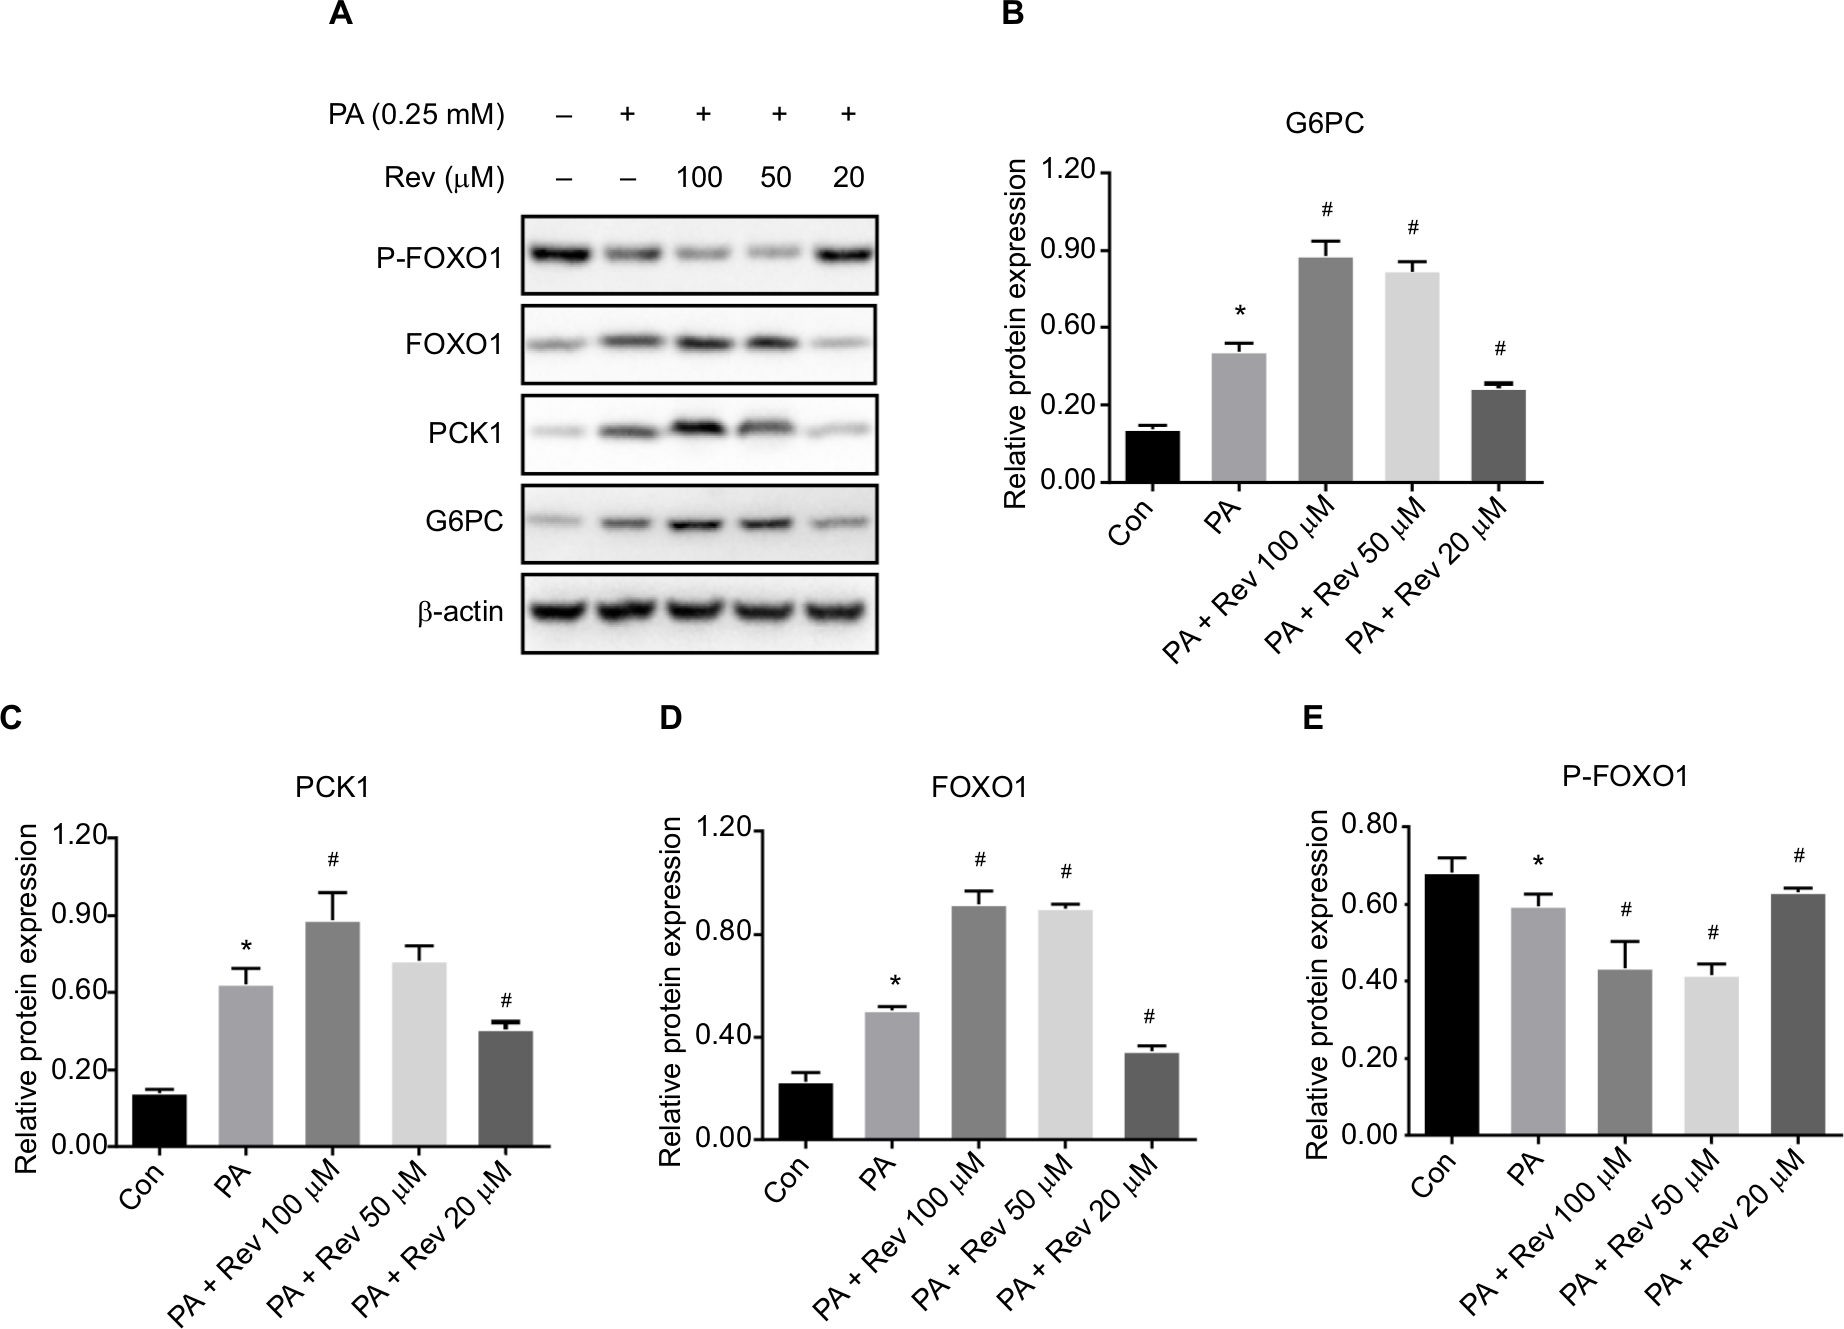 | Figure 4 Expression of gluconeogenesis pathway-related proteins. Notes: (A) Protein bands of gluconeogenesis pathway molecules. (B–E) Densitometric analysis of protein expression: (B) G6PC, (C) PCK1, (D) FOXO1, and (E) P-FOXO1. Data are presented as the mean ± SD (n=3). *P<0.05 vs Con, #P<0.05 vs PA. Abbreviations: G6PC, glucose-6-phosphatase catalytic subunit; PCK1, phosphoenolpyruvate carboxykinase 1; FOXO1, forkhead box protein O1; Con, control group; PA, palmitic acid group; PA + Rev 100 µM, palmitic acid + resveratrol 100 µM group; PA + Rev 50 µM, palmitic acid + resveratrol 50 µM group; PA + Rev 20 µM, palmitic acid + resveratrol 20 µM group. |
Effect of resveratrol on HDAC4 nucleus-cytoplasm shuttling
HDAC4 phosphorylation was significantly lower after PA treatment for 24 hours compared with the control treatment. Resveratrol treatment at 100 µM further reduced the p-HDAC4 level, but 20 µM resveratrol increased its level. The total HDAC4 level was increased in the nucleus and decreased in the cytoplasm of the PA group, compared with the Con group. After 100 µM resveratrol treatment, this trend was enhanced. However, treatment with 20 µM resveratrol resulted in the opposite effects. The Rev 50 µM group showed a similar trend to the Rev 100 µM group (Figure 5).
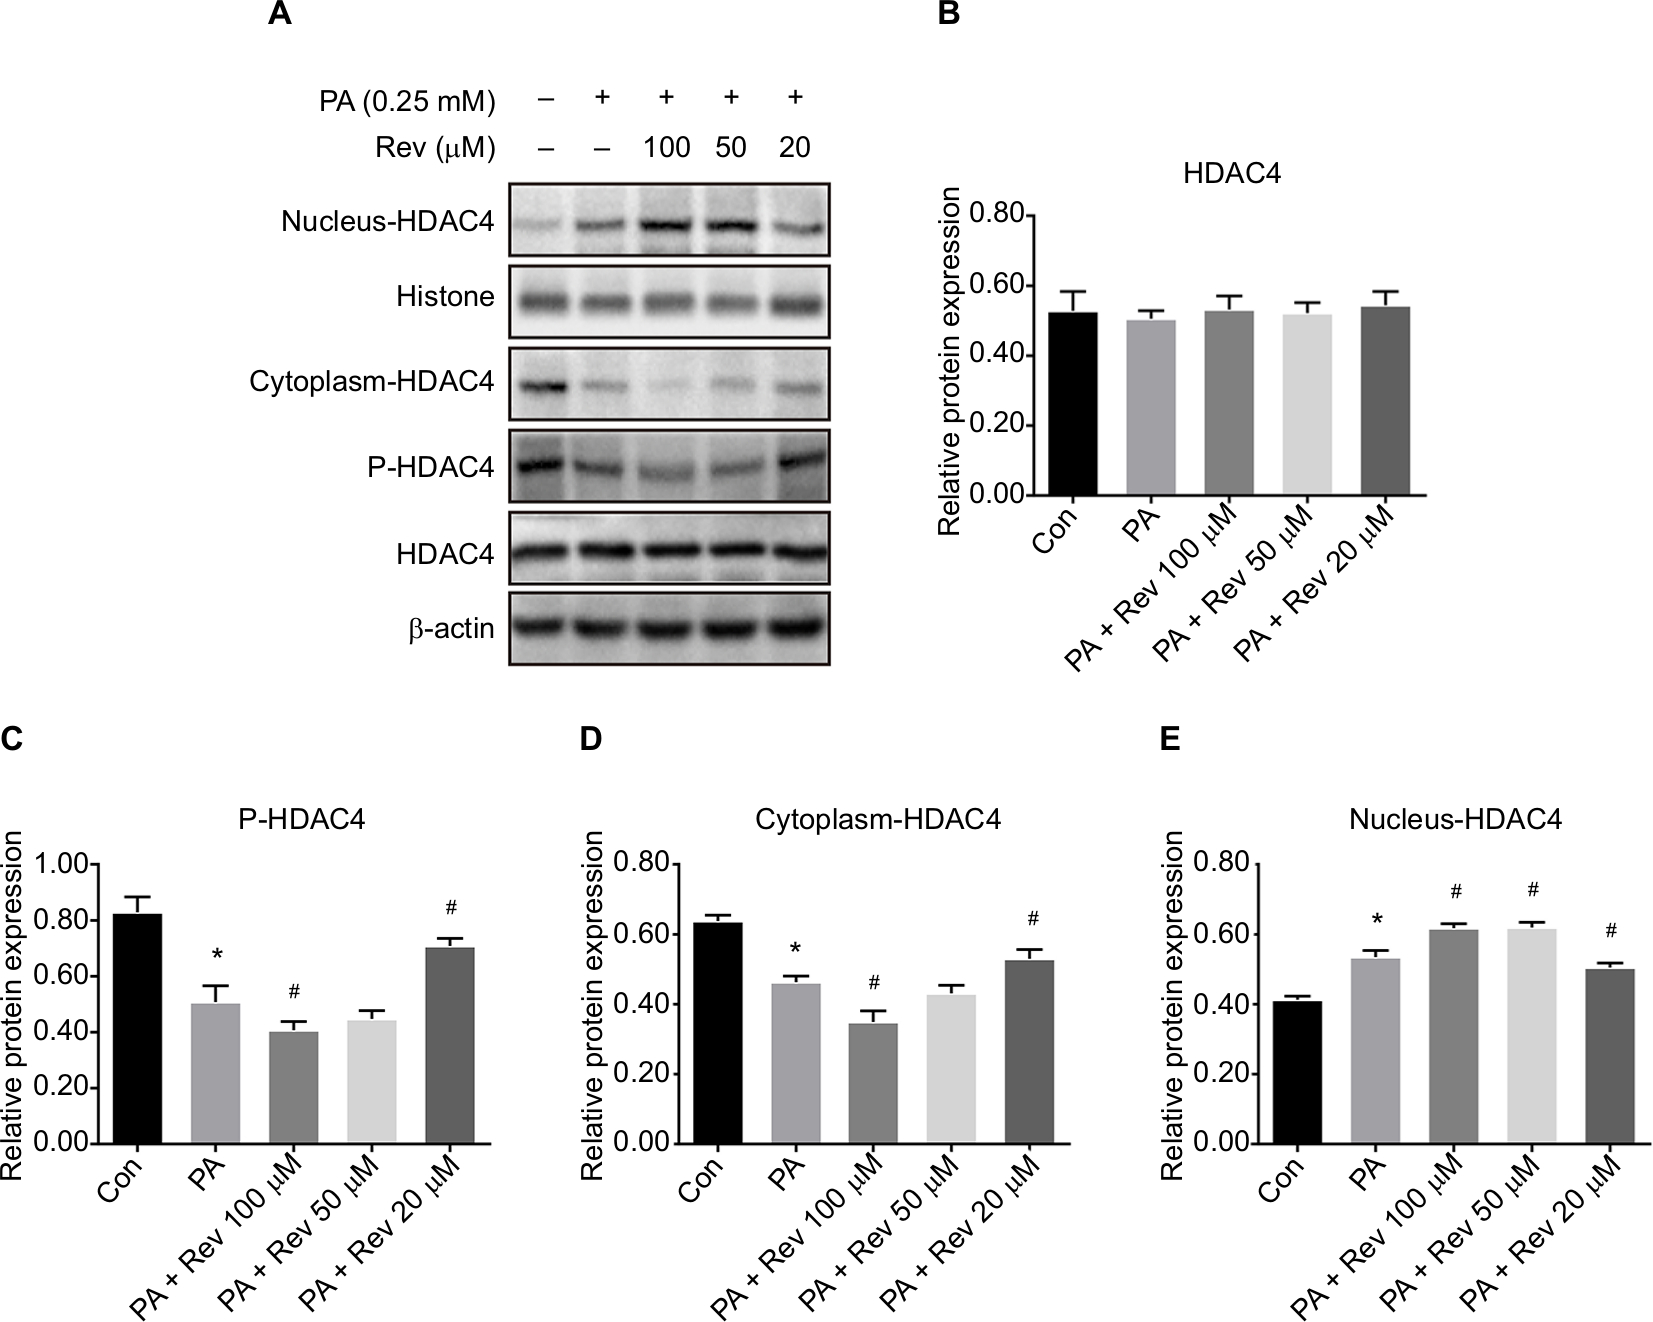 | Figure 5 HDAC4 nucleus–cytoplasm translocation after resveratrol treatment. Notes: (A) Protein bands about HDAC4. (B–E) Densitometric analysis of protein expression: (B) HDAC4, (C) p-HDAC4 (Ser 246), (D) HDAC4 in the nucleus, and (E) HDAC4 in the cytoplasm. Data are presented as the mean ± SD (n=3). *P<0.05 vs Con, #P<0.05 vs PA. Abbreviations: HDAC4, histone deacetylase 4; Con, control group; PA, palmitic acid group; PA + Rev 100 µM, palmitic acid + resveratrol 100 µM group; PA + Rev 50 µM, palmitic acid + resveratrol 50 µM group; PA + Rev 20 µM, palmitic acid + resveratrol 20 µM group. |
Effect of resveratrol on the gluconeogenesis pathway after HDAC4 knockdown
Transfection efficiency
Compared with the negative control group, the relative mRNA and protein level of HDAC4 was significantly decreased in the siRNA-HDAC4 knockdown group, indicating a high transfection efficiency (Figure 6).
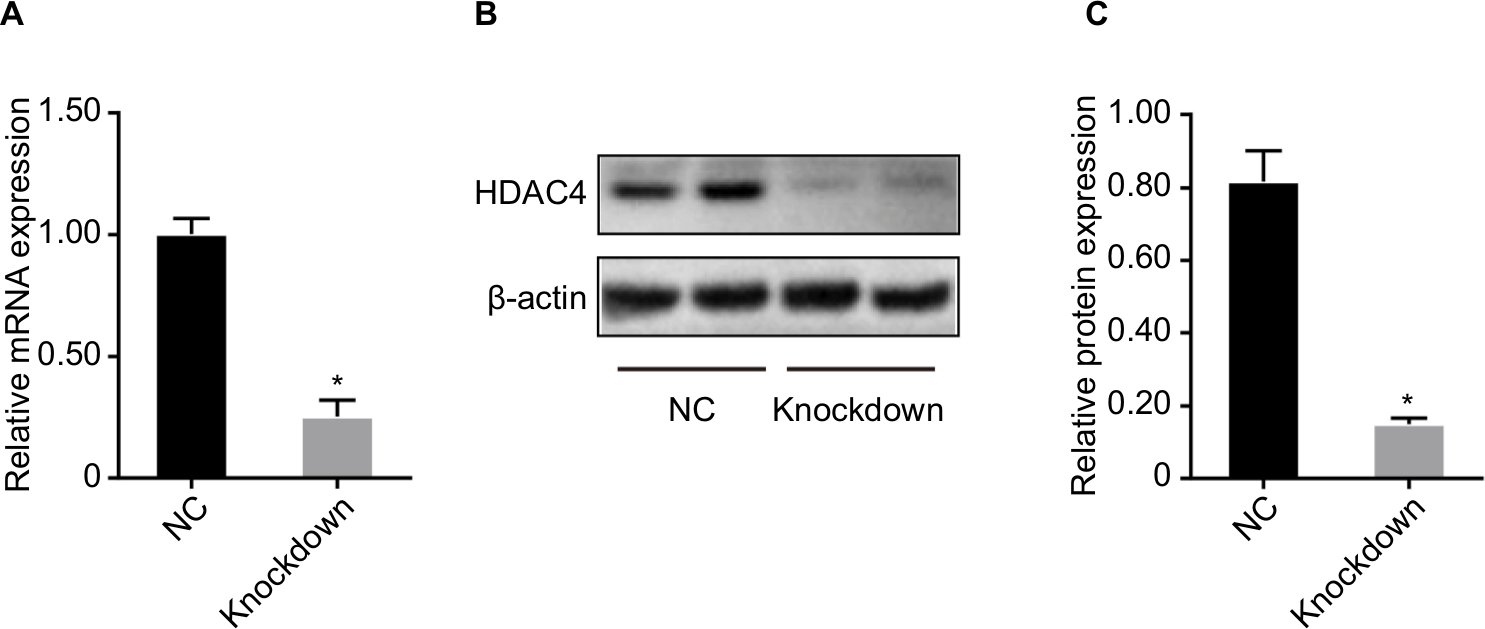 | Figure 6 Transfection efficiency after HDAC4 knockdown. Notes: (A) Relative mRNA level of HDAC4. (B) Protein bands of HDAC4. (C) Densitometric analysis of protein expression. Data are presented as the mean ± SD (n=3). *P<0.05 vs NC. Abbreviations: HDAC4, histone deacetylase 4; NC, siRNA-HDAC4 negative control group; knockdown, siRNA-HDAC4 knockdown group. |
Glucose concentration
Compared with the Con group, the glucose concentration in the medium of the PA group was significantly higher; however, resveratrol lowered this concentration. When HDAC4 was knocked down, the ability of resveratrol to reduce the glucose concentration in the medium decreased, and there was no difference in the glucose concentration in the medium between the knockdown group and the PA group (Figure 7A).
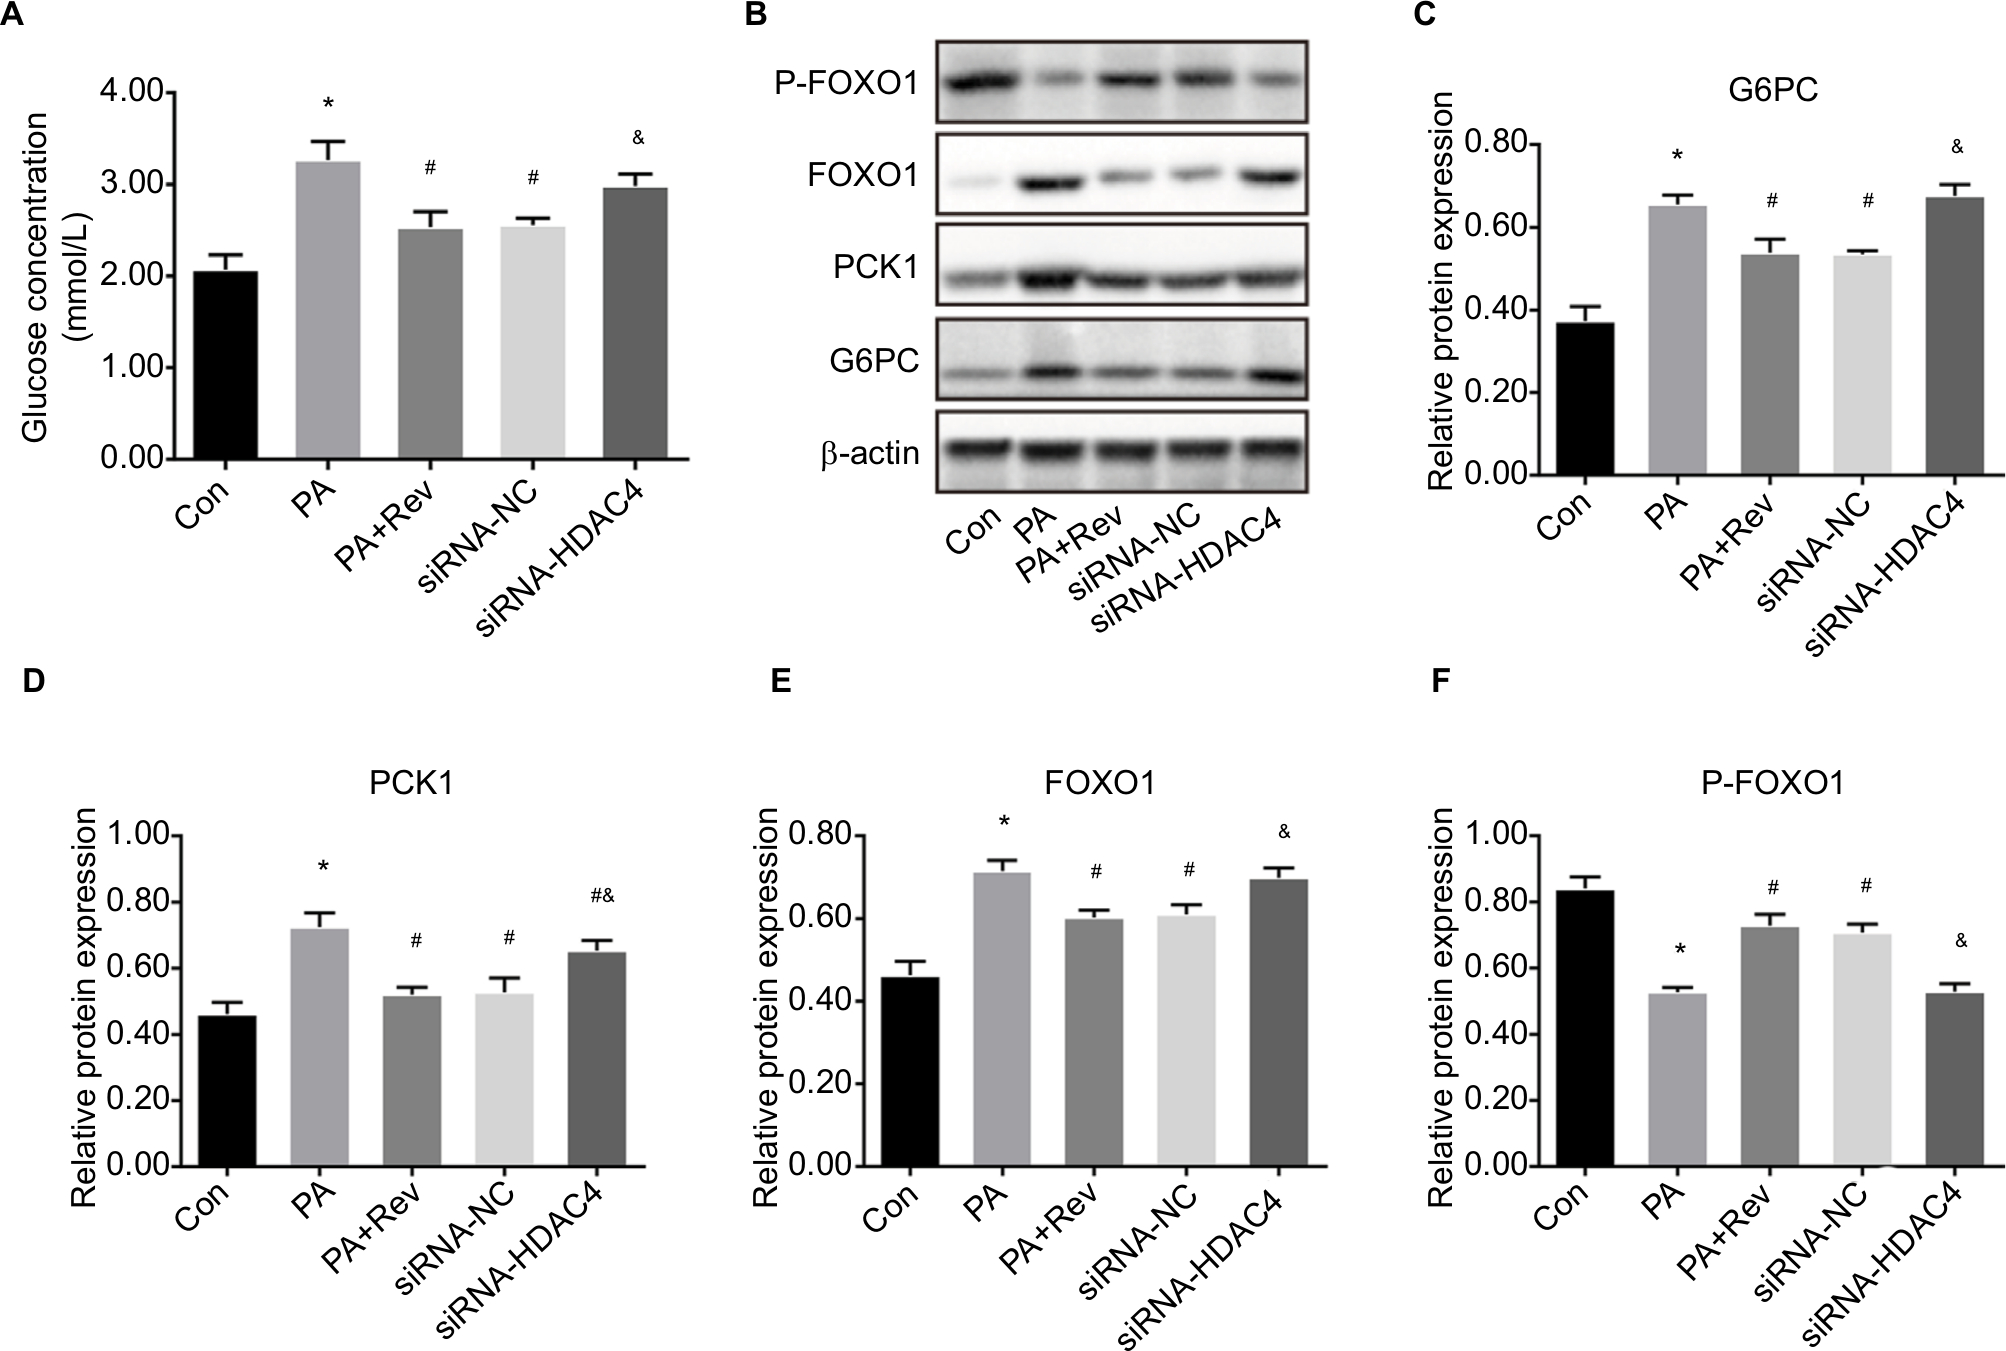 | Figure 7 Effect of resveratrol on the glucose concentration and gluconeogenesis pathway after HDAC4 knockdown. Notes: (A) Effect of resveratrol on the glucose concentration. Data are presented as the mean ± SD (n=4). (B) Protein bands of gluconeogenesis pathway molecules. (C–F) Densitometric analysis of protein expression: (C) G6PC, (D) PCK1, (E) FOXO1, and (F) P-FOXO1. Data are presented as the mean ± SD (n=4). *P<0.05 vs Con, #P<0.05 vs PA, &P<0.05 vs Rev. Abbreviations: G6PC, glucose-6-phosphatase catalytic subunit; PCK1, phosphoenolpyruvate carboxykinase 1; FOXO1, forkhead box protein O1; HDAC4, histone deacetylase 4; Con, control group, PA, palmitic acid group; Rev, palmitic acid + Rev 20 µM group; siRNA-NC, palmitic acid + Rev 20 µM + siRNA-HDAC4 negative control group; siRNA-HDAC4, palmitic acid + Rev 20 µM + siRNA-HDAC4 knockdown group. |
Expression of gluconeogenesis molecules
Based on the above mentioned findings, 20 µM resveratrol suppressed gluconeogenesis in HepG2 cells. Therefore, we selected this concentration to determine whether it inhibits gluconeogenesis through HDAC4. After HDAC4 knockdown, the expression levels of the key gluconeogenesis molecules, G6PC, PCK1, and FOXO1, were increased and p-FOXO1 was decreased, indicating that gluconeogenesis was enhanced after HDAC4 knockdown. These results indicated that resveratrol inhibited gluconeogenesis through HDAC4 (Figure 7B–F).
Discussion
There are many methods for establishing an insulin resistance model in hepatocytes in vitro, such as high glucose induction,8 insulin induction,9 high glucose combined with insulin induction,10 PA induction,11 and dexamethasone induction.12 Here, we used 0.25 mmol/L PA treatment, which is the concentration chosen in most studies5 and in our previous study.
The liver is sensitive to insulin actions, and impaired glucose and lipid metabolism in the liver can cause various metabolic syndromes such as obesity, insulin resistance, diabetes, and nonalcoholic fatty liver disease. In patients with insulin resistance, the main source of endogenous glucose production is gluconeogenesis, rather than glycogen decomposition, and the rate-limiting enzymes, G6PC and PCK1, are the core of gluconeogenesis.13 In the liver, FOXO1 promotes the expression of these enzymes, resulting in increased hepatic glucose production and elevated blood glucose levels.
FOXO1 is regulated by AKT (also termed phosphatidylinositol 3-kinase/protein kinase B). After AKT phosphorylates FOXO1, FOXO1 translocates from the nucleus to the cytoplasm, which inhibits its transcriptional activity, and the expression of FOXO1 decreases.14 In fact, the phosphorylation of specific sites in FOXO1 promotes binding to 14-3-3 protein, which masks the DNA-binding domain and nearby nuclear localization signals of FOXO1, thereby disrupting the effect of FOXO1 on gene expression and promoting shuttling from the nucleus to the cytoplasm. There is a relationship between the phosphorylation and acetylation of FOXO1. Acetylation of FOXO1 promotes the phosphorylation of FOXO1, which in turn inhibits the transcriptional activity and function of FOXO1.15,16
This study showed that under resveratrol treatment at a low concentration, the expression of G6PC, PCK1, and FOXO1 was decreased compared with the PA group, and the phosphorylation level of the key molecule, FOXO1, which is upstream of G6PC and PCK1, was increased. These results indicated that a low concentration of resveratrol inhibited gluconeogenesis in insulin-resistant hepatocytes.
Previous studies have shown that resveratrol significantly improves blood glucose levels, insulin sensitivity, and lipid levels in type 2 diabetes patients and model mice,17,18 which may be related to activation of Sirt1 and AMP-dependent protein kinase (AMPK). There is increasing evidence that Sirt1 is one of the caloric proteins that regulates mitochondrial biogenesis, energy homeostasis, and insulin sensitivity.19 In 2003, resveratrol was found to be a potent small molecule activator of Sirt1. Sirt1-activated AMPK reduces oxidative stress, which indicates improved insulin sensitivity and control of blood glucose.20 In individuals with obesity, 150 mg/day resveratrol was administered for 30 days, which resulted in a plasma resveratrol concentration of 183 ng/mL and mimicked the health effects of caloric restriction. In the absence of weight changes, resveratrol reduced the sleeping and resting metabolic rates, and improved mitochondrial function in skeletal muscles and the oxidative capacity in adipose tissues.21
So far, 18 HDACs have been identified, which are divided into four categories. Class I HDACs, including HDAC1, 2, 3, and 8, mainly regulate cell survival and proliferation. Class II HDACs, including HDAC4, 5, 6, 7, 9, and 10, are mainly located in the cytoplasm and can shuttle between the cytoplasm and nucleus.22 Class III HDACs, also known as sirtuins, include Sirt1–7.23 Class IV HDACs include HDAC11.24 Sirt1 and HDAC4 are both members of the histone deacetylase family. We examined whether resveratrol can also act as an activator of HDAC4. HDAC4 is a histone deacetylase, and its phosphorylation has received extensive attention. The molecular behavior and phosphorylation-mediated nuclear translocation of HDAC4 are closely related to energy and glucose metabolism, and insulin sensitivity.
There are some discrepancies in the results of recent studies. These discrepancies may be related to model selection (different animals, mouse models, and cell lines) and treatment selection (eg, insulin or glucagon). Some studies have indicated that silencing HDAC4 increased the blood glucose and insulin levels in diet-induced obese mice. Another study has reported that when db/db mice were treated with HDAC4/5/7-shRNAs, their glucose tolerance test and pyruvate tolerance test results indicated that their blood glucose levels and glucose intolerance significantly improved. Mihaylova et al16 have shown that under the fasting hormone, glucagon, HDAC4 was dephosphorylated, translocated into the nucleus, and recruited to the promoter of key gluconeogenesis pathway molecules, such as G6PC, to enhance the gluconeogenesis pathway. In Drosophila, Wang et al25 have found that salt-inducible kinase 3 was inactivated during fasting, resulting in dephosphorylation and nuclear translocation of HDAC4 and FOXO1 deacetylation. After FOXO1 deacetylation, FOXO1 dephosphorylation was enhanced, thus activating FOXO1. These results support our experimental results. In the insulin-resistant state, the levels of total p-HDAC4 and cytoplasmic HDAC4 were significantly decreased, while nuclear HDAC4 was significantly increased. Treatment with 20 µM resveratrol reversed the dephosphorylation of p-HDAC4, resulting in reduced dephosphorylation of FOXO1 and increased inhibition of target genes. Therefore, the expression of G6PC and PCK1 was decreased, and gluconeogenesis was suppressed. After knocking down HDAC4, the beneficial effect of resveratrol on gluconeogenesis was abrogated. These results confirmed that resveratrol decreased gluconeogenesis in the liver by modulating HDAC4, possibly through nuclear–cytoplasmic translocation.
The various concentrations of resveratrol had different effects on insulin resistance. High resveratrol concentrations enhanced insulin resistance. The cytotoxicity analysis showed that the cell survival rate was low, indicating a cytotoxic effect on the cells. However, at a low concentration, resveratrol had a beneficial effect on the cells by inhibiting insulin resistance.
This study has some shortcomings. First, the acetylation level of FOXO1 was not examined in the study because we did not have the relevant antibody. If we had this indicator, the results would be relatively complete because HDAC4 may be directly related to FOXO1 acetylation, which in turn causes changes in its phosphorylation. Second, our study only used an in vitro model. An animal model is required to confirm the results.
Conclusion
Resveratrol could suppress gluconeogenesis under insulin-resistant state via translocaton of HDAC4 from nucleus to cytoplasm. Resveratrol and HDAC4 may be potential therapeutic targets for obesity, insulin resistance, and type 2 diabetes.
Data availability
The data can be obtained by email request.
Acknowledgments
We thank Liwen Bianji, Edanz Group China, for editing the English text of a draft of this manuscript. This study was supported by the grant from the Natural Science Foundation of Hebei Province (No H2018307071).
Disclosure
The authors report no conflicts of interest in this work.
References
Guariguata L, Whiting DR, Hambleton I, Beagley J, Linnenkamp U, Shaw JE. Global estimates of diabetes prevalence for 2013 and projections for 2035. Diabetes Res Clin Pract. 2014;103(2):137–149. | ||
Yar AS, Menevse S, Alp E. The effects of resveratrol on cyclooxygenase-1 and -2, nuclear factor kappa beta, matrix metalloproteinase-9, and sirtuin 1 mRNA expression in hearts of streptozotocin-induced diabetic rats. Genet Mol Res. 2011;10(4):2962–2975. Available from: http://dx.doi.org/10.4238/2011.November.29.7. Accessed March 05, 2019. | ||
Ramadori G, Gautron L, Fujikawa T, Vianna CR, Elmquist JK, Coppari R. Central administration of resveratrol improves diet-induced diabetes. Endocrinology. 2009;150(12):5326–5333. | ||
Boutant M, Cantó C. SIRT1 metabolic actions: integrating recent advances from mouse models. Mol Metabo. 2014;3(1):5–18. | ||
Zhang H, Ge Z, Tang S, Meng R, Bi Y, Zhu D. Erythropoietin ameliorates PA-induced insulin resistance through the IRS/AKT/FOXO1 and GSK-3β signaling pathway, and inhibits the inflammatory response in HepG2 cells. Mol Med Rep. 2017;16(2):2295–2301. | ||
Livak KJ, Schmittgen TD. Analysis of relative gene expression data using real-time quantitative PCR and the 2−ΔΔCT method. Methods. 2001;25(4):402–408. | ||
Gao D, Nong S, Huang X, et al. The Effects of Palmitate on Hepatic Insulin Resistance Are Mediated by NADPH Oxidase 3-derived Reactive Oxygen Species through JNK and p38 MAPK Pathways. J Biol Chem. 2010;285(39):29965–29973. | ||
Song JJ, Wang Q, Du M, Li TG, Chen B, Mao XY. Casein glycomacropeptide-derived peptide IPPKKNQDKTE ameliorates high glucose-induced insulin resistance in HepG2 cells via activation of AMPK signaling. Mol Nutr Food Res. 2017;61(2). | ||
Li L, Li G, Wei H, et al. The endoplasmic reticulum stress response is associated with insulin resistance-mediated drug resistance in HepG2 cells. Neoplasma. 2015;62(2):180–190. | ||
Zheng X, Ke Y, Feng A, et al. The mechanism by which amentoflavone improves insulin resistance in HepG2 cells. Molecules. 2016;21(5):624. | ||
Chen L, Tang Z, Wang X, Ma H, Shan D, Cui S. PKM2 aggravates palmitate-induced insulin resistance in HepG2 cells via STAT3 pathway. Biochem Biophys Res Commun. 2017;492(1):109–115. | ||
Ma JZ, Yang LX, Shen XL, et al. Effects of traditional Chinese medicinal plants on anti-insulin resistance bioactivity of DXMS-Induced insulin resistant HepG2 cells. Nat Prod Bioprospect. 2014;4(4):197–206. | ||
Hatting M, Tavares CDJ, Sharabi K, Rines AK, Puigserver P. Insulin regulation of gluconeogenesis. Ann N Y Acad Sci. 2018;1411(1):21–35. | ||
Wang CX, Zhao AH. Leptin receptor overlapping transcript (LEPROT) gene participates in insulin pathway through FoxO. Gene. 2016;587(1):64–69. | ||
Zhou X, Zeng XY, Wang H, et al. Hepatic FoxO1 acetylation is involved in oleanolic acid-induced memory of glycemic control: novel findings from study 2. PLoS ONE. 2014;9(9):e107231. | ||
Mihaylova MM, Vasquez DS, Ravnskjaer K, et al. Class IIa histone deacetylases are hormone-activated regulators of FOXO and mammalian glucose homeostasis. Cell. 2011;145(4):607–621. | ||
Oyenihi OR, Oyenihi AB, Adeyanju AA, Oguntibeju OO. Antidiabetic effects of resveratrol: the way forward in its clinical utility. J Diabetes Res. 2016;2016:9737483. | ||
González-Rodríguez Á, Santamaría B, Mas-Gutierrez JA, et al. Resveratrol treatment restores peripheral insulin sensitivity in diabetic mice in a SirT1-independent manner. Mol Nutr Food Res. 2015;59(8):1431–1442. | ||
Yu J, Auwerx J. The role of sirtuins in the control of metabolic homeostasis. Ann N Y Acad Sci. 2009;1173(Suppl 1):E10–E19. | ||
Vallianou NG, Evangelopoulos A, Kazazis C. Resveratrol and diabetes. Rev Diabet Stud. 2013;10(4):236–242. | ||
Timmers S, Konings E, Bilet L, et al. Calorie restriction-like effects of 30 days of resveratrol supplementation on energy metabolism and metabolic profile in obese humans. Cell Metab. 2011;14(5):612–622. | ||
Elena C, Saverio M. Inhibition of histone deacetylases in cancer therapy: lessons from leukaemia. Br J Cancer. 2016;114(6):605–611. | ||
Duan W. Sirtuins: from metabolic regulation to brain aging. Front Aging Neurosci. 2013;5:36. | ||
Delcuve GP, Khan DH, Davie JR. Roles of histone deacetylases in epigenetic regulation: emerging paradigms from studies with inhibitors. Clin Epigenetics. 2012;4(1):5–13. | ||
Wang B, Moya N, Niessen S, et al. A hormone-dependent module regulating energy balance. Cell. 2011;145(4):596–606. |
 © 2019 The Author(s). This work is published and licensed by Dove Medical Press Limited. The
full terms of this license are available at https://www.dovepress.com/terms
and incorporate the Creative Commons Attribution
- Non Commercial (unported, 3.0) License.
By accessing the work you hereby accept the Terms. Non-commercial uses of the work are permitted
without any further permission from Dove Medical Press Limited, provided the work is properly
attributed. For permission for commercial use of this work, please see paragraphs 4.2 and 5 of our Terms.
© 2019 The Author(s). This work is published and licensed by Dove Medical Press Limited. The
full terms of this license are available at https://www.dovepress.com/terms
and incorporate the Creative Commons Attribution
- Non Commercial (unported, 3.0) License.
By accessing the work you hereby accept the Terms. Non-commercial uses of the work are permitted
without any further permission from Dove Medical Press Limited, provided the work is properly
attributed. For permission for commercial use of this work, please see paragraphs 4.2 and 5 of our Terms.