Back to Journals » Neuropsychiatric Disease and Treatment » Volume 15
Resting-State Functional MRI Study: Connection Strength of Brain Networks in DR Patients
Authors Li L, Dai H ![]() , Ke J
, Ke J ![]() , Shi C, Jiang N
, Shi C, Jiang N ![]() , Yang CM
, Yang CM
Received 16 August 2019
Accepted for publication 18 November 2019
Published 5 December 2019 Volume 2019:15 Pages 3359—3366
DOI https://doi.org/10.2147/NDT.S227468
Checked for plagiarism Yes
Review by Single anonymous peer review
Peer reviewer comments 2
Editor who approved publication: Dr Yu-Ping Ning
Lan Li,1 Hui Dai,2 Jun Ke,2 Cen Shi,2 Nan Jiang,2 Chun-Mei Yang3
1Department of Endocrinology, First Affiliated Hospital of Kunming Medical University, Kunming, Yunnan 215006, People’s Republic of China; 2Department of Radiology, First Affiliated Hospital of Soochow University, Suzhou, Jiangsu 215006, People’s Republic of China; 3Department of Endocrinology, First Affiliated Hospital of Soochow University, Suzhou, Jiangsu 215006, People’s Republic of China
Correspondence: Hui Dai
Department of Radiology, The First Affiliated Hospital of Soochow University, Suzhou, Jiangsu 215006, People’s Republic of China
Tel/Fax +86512-67780633
Email [email protected]
Chun-Mei Yang
Department of Endocrinology, The First Affiliated Hospital of Soochow University, Suzhou, Jiangsu 215006, People’s Republic of China
Tel/Fax +86512-67780633
Email [email protected]
Purpose: To explore the functional connection strength (FCS) changes of brain networks in diabetic retinopathy (DR) patients and uncover the underlying mechanism.
Methods and Materials: Twenty-one patients with DR and 21 age- and sex-matched healthy controls were enrolled from August 2012 to September 2014. Subjects were scanned using 3T MR with blood-oxygen-level dependent (BOLD) and 3-dimension fast spoiled gradient echo (3D-FSPGR) sequences. MR data was analyzed via preprocessing and functional network construction. After a group comparison, components of brain networks with significant group differences were extracted and the FCS of the brain network was evaluated. The brain areas were compared between patients and controls. P-values less than 0.05 were considered statistically significant. Connection strength was evaluated with alphasim, P<0.01.
Results: The component maps of altered brain networks with quantified FCS were obtained in DR patients, demonstrating more disconnections mainly in the bilateral Heschl’s gyrus, left cuneus, left occipital lobe, bilateral amygdala, left parahippocampal, bilateral fusiform, and left superior parietal in the patients group compared to the healthy controls (P<0.01), while compensations may occur in the frontal-cingulum region, as well as among the right caudate, left thalamus, left inferior temporal lobe, and middle orbital frontal lobe.
Conclusion: Brain network connections, decreased in the brain areas of which in charging with cognition and visual function, suggests that DR patients might have cognitive decline and visual function loss. However, there might be a frontal compensatory circle in patients with DR.
Keywords: resting-state functional MRI, brain networks, functional connection strength, diabetic retinopathy
Introduction
Diabetic retinopathy (DR) is the most common complication of diabetes. Patients who have DR are 25-times more likely to become blind than the general population.1 Researchers found some metabolite changes in optically relevant brain areas (visual cortex and optic radiation) and in non-optically relevant brain areas (frontal white matter) of DR patients by MR spectrum.1,2 The brain is one of the targets for diabetic end organ damage and brain damage is a major complication of diabetes.
Recently there was a study using resting-state functional MRI, based on the amplitude of the low-frequency fluctuations algorithm.3 They found that DR patients showed spontaneous cerebral activity abnormalities in many brain regions that were associated with cognitive impairments. In our previous study, the correlation analysis between clinical indexes and brain network indexes in patients with DR were studied. It was found that brain functional networks were altered, specifically in the areas of visual function and cognition, and these alterations correlated with extensive clinical indexes, suggesting that brain networks changes might reflect the severity of visual weakness and cognitive decline in DR patients.4 There is some evidence that proves the correlation between DR and cognitive dysfunction,5–7 suggesting a near 3-fold increased risk of cognitive impairment in patients with DR compared to those without.
Brain networks analysis is a non-invasive method that mathematically describes anatomical and functional organization in terms of graphs or networks, which comprise nodes (vertices) and edges (links) between pairs of nodes.6 A connection expresses the existence and/or strength of a relationship, interaction, or dependency between two nodes in the network. Weighted connections contain information about functional connection strength (FCS). FCS is a voxel-wise data-driven graph-theoretical approach for identifying brain subnetworks and quickly calculating the total number of functional connections. It is simply an average of connectivities within the domain. The FCS value of the voxel directly reflects the capability of functional connectivity between different voxels, and the voxels with higher FCS values are considered to indicate more powerful functional connections with other voxels and transmit more information.8,9 Compared with other methods, FCS can measure all the functional connection values of each voxel and largely avoid artificial factors. FCS obtained increased concern recently and there have been a few studies about FCS.10–12 However, it has not been used in brain networks analysis of DR patients yet.
In the present study, it was hypothesized that DR patients beared FCS alterations of certain brain regions of networks. This study aimed to evaluate the FCS changes of brain networks in DR patients. With the present study of FCS, a novel index would probably be added to the brain network research of DR patients. This may bring some new interesting insights and shed new light on the underlying mechanism of cerebral injury in patients with DR.
Materials and Methods
Subjects
After obtaining approval of the Medical Ethics Review Committee and obtaining informed consent in accordance with the Declaration of Helsinki, 21 patients with DR and 21 healthy volunteers were enrolled in this study from August 2012 to September 2014, which are in conformity with the previous study.4 Ten men and 11 women from 39–76 years old (mean age 55.9±9.7) were included in the DR group and compared to sex-matched subjects from 37–74 years old (mean age 55.4±9.0) in the control group. There were no statistically significant differences in age or gender between the two groups (P>0.05).
Subjects were recruited into the study based on a clinical history of diabetes with unclear vision, and subsequently these subjects underwent a thorough history and physical examination, including an ophthalmic examination. Inclusion criteria for the DR group were: (1) confirmed history of DM and (2) ocular fundus abnormalities observed by fundus fluorescein angiography (FFA). The control group consisted of age- and sex-matched healthy volunteers without clinical evidence or history of DR.
Exclusion criteria for all subjects were: (1) a brain abnormality detected on a routine non-contrast MRI examination, (2) neurological or neurosurgical disease identified by history or examination, (3) evidence of systemic disease including hypertension and hypercholesterolemia, (4) evidence of psychological and psychiatrical diseases, (5) use of alcohol, caffeine, or nicotine within the last 3 months, and (6) left-handed.
Details of sample characteristics are provided in Table 1. Several clinical indexes of patients with DR were recorded, including DM type, clinical DR grade, duration of DM, hemoglobin A1c, mini-mental state examination, type of diabetes treatment, as well as the sex and age.
 |
Table 1 Detailed Clinical Data of Each Patient with DR |
The severity of DR was graded from 0–4 according to the Scottish Grading Protocol:13 grade 0 - patients with DM but without eye disease; grade 1 - mild non-proliferative background DR with microaneurysms, flame exudates, >4 blot hemorrhages in one or both hemifields, and/or cotton wool spots; grade 2 - moderate non-proliferative background DR with >4 blot hemorrhages in one hemifield; grade 3 - severe non-proliferative DR with >4 blot hemorrhages in both hemifields, intra-retinal microvascular anomalies, venous beading (preproliferative DR); and grade 4 - proliferative DR with neovascularization of the disk, neovascularization of the retina elsewhere, vitreous hemorrhage, retinal detachment.
MRI Acquisition
A 3T MR system (Signa HDxt, GE Healthcare, Milwaukee, WI) with an 8-channel array head coil was used. Subjects were scanned supine and head-first with cushions placed symmetrically on both sides of the head to reduce motion. Resting-state BOLD and three-dimensional fast spoiled gradient recalled (3D-FSPGR) sequences were obtained. A condition of eyes-closed wakefulness was ensured throughout the acquisition of each resting-state BOLD examination. Additionally, the subjects were instructed to not engage in any specific thinking activities. The scan parameters of the BOLD sequence were: repetition time (TR)/echo time (TE) 2000/30 ms, field of view (FOV) 256 mm×256 mm, matrix 64×64, slices 33, slice thickness 4 mm without slice gap, number of signal averages (NEX) 1, scan time 8 minutes. A 3D-FSPGR sequence was used for structural data acquisition with: TR/TE/inversion time (TI) 10.77/4.89/400 ms, FOV 256 mm × 256 mm, slice 1.0 mm without slice gap, matrix 256×256, NEX 1, flip angle 15°, bandwidth 15.63 Hz, scan time 4 minutes 41 seconds.
Data Post-Processing
Standard professional data post-processing software, Data Processing Assistant for Resting-state fMRI (DPARSF 3.2 advanced edition, http://restfmri.net/forum/DPARSF), was used for data analysis. DPARSF is a plug-in software based on statistical parametric mapping (SPM 8, http://www.fil.ion.ucl.ac.uk/spm), which runs on a matrix laboratory platform (MATLAB R2012a). Graphvar (GraphVar beta version 0.62) is applied for functional brain connectivity analyses, which is a user-friendly graphical-user-interface (GUI)-based toolbox (MATLAB) for comprehensive graph-theoretical analyses of brain connectivity, including network construction and characterization, statistical analysis on network topological measures, and interactive exploration of results.
Preprocessing
Preprocessing included data format conversion, removal of the first 10 time points, slice timing, realignment, normalization, smoothing with a 4 mm full width at half-maximum (FWHM) Gaussian kernel, removal of linear trends in the data, and filtering (0.06–0.11 Hz),14 and then removal of nuisance covariate effects. Three patients’ data, with head translation larger than 1.5 mm or head rotation larger than 2°, were excluded. Covariates including head motion parameters, as well as gray matter, white matter, and cerebrospinal fluid, were regressed out for preprocessed images, and then the brain was divided into 90 regions defined by the anatomical automatic labeling (AAL) template. Finally, the time series of each brain region was extracted.
Functional Network Construction
Correlation matrices were generated based on time series signals and Pearson correlation was used to evaluate the relationship among the time series by r-values, from which a 90×90 correlation matrix could be obtained for each subject. For the connectivity matrices that entail correlation strengths (r), we transformed the correlation values into z-values using Fisher´s r to z transformation, as the r distribution was not a Gaussian distribution. In order to compare network properties between the patient and control groups, for each test adjacency matrix, a group of numbers ranging from 0.1–0.5 with intervals of 0.01 were selected as the threshold value,14 to obtain each association matrix. Then, functional brain networks of the two groups were built under a series of different thresholds.
Statistics
The correlation strengths were derived from random time series (pairwise null-model distribution) of any two nodes. Therefore, 21 iterations were set for generating the pairwise null-model distributions against which the original r-value was tested. To test against random groups, 21 repetitions were set. The differences in network measures between randomized groups were calculated resulting in a permutation distribution of difference under the null hypothesis (for ANOVA also the F-value deriving from each repetition was computed). The actual between-group difference in network measures (and for ANOVA also the F-value) was then placed in the corresponding permutation distribution and a P-value was calculated based on its percentile position. The brain areas with significant differences between patients and the control group were extracted. P-values less than 0.05 were considered statistically significant. Adjustments for the multiple comparisons performed were made via a Bonferroni correction. FCS was evaluated with Alphasim with a P-value less than 0.01. In a FCS graph, identified Graph-Components (nodes) and lines with different thickness between nodes (edges/links) were shown.
Results
The FCS of brain networks was significantly decreased between nine nodes (bilateral amygdala, left parahippocampal, left cuneus, left superior/middle/inferior occipital lobe, left fusiform, and left superior parietal lobe) and left Heschl’s gyrus, and between three nodes (left amygdala and bilateral fusiform) and right Heschl's gyrus, in the patients group compared to in healthy controls (p<0.01), as shown in Figures 1 and 2 and Table 2. Additionally, the FCS was significantly increased, mainly among multiple nodes of the bilateral frontal lobe, among the cingulum and frontal lobe, and between the right caudate and right orbital part of the middle frontal lobe, left thalamus, and left orbital part of the middle frontal lobe, and the left inferior temporal gyrus and left orbital part of the middle frontal lobe (Table 3), which formed a complicated network, as shown in Figures 3 and 4.
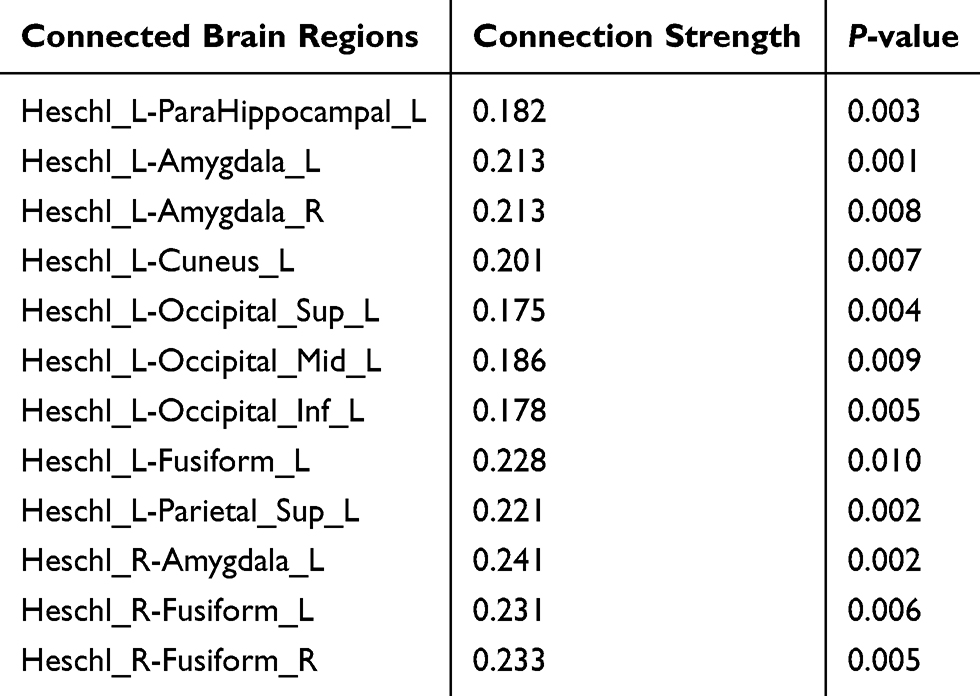 |
Table 2 The Connection Strength of Brain Networks and Its P-Value Among Different Brain Regions Between Healthy Controls and DR Patients |
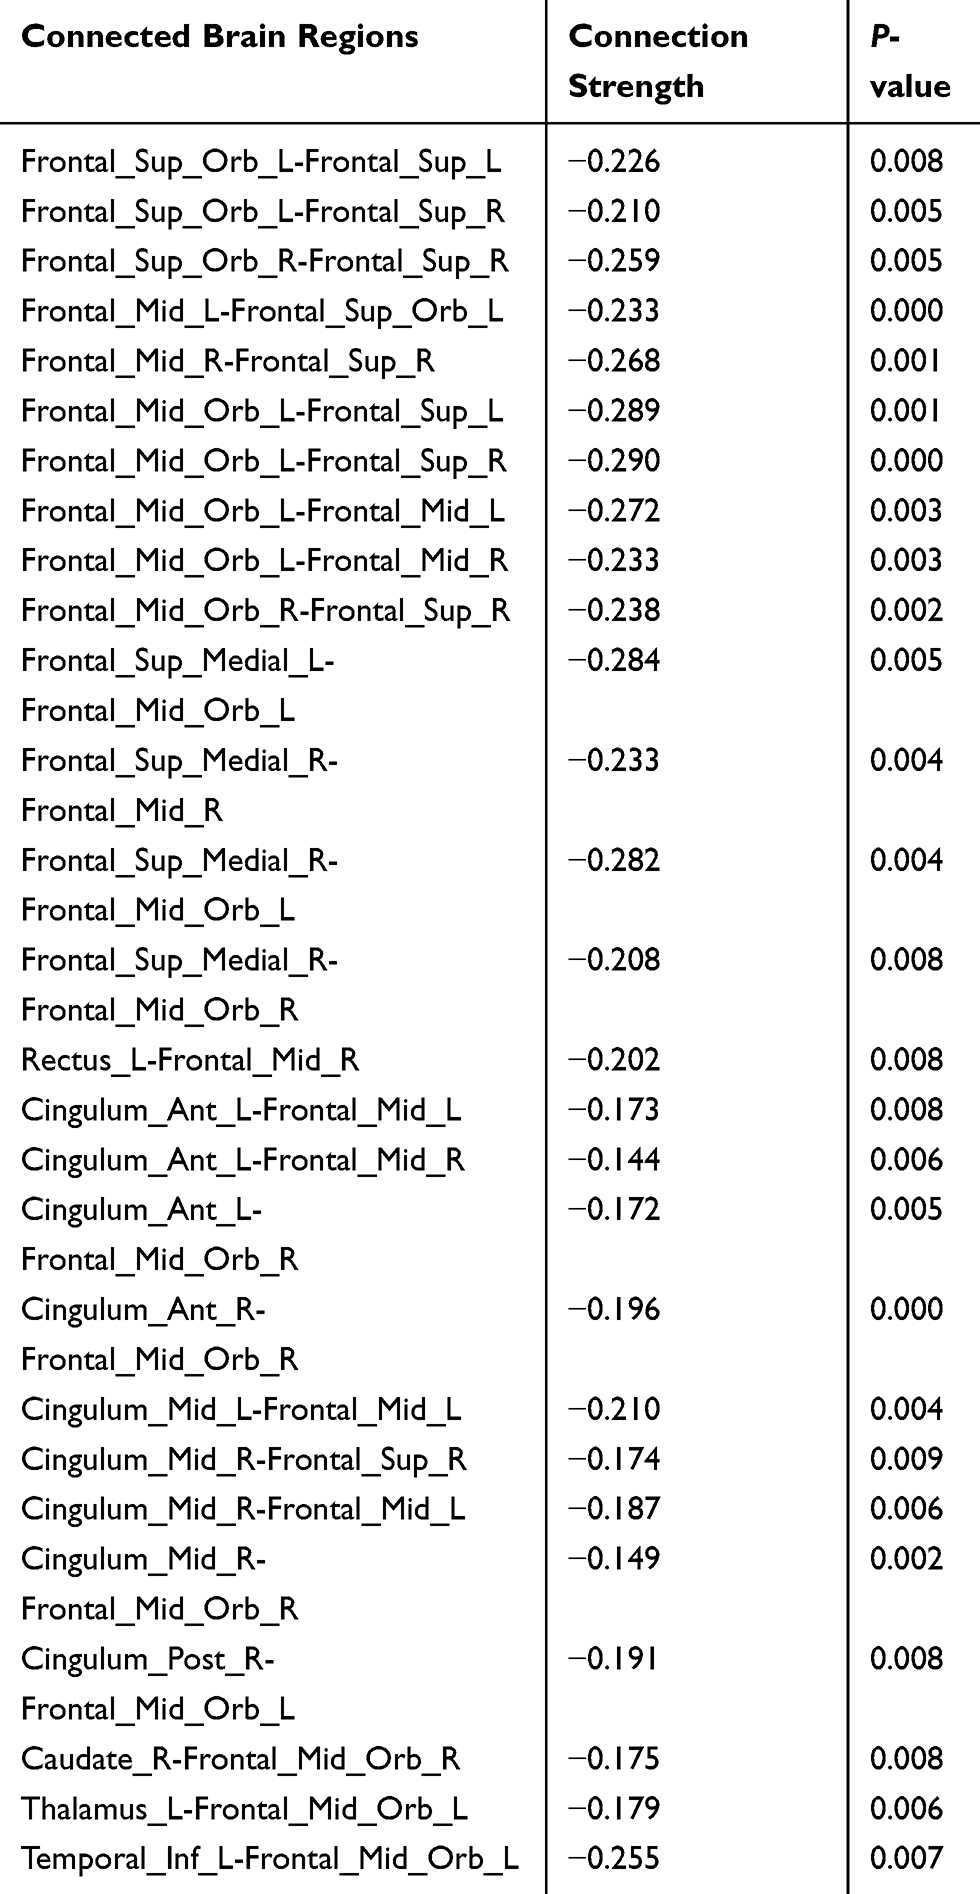 |
Table 3 The Connection Strength of Brain Networks and Its P-Value Among Different Brain Regions Between Healthy Controls and DR Patients |
 |
Figure 1 Twelve nodes. The connection strength of brain networks among these nodes significantly decreases more in the patient group than in the control group. The line thickness between nodes indicates the strength of the computed measure on the respective link, quantified with marked number. |
 |
Figure 2 Three-dimensioned views by BrainNet Viewer; respectively, sagittal, axial, and coronal views, showing the same nodes as in Figure 1. |
 |
Figure 3 Nineteen nodes. The connection strength of brain networks among these nodes significantly increases more in the patient group than in the control group. The line thickness between nodes indicates the strength of the computed measure on the respective link, quantified with marked number. |
 |
Figure 4 Three-dimensioned views by BrainNet Viewer; respectively, sagittal, axial, and coronal view, showing the same nodes as in Figure 3. |
Discussion
In the present study, it is demonstrated that there were increased and decreased FCS of brain networks in DR patients. Decreased FCS (patients group compared with controls group) involved the nodes of visual cortex, auditory cortex, and limbic system, while increased FCS involved the nodes mainly in the frontal lobe and cingulum, which forms a circuit containing disconnection and compensatory networks. It emphasizes on the underlying circuit differing from the former study on the correlation study between brain networks and clinical indexes.4 There are some new insights into retinal physiology, suggesting that the retinal dysfunction in DR patients may be viewed as a change in the retinal neurovascular unit.15 The neurovascular unit is supposed to be altered in the patients with DR, with changes in neural function and neurotransmitter metabolism and loss of blood–brain barrier. The neural function changes may be the critical underlying mechanism of brain network alterations in DR patients and it may elucidate the physical basis of the brain network circuit.
The bilateral Heschl’s gyri are the most important two nodes among the decreased networks in the patients group. Heschl’s gyri are part of the primary auditory cortex and they are frequently reported as being anatomically asymmetric.16,17 It is demonstrated that the Heschl’s gyri are involved in many kinds of functions. Basically, they are mainly correlated with acoustic processing with temporal and spectral acoustic information.18 However, the functions of bilateral Heschl’s gyri are also asymmetric. It is reported that larger volumes of left Heschl’s gyrus were associated with larger extents of rate-related cortex on the left, and larger volumes of right Heschl’s gyrus related to larger extents of spectral-related cortex on the right, which may be in relation to known microanatomical asymmetries of Heschl’s gyrus.18 A meta-analysis showed that the Heschl’s gyrus structure changes related to the functions, as the left Heschl’s gyrus related to the sound temporal or phonological processing and the right gyrus to the sound tonal or musical processing.17
The FCS was decreased in DR patients between left Heschl’s gyrus and the ipsilateral visual cortex (left cuneus and left occipital lobe), which suggested the connection weakening in auditory and visual function. There was a study on anatomical–functional relation of Heschl’s gyrus by measuring the tonotopic subfield of the primary auditory cortex by 7T MR. It was interesting that the data revealed a previously unknown organizational parallel with the visual cortex.19 The visual cortex is a junction for integration of temporally-extended auditory and visual inputs.20 Retinopathy-induced impaired vision is suggested to be the initial factor leading to the visual functional network change and the disorder of visual and auditory function.
The FCS was decreased in DR patients among Heschl’s gyri, bilateral fusiform gyri, amygdala, left superior parietal gyrus, and left parahippocampal. Numerous studies have proved that retinopathy was not only correlated with visual cortex impairment, but also with cognitive dysfunction or dementia.6,21,22 A resting-state functional connectivity study demonstrated that the hippocampus, parietal cortices, and the lateral temporal cortical regions were the predominant components of the default-mode network,23 which is highly consistent with the results of the present study. Interestingly, Tzourio-Mazoyer et al16 observed a significant interaction between Heschl’s gyrus asymmetry and cognitive abilities. Decreased functional connectivity was found in the patients with Alzheimer’s disease, which were mainly located between the amygdala and the regions that are included in the default mode, in the context of conditioning and extinction networks.24 Moreover, it has been reported that the fusiform gyrus is an important brain area involved in facial cognition and the left parahippocampal is the principal region of neuronal degeneration in Alzheimer’s disease.25 Golby et al26 demonstrated that there were prominent deficits in a higher-order fusiform gyrus and parahippocampal, and the activation in these two regions were correlated with explicit memory performance. In addition, Mion et al27 observed that the degree of semantic deficit was related to dysfunction of the fusiform/parahippocampal gyrus.
The compensatory networks of DR patients were predominantly located in the frontal lobe and cingulum, as well as in the caudate, thalamus, and temporal gyrus. The frontal lobe is responsible for a number of higher-order cognitive functions, including planning, decision-making, and abstraction, and thus is a primary candidate for dysfunction in many neurodevelopmental and neuropsychiatric disorders. The frontal lobe circuit was discussed in autism and traumatic axonal injury.28,29 Researchers reported some brain regions with network alterations of DR patients involving the frontal lobe. In the present study, multiple brain regions in the frontal lobe were found with increased brain connectivity, mainly located inside the frontal lobe and between the frontal lobe and cingulum, suggesting that there might be a frontal compensatory circle in patients with DR.
There are several limitations in the study. First of all, the small sample size and heterogeneity of patients may lead to less reliable results, and the sample size needs to be expanded in the further study. Also, intra-individual differences are not considered in the statistical analysis, which may affect the results of the analyses. Additionally, correlation study between connectivity strength and medical factors is not contained in the present study, which needs further research with a considerable sample size. Finally, the clinical trial design with the pure DM group (DM patients without DR) needs to be further perfected to eliminate DM effects on brain networks from DR patients.
In conclusion, FCS were decreased in the brain areas which were in charge of cognition and visual function. This suggests that DR patients might have cognitive decline and visual function loss. However, there might be a frontal compensatory circle in patients with DR.
Acknowledgments
This work was mainly supported by the National Natural Science Foundation of China (grant number 81971573, 81701669), and partially supported by the Project of Invigorating Health Care through Science, Technology and Education, Jiangsu Provincial Medical Youth Talent (grant number QNRC2016709).
Disclosure
The authors report no conflicts of interest in this work.
References
1. Ozsoy E, Doganay S, Dogan M, Alkan A, Firat PG. Evaluation of metabolite changes in visual cortex in diabetic retinopathy by MR-spectroscopy. J Diabetes Complications. 2012;26(3):241–245.
2. Tong J, Geng H, Zhang Z, et al. Brain metabolite alterations demonstrated by proton magnetic resonance spectroscopy in diabetic patients with retinopathy. Magn Reson Imaging. 2014;32(8):1037–1042.
3. Wang ZL, Zou L, Lu ZW, et al. Abnormal spontaneous brain activity in type 2 diabetic retinopathy revealed by amplitude of low-frequency fluctuations: a resting-state fMRI study. Clin Radiol. 2017;72(4):340e1–340e7.
4. Dai H, Zhang Y, Lai L, et al. Brain functional networks: correlation analysis with clinical indexes in patients with diabetic retinopathy. Neuroradiology. 2017;59(11):1121–1131.
5. Crosby-Nwaobi RR, Sivaprasad S, Amiel S, Forbes A. The relationship between diabetic retinopathy and cognitive impairment. Diabetes Care. 2013;36(10):3177–3186.
6. Crosby-Nwaobi R, Sivaprasad S, Forbes A. A systematic review of the association of diabetic retinopathy and cognitive impairment in people with Type 2 diabetes. Diabetes Res Clin Pract. 2012;96(2):101–110.
7. Yoon SP, Grewal DS, Thompson AC, et al. Retinal microvascular and neurodegenerative changes in Alzheimer’s disease and mild cognitive impairment compared with control participants. Ophthalmol Retina. 2019;3(6):489–499.
8. Shi Y, Li J, Feng Z, et al. Abnormal functional connectivity strength in first-episode, drug-naive adult patients with major depressive disorder. Prog Neuropsychopharmacol Biol Psychiatry. 2019;97:109759.
9. Wang S, Zhan Y, Zhang Y, et al. Abnormal functional connectivity strength in patients with adolescent-onset schizophrenia: a resting-state fMRI study. Eur Child Adolesc Psychiatry. 2017;26(7):839–845.
10. Pijnenburg R, Scholtens LH, Mantini D, Vanduffel W, Barrett LF, van den Heuvel MP. Biological characteristics of connection-wise resting-state functional connectivity strength. Cereb Cortex. 2019. doi:10.1093/cercor/bhy342
11. Krishnamurthy LC, Krishnamurthy V, Crosson B, et al. Strength of resting state functional connectivity and local GABA concentrations predict oral reading of real and pseudo-words. Sci Rep. 2019;9(1):11385.
12. Yang M, He H, Duan M, et al. The effects of music intervention on functional connectivity strength of the brain in Schizophrenia. Neural Plast. 2018;2018:2821832.
13. Zachariah S, Wykes W, Yorston D. Grading diabetic retinopathy (DR) using the Scottish grading protocol. Community Eye Health. 2015;28(92):72–73.
14. Wei L, Yapeng L, Chunhong H, Xi Chen HD. Point process analysis in brain networks of patients with diabetes. Neurocomputing. 2014;145:182–189.
15. Antonetti DA, Klein R, Gardner TW. Diabetic Retinopathy. N Engl J Med. 2012;366(13):1227–1239.
16. Tzourio-Mazoyer NA-O, Mazoyer B. Variations of planum temporale asymmetries with Heschl’s Gyri duplications and association with cognitive abilities: MRI investigation of 428 healthy volunteers. Brain Struct Funct. 2017. doi:10.1007/s00429-017-1367-5.
17. Marie D, Maingault S, Crivello F, Mazoyer B, Tzourio-Mazoyer N. Surface-based morphometry of cortical thickness and surface area associated with Heschl’s Gyri duplications in 430 healthy volunteers. Front Hum Neurosci. 2016;10:69. (1662-5161 (Linking)).
18. Warrier C, Wong P, Penhune V, et al. Relating structure to function: Heschl’s gyrus and acoustic processing. J Neurosci. 2009;29(1):61–69.
19. Da Costa S, van der Zwaag W, Marques JP, Frackowiak RS, Clarke S, Saenz M. Human primary auditory cortex follows the shape of Heschl’s gyrus. J Neurosci. 2011;31(40):14067–14075.
20. Andric M, Davis B, Hasson U. Visual cortex signals a mismatch between regularity of auditory and visual streams. NeuroImage. 2017;157:648–659.
21. Wang Z, Yan C, Zhao C, et al. Spatial patterns of intrinsic brain activity in mild cognitive impairment and Alzheimer’s disease: a resting-state functional MRI study. Hum Brain Mapp. 2011;32:1720–1740. (1097-0193 (Electronic)).
22. Zhou X, Zhang J, Chen Y, et al. Aggravated cognitive and brain functional impairment in mild cognitive impairment patients with type 2 diabetes: a resting-state functional MRI study. J Alzheimer’s Dis. 2014;41(3):925–935.
23. Wang X, Wang J, He Y, et al. Apolipoprotein E epsilon4 modulates cognitive profiles, hippocampal volume, and resting-state functional connectivity in Alzheimer’s disease. J Alzheimer’s Dis. 2015;45(3):781–795.
24. Yao H, Liu Y, Zhou B, et al. Decreased functional connectivity of the amygdala in Alzheimer’s disease revealed by resting-state fMRI. Eur J Radiol. 2013;82(9):1531–1538.
25. Cai S, Chong T, Zhang Y, et al. Altered functional connectivity of fusiform gyrus in subjects with amnestic mild cognitive impairment: a resting-state fMRI study. Front Hum Neurosci. 2015;9:471.
26. Golby A, Silverberg G, Race E, et al. Memory encoding in Alzheimer’s disease: an fMRI study of explicit and implicit memory. Brain. 2005;128(Pt 4):773–787.
27. Mion M, Patterson K, Acosta-Cabronero J, et al. What the left and right anterior fusiform gyri tell us about semantic memory. Brain. 2010;133:3256–3268. (1460-2156 (Electronic)).
28. Scott-van Zeeland AA, Abrahams BS, Alvarez-Retuerto AI, et al. Altered functional connectivity in frontal lobe circuits is associated with variation in the autism risk gene CNTNAP2. Sci Transl Med. 2010;2(56):56ra80.
29. Marquez de la Plata CD, Garces J, Shokri KE, et al. Deficits in functional connectivity of hippocampal and frontal lobe circuits after traumatic axonal injury. Arch Neurol. 2011;68(1):74–84.
 © 2019 The Author(s). This work is published and licensed by Dove Medical Press Limited. The
full terms of this license are available at https://www.dovepress.com/terms
and incorporate the Creative Commons Attribution
- Non Commercial (unported, 3.0) License.
By accessing the work you hereby accept the Terms. Non-commercial uses of the work are permitted
without any further permission from Dove Medical Press Limited, provided the work is properly
attributed. For permission for commercial use of this work, please see paragraphs 4.2 and 5 of our Terms.
© 2019 The Author(s). This work is published and licensed by Dove Medical Press Limited. The
full terms of this license are available at https://www.dovepress.com/terms
and incorporate the Creative Commons Attribution
- Non Commercial (unported, 3.0) License.
By accessing the work you hereby accept the Terms. Non-commercial uses of the work are permitted
without any further permission from Dove Medical Press Limited, provided the work is properly
attributed. For permission for commercial use of this work, please see paragraphs 4.2 and 5 of our Terms.