
Back to Journals » Clinical Ophthalmology » Volume 20
Resting-State fMRI Co-Activation Patterns Reveal Multiscale Brain Functional Alterations in Primary Angle-Closure Glaucoma: Transcriptomic, Cellular, Neurochemical, and Machine-Learning Signatures
Authors Cheng YY, He YZ  , Hu D, Yu FL, Huang X
Received 15 April 2026
Accepted for publication 1 June 2026
Published 7 July 2026 Volume 2026:20 613366
DOI https://doi.org/10.2147/OPTH.S613366
Checked for plagiarism Yes
Review by Single anonymous peer review
Peer reviewer comments 3
Editor who approved publication: Dr Sotiria Palioura
Yu-Yue Cheng1-5,*, Yuan-Zhi He6,*, Die Hu1-5,*, Fang-Liang Yu1-5, Xin Huang1-5
1The Affiliated Eye Hospital, Jiangxi Medical College, Nanchang University, Nanchang, Jiangxi, People’s Republic of China; 2Jiangxi Province Key Laboratory of Ophthalmology and Vision Sciences, Nanchang, Jiangxi, People’s Republic of China; 3Jiangxi Clinical Research Center for Ophthalmic Disease, Nanchang, Jiangxi, People’s Republic of China; 4Jiangxi Provincial Key Laboratory of Vitreoretinal Diseases for Health, Nanchang, Jiangxi, People’s Republic of China; 5School of Ophthalmology and Optometry, Jiangxi Medical College, Nanchang University, Nanchang, Jiangxi, People’s Republic of China; 6Queen Mary School, Jiangxi Medical College, Nanchang University, Nanchang, Jiangxi, People’s Republic of China
*These authors contributed equally to this work
Correspondence: Xin Huang, The Affiliated Eye Hospital, Jiangxi Medical College, Nanchang University, 463 Bayi Avenue, Nanchang, Jiangxi, 330006, People’s Republic of China, Email [email protected]
Background: Primary angle-closure glaucoma (PACG) is increasingly recognized as involving brain alterations beyond the visual pathway, but the dynamic organization of large-scale brain activity and its biological context remain unclear. Co-activation pattern (CAP) analysis can characterize transient brain states and may provide insight into state-specific functional reorganization in PACG.
Methods: Resting-state fMRI data were collected from 44 PACG patients and 57 healthy controls. CAP analysis was performed across multiple frequency bands, and six CAP states were identified. Group differences in CAP temporal dynamics and transition profiles were examined. Spatial associations between CAP-related alterations and normative transcriptomic, cell-type, and neurotransmitter receptor maps were assessed using Allen Human Brain Atlas data, enrichment analyses, cell-type-specific profiling, and receptor/transporter density maps. CAP-derived features were further evaluated using support vector machine–recursive feature elimination and multiple machine-learning classifiers.
Results: PACG patients showed state-specific alterations in CAP dynamics, with increased occurrence, dwell time, fractional occupancy, and self-transition probability of selected CAP states, alongside reduced engagement of complementary states. These altered states were organized into limbic-centered, spatially antithetical configurations involving attention, sensorimotor, and control networks. Imaging–transcriptomic analysis identified a dominant normative transcriptional gradient spatially associated with CAP alterations, involving genes enriched for neuronal excitability and synaptic regulation. Cell-type analyses indicated preferential enrichment in excitatory neurons, inhibitory neurons, and endothelial cells. CAP-related alterations also showed spatial associations with cholinergic, serotonergic, glutamatergic, and synaptic vesicle–related receptor systems. Machine-learning analyses demonstrated modest discriminative performance of CAP-derived features, with relatively high specificity but limited sensitivity.
Conclusion: PACG is associated with state-specific alterations in intrinsic brain dynamics that spatially align with normative molecular, cellular, and neuromodulatory architectures. These findings provide a multiscale, hypothesis-generating framework for understanding brain functional alterations in PACG.
Keywords: primary angle-closure glaucoma, co-activation patterns, dynamic functional connectivity, imaging–transcriptomics, cell-type specificity, neurotransmitter receptors
Introduction
Glaucoma is the leading cause of irreversible blindness worldwide, with the number of affected individuals projected to exceed 110 million by 2040.1 Its core pathological hallmark is the progressive degeneration of retinal ganglion cells (RGCs), which leads to optic disc cupping, thinning of the retinal nerve fiber layer (RNFL), and visual field defects. RGC axonal injury, typically manifested as reduced RNFL thickness, serves as one of the critical structural biomarkers in the early stages of glaucoma.2,3 Increasing evidence suggests that the pathological alterations in glaucoma can extend centrally along the visual pathway.3 Studies utilizing diffusion tensor imaging (DTI) and voxel-based morphometry (VBM) have demonstrated that patients with PACG exhibit a decline in the microstructural integrity of the optic radiation and a reduction in visual cortex volume.4,5 These findings indicate that the disease involves a neurodegenerative process at the level of the central nervous system.
Resting-state functional magnetic resonance imaging (rs-fMRI) characterizes spontaneous low-frequency BOLD signal fluctuations and their temporal correlations across distinct brain regions,6 enabling the non-invasive representation of intrinsic brain functional activity and providing a vital tool for investigating large-scale brain network organization.7 Previous studies have demonstrated that patients with PACG exhibit abnormalities in resting-state functional connectivity (rs-FC) both within the visual network and between visual and non-visual systems, which are associated with clinical indicators such as visual field impairment and disease severity.8–10 Recent rs-fMRI research has indicated that patients with glaucoma display significant functional connectivity abnormalities within the visual network and between visual and non-visual systems.5,11 These changes are accompanied by network topological remodeling associated with visual field defects and structural damage, suggesting that the disease involves systemic-level network reorganization that extends beyond the primary visual pathways.5,8,12 Accumulating studies suggest that large-scale brain networks exhibit highly dynamic activity patterns, characterized by rapid temporal variations across both resting and task-related conditions.Traditional static connectivity approaches are limited in their ability to detect such fast-evolving neural processes.13–15 As a result, examining brain dynamics may yield a more nuanced understanding of network dysfunction and contribute to clarifying the neural basis of PACG.8,14,15 Recent work has increasingly investigated the dynamic temporal structure of large-scale functional brain networks in the context of PACG.8,15 However, most existing studies rely heavily on static functional connectivity measures or dynamic indices derived from sliding-window approaches.14,15 These methods may overlook transient network configurations and their rapid transitions, which could be closely related to the neurodegenerative processes underlying PACG.
CAP analysis provides an alternative framework by directly identifying transient whole-brain co-activation states at a single–time-point scale, without relying on arbitrary time-window parameters.16,17 By avoiding artificial window constraints, CAP enables a refined characterization of dynamic network configurations and their temporal properties, including occurrence rates, dwell times, transition probabilities, and frequency-dependent organizational features. In contrast, traditional static connectivity analyses primarily reflect time-averaged network characteristics, making it difficult to capture intrinsic temporal dynamics of brain activity.14,16 Although sliding-window–based dynamic functional connectivity (dFC) approaches were developed to address this limitation, their temporal resolution remains constrained by window length and signal averaging, thus predominantly reflecting slowly varying, quasi-stationary connectivity patterns.13 Therefore, CAP analysis offers a more precise and state-specific framework for characterizing rapid brain network dynamics and transition behaviors. Modeling dynamic brain network alterations in PACG may provide a systems-level perspective for understanding central nervous system involvement beyond the primary visual pathway. Unlike static functional connectivity, which reflects time-averaged interregional coupling, CAP analysis captures transient whole-brain activation configurations and quantifies their temporal properties, including occurrence rate, dwell time, fractional occupancy, and transition probability. These metrics may help characterize the flexibility, persistence, and switching behavior of intrinsic brain states in PACG. Such state-specific information is useful for examining whether chronic visual dysfunction is associated with altered coordination among visual, attentional, limbic, sensorimotor, and control networks. However, in the present cross-sectional study, CAP-based modeling should be regarded as a hypothesis-generating approach rather than evidence of disease progression or clinical diagnostic utility.
Beyond macro-scale dynamic characterization, accumulating evidence indicates a spatial association between large-scale functional network organization and regional gene expression patterns, suggesting that brain connectivity architecture may be partly related to normative molecular organization.18,19 By integrating CAP-derived spatial patterns with transcriptomic data from the Allen Human Brain Atlas (AHBA), it becomes possible to identify gene expression signatures spatially associated with state-specific network alterations. Such analyses may provide normative biological annotation for the spatial distribution of CAP-related functional alterations, including pathways related to synaptic signaling, axonal processes, and cell-type-associated transcriptional profiles, thereby offering a multiscale context for interpreting brain functional alterations in glaucoma.19 However, while CAP-based analyses effectively capture transient functional states at the network level, this macro-scale perspective does not fully characterize the cell-type-related transcriptional context of local neural activity.20 To further interpret PACG-related brain functional alterations, cell-type-specific transcriptomic analyses offer a high-resolution approach for identifying gene expression signatures associated with specific neuronal and glial populations.21 Neurotransmitter receptors and transporters play a crucial role in maintaining and modulating large-scale brain network organization by influencing synaptic activity, neuronal excitability, and circuit-level plasticity.22,23 Building on CAP state–based analyses, the present study further integrates in vivo spatial distributions of neurotransmitter receptors and transporters derived from positron emission tomography (PET) and single-photon emission computed tomography (SPECT) to examine whether PACG-related CAP alterations spatially correspond to the brain’s normative neurochemical architecture, thereby providing additional normative neurochemical context for interpreting PACG-related functional alterations.24,25
In recent years, machine learning (ML)–based approaches have been increasingly applied in medical imaging research,26 owing to their ability to learn complex patterns from high-dimensional features without relying on predefined assumptions. Rather than serving solely as diagnostic tools, ML models can be leveraged to quantitatively evaluate the discriminative relevance and robustness of imaging-derived features,27 thereby providing complementary evidence to conventional statistical analyses.28 This perspective is particularly relevant for studies of dynamic brain networks, in which disease-related alterations are often subtle, spatially distributed, and state dependent.
In the present study, we employed machine learning to assess the discriminative capacity of features derived from CAP states in PACG.27 To ensure a comprehensive and model-independent evaluation, five supervised learning algorithms—support vector machine (SVM), logistic regression (LR), random forest (RF), light gradient boosting machine (LightGBM), and extreme gradient boosting (XGBoost)—were implemented.26 By integrating both linear and ensemble-based classifiers, we aimed to exploratorily assess whether CAP-derived network features contained group-discriminative information for differentiating PACG patients from healthy controls, thereby providing an objective and automated framework for evaluating state-specific brain network alterations.
Taken together, accumulating evidence suggests that PACG is associated with dynamic and state-dependent alterations in large-scale brain networks that cannot be fully captured by conventional static analyses.29 CAP analysis provides a useful framework for characterizing transient brain states and their temporal organization. Beyond macro-scale network dynamics, integrating CAP-derived features with normative transcriptomic, cellular, and neurochemical information may provide multiscale biological context for interpreting PACG-related brain functional alterations.30,31 In this context, machine learning offers an exploratory data-driven approach to evaluate whether state-specific network features contain group-discriminative information. Accordingly, the present study combines CAP analysis, multilevel normative biological annotation, and exploratory machine-learning analysis to characterize state-specific brain network alterations in primary angle-closure glaucoma.
Methods and Materials
Participants
A total of 44 patients diagnosed with PACG and 57 age, sex, and education-matched healthy controls (HCs) were recruited for this study. This study was performed in compliance with the principles of the Declaration of Helsinki and was approved by the institutional ethics committee. All participants were fully informed about the purpose, procedures, and potential risks of the study, and written informed consent was obtained from each participant prior to enrollment. The inclusion criteria for PACG patients were as follows: (1) bilateral narrow anterior chamber angles, confirmed by gonioscopy; (2) characteristic optic disc changes, such as a cup-to-disc ratio (C/D) greater than 0.6; (3) glaucomatous visual field defects, characterized by scotomas or tubular vision loss; and (4) no prior history of glaucoma surgery or significant ocular diseases.
The exclusion criteria for PACG patients included: (1) a history of primary open-angle glaucoma or secondary glaucoma; (2) other co-existing ophthalmological diseases; (3) a history of neurological or psychiatric disorders; (4) contraindications for MRI scanning (eg, metallic implants or pregnancy); (5) high myopia or hyperopia exceeding ±6.00 diopters (D); and (6) the presence of acute PACG symptoms during the time of scanning.
Healthy controls were required to meet the following inclusion criteria: (1) no history of glaucoma or other ophthalmological diseases; (2) normal visual acuity, defined as uncorrected or corrected visual acuity > 1.0; (3) no abnormalities on structural brain MRI; (4) no history of neurological or psychiatric disorders; and (5) no contraindications to MRI scanning.
Healthy controls were excluded if they met any of the following criteria: (1) severe myopia or hyperopia, defined as a spherical equivalent exceeding ±6.00 D; (2) any ocular disease, including glaucoma, strabismus, retinal disease, optic neuropathy, or other clinically significant ophthalmological abnormalities; (3) major neurological or psychiatric disorders, including epilepsy, stroke, depression, or long-term use of neuroactive medications; (4) clinically significant structural brain abnormalities detected on MRI; or (5) contraindications to MRI scanning, such as metallic implants, pacemakers, pregnancy, or severe claustrophobia.
Data Acquisition
Data acquisition was conducted in the MRI suite of a provincial Grade III Level A hospital using a 3.0-Tesla MRI scanner (Discovery MR 750W system; GE Healthcare, Milwaukee, WI, USA). Participants were positioned in a supine position and wore earplugs to reduce acoustic noise by approximately 32 dB, with their heads secured by foam padding to minimize motion artifacts. During scanning, participants were instructed to keep their eyes closed, remain still, stay awake, and avoid focusing on specific thoughts or making head movements. The rs-fMRI data were acquired over a duration of 450 seconds, resulting in a total of 225 volumes. To ensure data quality and exclude potential structural brain pathology, sagittal T1-weighted imaging and axial T2-FLAIR (fluid-attenuated inversion recovery) sequences were also performed in addition to the rs-fMRI data. T1-weighted images provided high-resolution anatomical brain structures to ensure precise registration between functional data and brain morphology. The FLAIR sequence facilitated the detection and exclusion of possible brain lesions, thereby ensuring the validity and accuracy of the final results. In the present study, only MRI data were acquired from the enrolled participants; transcriptomic, cell-type, and neurochemical analyses were performed using external normative atlases and integrated with group-level CAP-related spatial maps.
Imaging Data Preprocessing
Data preprocessing was performed using the DPABI software (http://rfmri.org/dpabi) within the MATLAB R2018b environment.32 Initially, the raw DICOM format data were converted to NIFTI format. The first ten time points of each scan were discarded to mitigate initial artifacts caused by magnetic field instability. Subsequently, slice-timing correction was conducted by aligning the acquisition times of adjacent slices to eliminate temporal inconsistencies. To further mitigate motion artifacts, motion correction was applied using 24 head-motion parameters. Participants whose data exhibited translation exceeding 2 mm or rotation exceeding 2° were excluded to ensure that the impact of head motion on the analysis results was minimized. Additionally, the mean framewise displacement (FD) was calculated for all subjects to assess voxel-level motion amplitude,33 providing further control over potential motion artifacts. Structural images were segmented using the DARTEL (Diffeomorphic Anatomical Registration Through Exponentiated Lie Algebra) method to generate a high-quality anatomical template.34 Subsequently, functional images were registered to the MNI (Montreal Neurological Institute) standard space with a resampled resolution of 3 times 3 times 3 mm. To enhance the signal-to-noise ratio, Gaussian smoothing with a 6 times 6 times 6 mm full-width at half-maximum (FWHM) kernel was applied to mitigate spatial noise.Furthermore, linear detrending was performed to remove systematic signal drifts.35–38 Nuisance regression was conducted using head-motion parameters and the global signal as covariates to further suppress non-neuronal interference, ensuring the robustness of subsequent analyses. The rs-fMRI data underwent band-pass filtering across multiple frequency ranges: the full frequency band (0.01–0.08 Hz), the slow-5 band (0.01–0.027 Hz), the slow-4 band (0.027–0.073 Hz), the slow-3 band (0.073–0.198 Hz), and the slow-2 band (0.198–0.25 Hz).39 The full band captures the synchronization of spontaneous low-frequency brain activity. The slow-5 band is primarily associated with the resting-state activity of the default mode network (DMN), while the slow-4 band reflects low-frequency cortical oscillations, particularly prominent in visual processing and perceptual regions. The slow-3 band is linked to executive functions and motor control tasks, and the slow-2 band involves motor regulation and cognitive processing, especially during rapid response behaviors. This comprehensive filtering process effectively removed high- and low-frequency noise induced by physiological factors such as cardiac and respiratory cycles, ensuring that the analysis remained focused on low-frequency fluctuations related to intrinsic brain activity, thereby significantly enhancing the signal-to-noise ratio (SNR) for subsequent investigations.40
To characterize the spatial and temporal properties of CAPs across the typical frequency range and its respective sub-bands, we utilized a whole-brain framework comprising 408 regions of interest (ROIs), consisting of 400 cortical parcels and 8 subcortical nodes.41,42 The 400 cortical ROIs are organized into seven canonical functional networks: the visual network (VN), somatomotor network (SMN), dorsal attention network (DAN), ventral attention network (VAN), limbic network, fronto-parietal network (FPN), and default mode network (DMN).
CAP Analysis
ROI-wise seed-based whole-brain CAP analysis was performed in MATLAB using custom scripts from the TbCAPs toolbox.42 Briefly, for each participant and each frequency band, the preprocessed four-dimensional fMRI data were represented as a series of three-dimensional whole-brain volumes across time. Each fMRI volume corresponded to one time frame and was treated as a whole-brain activation pattern for CAP analysis, thereby preserving temporal information rather than averaging the signal across time. Functional regions of interest derived from the parcellation scheme were used as seed regions to characterize ROI-wise CAP-related whole-brain co-activation patterns.
To identify CAP states, a time-clustering-based CAP procedure was conducted at the cohort level. Specifically, for each frequency band, fMRI frames from all participants, including both PACG patients and healthy controls, were pooled together and entered into the clustering analysis, rather than performing clustering separately for each individual. This cohort-level strategy was used to define a common CAP state space shared by all participants, thereby ensuring that group comparisons of CAP dynamic metrics were based on the same set of CAP templates. Each frame was represented as a whole-brain spatial activation pattern, and k-means clustering was then applied to these pooled frames to identify recurring co-activation patterns.
Here, k denotes the predefined number of clusters in the k-means algorithm, corresponding to the number of CAP states to be identified. To determine the optimal number of CAP states, the number of clusters was evaluated from k=2 to k=20. For each k, the clustering procedure was repeated 100 times using different initial cluster centers to improve clustering stability. Silhouette scores were calculated to assess clustering quality, and the optimal number of clusters was determined as k=6. The final six cluster centroids were therefore interpreted as cohort-level CAP states.
After the six cohort-level CAP states were identified, individual-level CAP dynamic metrics were calculated by assigning each participant’s time frames to these common CAP states. This procedure ensured that all participants were characterized within the same CAP state space, allowing between-group comparisons of CAP temporal properties, including occurrence, dwell time, fractional occupancy, stability, and transition probability.
CAP Characterization and Statistical Comparison
The Schaefer 2018 atlas was employed to parcellate the whole brain into 400 functionally defined ROIs. This atlas is based on functional connectivity and anatomical constraints, ensuring cross-individual comparability. To maintain spatial consistency between the atlas and the fMRI data, the atlas was resampled to match the spatial resolution of the functional images (3 mm isotropic).Independent two-sample t-tests were conducted at the regional level to evaluate group differences between PACG patients and healthy controls. The resulting t-statistics were used to characterize the spatial distribution of CAP-related alterations across the whole brain. In the present study, six robust CAP states were used to compare CAP organization between the typical frequency range and frequency sub-bands.
Dynamic CAP Metrics
To characterize the temporal dynamics of the identified CAP states, five dynamic metrics were computed for each participant.(1) Counts quantified the total number of occurrences of each CAP state during the entire scanning session.(2) Fractional occupancy represented the proportion of time that each CAP state occupied relative to the total time series.(3) Persistence measured the average duration that a CAP state remained active before transitioning to another state, reflecting the inherent temporal stability of the state.(4) Stability denoted the probability of the brain remaining in the same CAP state, which was derived from the diagonal elements of the transition probability matrix.(5) Transition probability quantified the likelihood of switching between CAP states, describing the probability of transitioning from one specific CAP state to another.
Statistical Analysis
Statistical analyses were performed using SPSS version 25.0 (SPSS Inc., Chicago, IL, USA) and the GRETNA toolbox.43 Continuous variables were reported as mean ± standard deviation (SD) and compared between PACG patients and healthy controls using independent-sample t-tests. Categorical variables were summarized as frequencies and compared using chi-square tests.
Group-level differences in CAP dynamic metrics, including occurrence rate, fractional occupancy, and mean dwell time, were assessed using independent two-sample t-tests between PACG patients and healthy controls for each CAP state. To control for multiple comparisons, false discovery rate (FDR) correction was applied across the six CAP states within each dynamic metric. FDR-corrected p-values are reported in Table 1, with statistical significance defined as FDR-corrected p < 0.05.
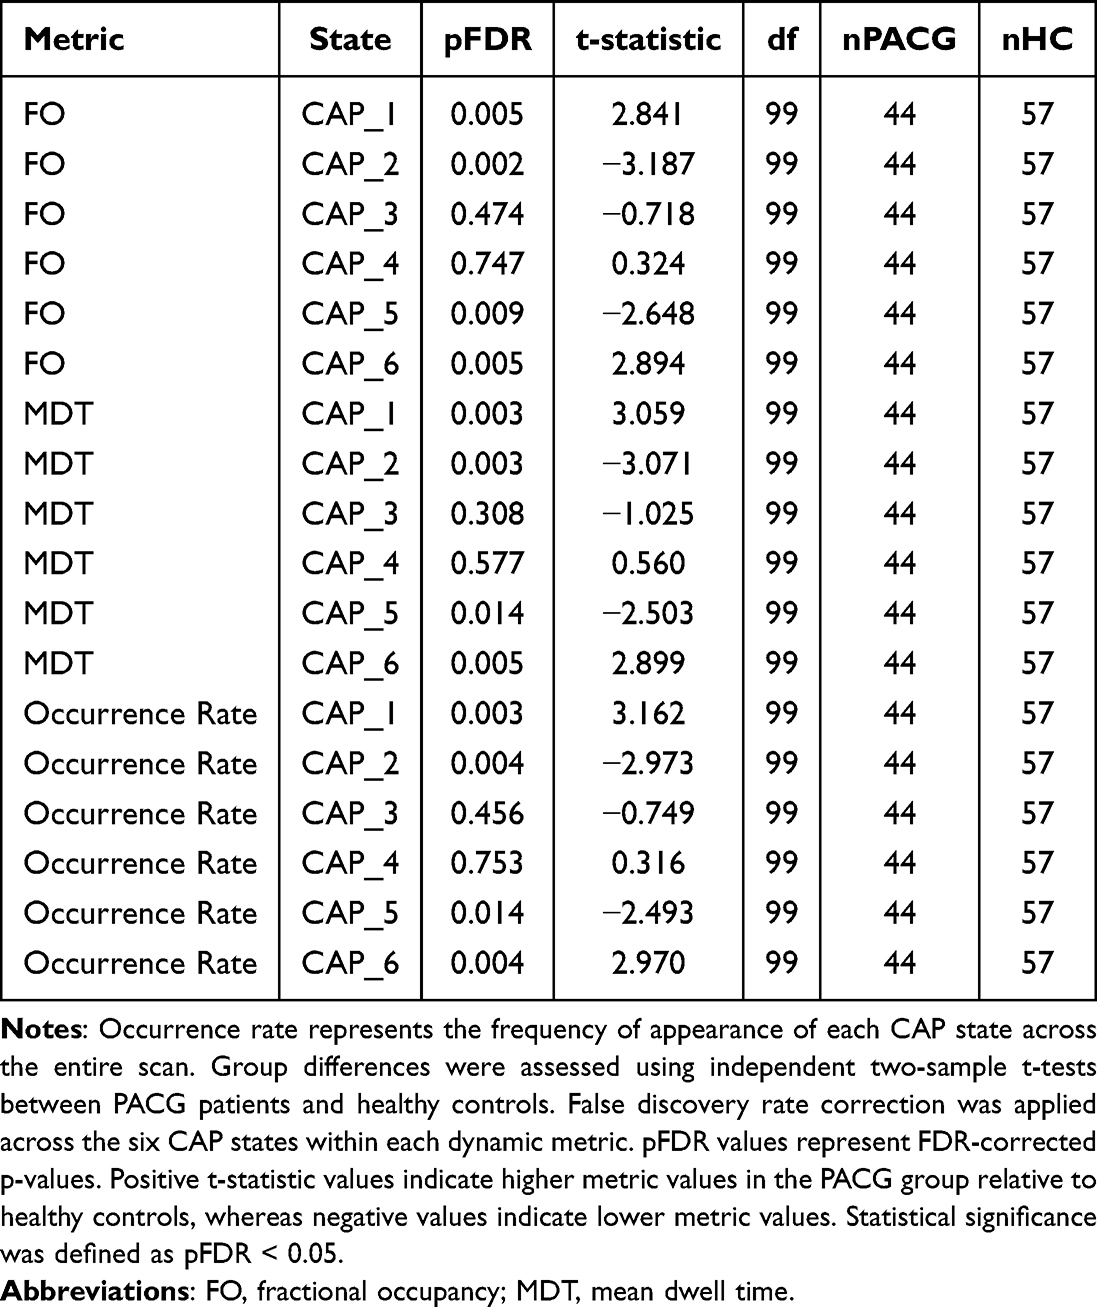 |
Table 1 Group Comparisons of CAP Dynamic Metrics Between PACG Patients and Healthy Controls After FDR Correction |
In addition, non-parametric permutation tests with 5,000 iterations were conducted to compare transition probabilities between CAP states. This approach estimated statistical significance by constructing a null distribution of group differences in transition probabilities, providing a non-parametric assessment of CAP transition alterations.
Calculation of Regional Gene Expression
To provide biological context for PACG-related functional alterations, we examined their spatial associations with normative transcriptomic, cellular, and neurochemical maps. These biological features were included because regional gene expression, cellular composition, and neurotransmitter receptor/transporter distributions are closely related to intrinsic brain activity, synaptic signaling, cortical excitability, and large-scale functional organization. This analysis was therefore designed to evaluate whether PACG-related functional alterations were spatially aligned with the intrinsic biological architecture of the human brain, rather than to infer direct causal mechanisms.
To provide normative transcriptomic annotation for the spatial distribution of CAP-related functional alterations in PACG, regional transcriptomic data were obtained from the Allen Human Brain Atlas (AHBA),44 which comprises comprehensive gene expression profiles from 3,702 postmortem tissue samples collected from six neurologically healthy donors. The abagen toolbox was used to map these transcriptomic data onto the 400-region cortical parcellation, enabling the integration of normative microscale gene expression information with macroscale functional brain dynamics. Transcriptomic preprocessing followed a standardized and validated pipeline. Briefly, probe annotations were updated, and samples with low expression intensity were excluded to improve the signal-to-noise ratio. For each gene, a representative probe was selected, and tissue samples were assigned to their corresponding anatomical regions, with missing values imputed when necessary. The expression data were then normalized across samples. Genes exhibiting consistent spatial expression patterns across donors were retained for further analysis, resulting in a final transcriptomic matrix comprising 15,633 genes across 400 brain regions. This region-wise gene expression framework was subsequently correlated with CAP state–related metrics to identify normative gene expression patterns spatially associated with CAP-related functional alterations in PACG.
PLS-Based Imaging-Transcriptomic Association Analysis
For the imaging–transcriptomic analysis, the imaging phenotype was defined as the regional PACG-versus-HC t-statistic map derived from CAP State 1 in the typical frequency band (0.01–0.08 Hz). This map reflected regional group differences in CAP-related signal variance across the 400 cortical parcels and was selected for downstream PLS analysis because State 1 showed significant group differences in CAP dynamic metrics and represented a key altered CAP configuration in PACG. To assess spatial associations between normative regional transcriptional profiles and the spatial distribution of CAP-related alterations, partial least squares (PLS) regression was performed. The response variable (Y) consisted of the case–control t-statistic map across 400 cortical regions, which quantified group-level differences in CAP metrics. Predictor variables (X) were defined as the AHBA-derived regional gene expression matrix comprising 15,633 genes across the same 400 regions. Prior to analysis, both imaging-derived and transcriptomic data were Z-score normalized.
PLS decomposition was used to identify latent components that maximized the covariance between spatial gene expression patterns and CAP-related alterations. Given that the first PLS component (PLS1) explained the largest proportion of variance in the CAP t-map, subsequent analyses focused on this component. The spatial correspondence between PLS1 gene scores and CAP t-values was quantified using Pearson correlation. Statistical significance was assessed by comparing the observed correlation against a null distribution generated from 1,000 spatial permutation (spin) tests,45 which preserved the intrinsic spatial autocorrelation of the 400-region cortical parcellation.
To determine the contribution of individual genes to the PLS1 component, a bootstrapping procedure was applied to estimate the stability of gene weights and convert them into Z-scores. Genes with extreme positive or negative Z-scores were identified as genes with high contributions to the CAP-associated transcriptional gradient. For visualization purposes, normalized expression maps of representative genes with the highest positive and negative loadings were projected onto the cortical surface to illustrate the spatial correspondence between molecular gradients and regional functional alterations in PACG.
Enrichment Analysis
Functional characterization and pathway enrichment analyses of CAP-associated genes were performed using Metascape (https://metascape.org/), integrating annotations from the Gene Ontology (GO), KEGG, and Reactome databases.46 Enrichment results were identified based on statistical significance and functional clustering, with the false discovery rate (FDR) set at 1%. Analyses were conducted separately for gene sets with positive and negative weights derived from the PLS1, which represents the dominant transcriptomic pattern associated with CAP-related alterations.
In addition, these CAP-associated gene sets were compared with susceptibility genes implicated in neurological and psychiatric disorders from large-scale genome-wide association studies (GWAS) to further assess their disease relevance. PLS1 was selected for downstream functional and enrichment analyses because it demonstrated greater stability in gene weight distribution compared with higher-order components and captured the largest covariance between regional gene expression profiles and CAP-related spatial alterations.
Cell-Type–Specific Transcriptomic Analysis of CAP-Related Alterations
To further characterize the cell-type-related transcriptomic context of the observed imaging–transcriptomic spatial associations, genes with significant contributions to the first PLS component (PLS1) were deconvoluted into seven canonical brain cell types—astrocytes, endothelial cells, microglia, excitatory neurons, inhibitory neurons, oligodendrocytes, and oligodendrocyte precursor cells (OPCs)—using the reference framework established by Seidlitz et al. Analyses were conducted separately for gene sets with positive and negative PLS1 weights to characterize cellular signatures that were either spatially aligned with or inversely related to CAP-associated alterations in PACG.47 Statistical significance of cell-type enrichment was assessed using permutation testing by comparing observed associations against a null distribution. All p-values were corrected for multiple comparisons using the false discovery rate (FDR) method, with significance defined at p < 0.05. This bidirectional analysis provided cell-type-related annotation of the normative transcriptomic gradients spatially associated with macro-scale CAP-related functional alterations in PACG.
Spatial Correlation Between CAP Alterations and Neurotransmitter Receptor Distributions
Spatial correspondence analysis was conducted using the JuSpace toolbox to examine neurochemical substrates associated with CAP alterations. Thirteen normative maps of neurotransmitter receptor and transporter densities were used, including cerebral blood flow (CBF), kappa opioid receptor (KOR), mu opioid receptor (MOR), and others. CAP State 1 t-statistic map derived from the PACG–control comparison served as the imaging phenotype.Spearman’s rank correlation coefficients were computed to quantify spatial associations between CAP alterations and neurotransmitter distributions.48 Spatial autocorrelation biases were addressed using spatial permutation procedures. Statistical significance was assessed using these null models, with p-values corrected for multiple comparisons via Bonferroni adjustment.
Feature Selection and Machine Learning Classification Based on CAP-Derived Feature
To identify discriminative brain regions associated with primary angle-closure glaucoma (PACG) based on CAP-derived spatial features, support vector machine–recursive feature elimination (SVM-RFE) was applied for feature selection. Feature vectors with 400 dimensions, corresponding to regions defined by the Schaefer 2018 atlas, were Z-score normalized prior to model training.The SVM-RFE procedure employed a linear SVM to rank features according to the squared magnitude of their weight coefficients, with the least informative features iteratively removed. To avoid information leakage and enhance generalizability, feature selection was conducted within a nested cross-validation framework,49 comprising a 5-fold inner loop and a 10-fold outer loop. Feature stability across folds was evaluated, and the top 10 brain regions that consistently contributed most to classification performance were retained for subsequent analyses.These selected CAP-derived features were then used as inputs for five supervised machine learning classifiers, including SVM, RF, LR, XGBoost, and LightGBM. All models were trained and evaluated within the same nested cross-validation framework, with hyperparameters optimized using grid search. Classification performance was assessed using accuracy, sensitivity, specificity, and the area under the receiver operating characteristic curve (AUC).
Results
Demographics and Clinical Characteristics
There were no significant differences between the PACG group and healthy controls in gender distribution (p = 0.9303) or age (p = 0.1642). As expected, the PACG group showed significantly higher intraocular pressure than healthy controls (p < 0.001). Detailed demographic and clinical characteristics are presented in Table 2.
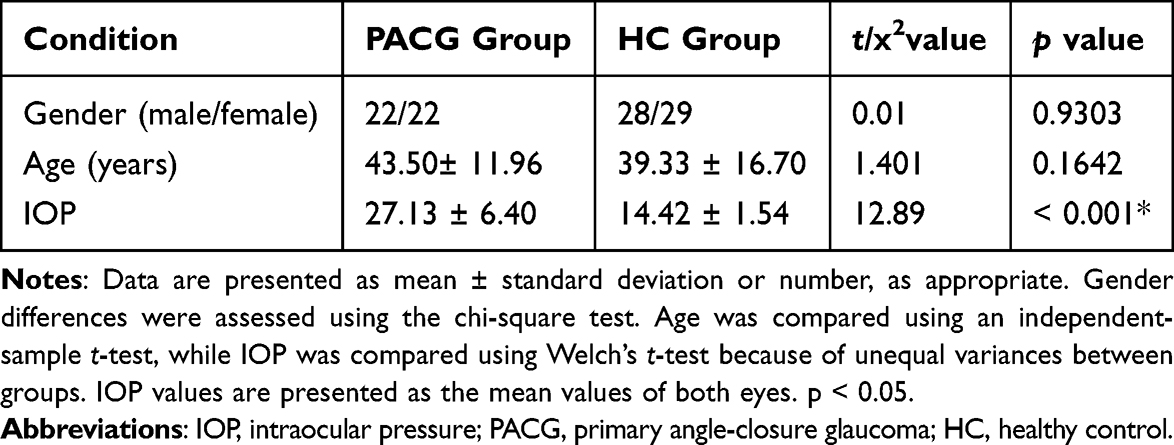 |
Table 2 Demographic and Clinical Data of Participants |
Altered Dynamic Properties of CAP States in PACG
CAP analysis was performed across the typical frequency range (0.01–0.08 Hz) and four sub-bands (slow-5 to slow-2) using a cohort-level clustering strategy that included both PACG patients and healthy controls. Six cohort-level CAP states were identified and organized into three spatially antithetical functional clusters: LIM–DAN–VAN (State 1–2), LIM–DAN–SMN (State 3–4), and LIM–VAN–FPN (State 5–6) (Figure 1).Although each pair of CAP states shared a similar set of dominant functional networks, the two states within each cluster exhibited spatially opposing activation patterns across these networks. Specifically, the antithetical organization reflected inverse co-activation and deactivation configurations among the involved networks, indicating distinct dynamic configurations within the same network ensemble.
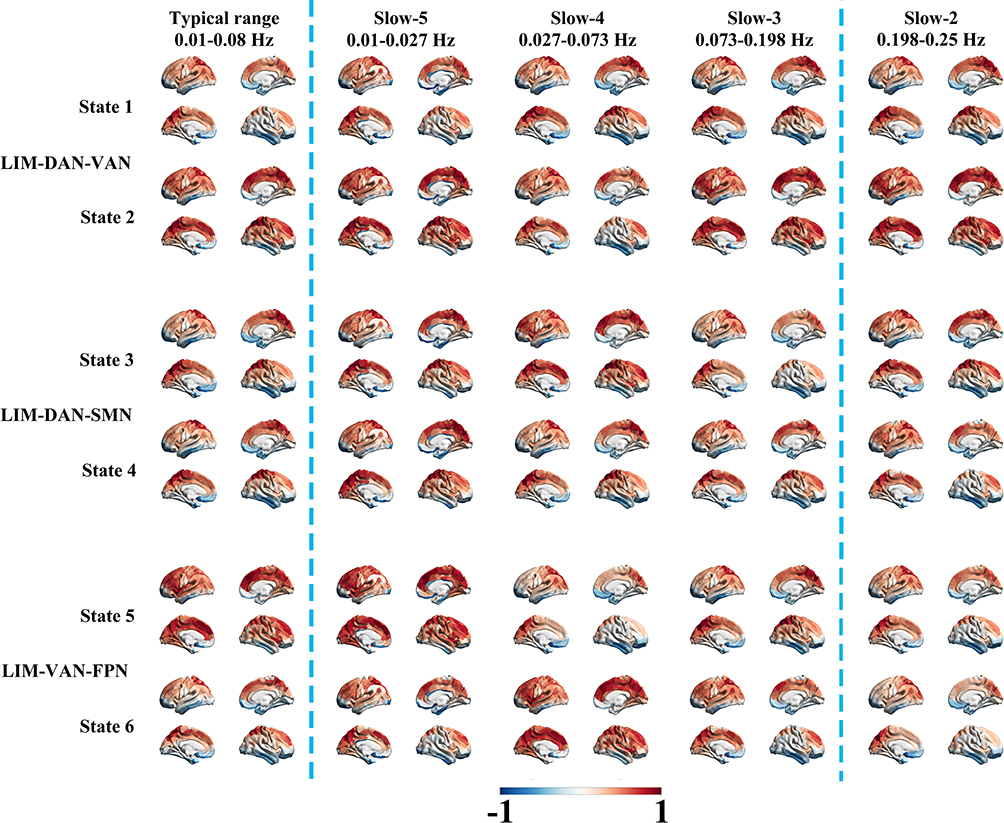 |
Figure 1 Topological patterns of six CAP states across different frequency bands. The first column displays six CAP states identified within the typical range (0.01–0.08Hz), organized into three spatially antithetical pairs with mirrored coactivation profiles. The subsequent four columns represent the corresponding CAP states across frequency sub-bands from slow-5 to slow-2. Standardized activation levels (Z) for each ROI quantify the magnitude of deviation from the baseline (Z = 0). Warm colors indicate BOLD responses relatively stronger than the baseline amplitude, while cold colors represent relatively weaker or negative activation. Abbreviations: DAN, dorsal attention network; FPN, frontoparietal network; LIM, limbic network; SMN, somatomotor network; VAN, ventral attention network. |
Group differences in the occurrence rates of CAP states are summarized in Figure 2A. Significant alterations in occurrence were observed in four of the six CAP states. Compared with healthy controls, PACG patients exhibited significantly increased occurrence rates for CAP 1 (p = 0.0021, t = 3.16) and CAP 6 (p = 0.0037, t = 2.97). In contrast, the occurrence rates of CAP 2 (p = 0.0037, t = −2.97) and CAP 5 (p = 0.0143, t = −2.49) were significantly reduced in the PACG group. No significant group differences were detected for CAP 3 (p = 0.456) or CAP 4 (p = 0.753).Group differences in mean dwell time (MDT) across CAP states are shown in Figure 2B. Significant alterations in MDT were observed in four CAP states. Compared with healthy controls, PACG patients exhibited significantly prolonged MDT for CAP 1 (p = 0.0028, t = 3.05) and CAP 6 (p = 0.0046, t = 2.90), indicating increased temporal persistence of these states. In contrast, MDT was significantly reduced for CAP 2 (p = 0.0028, t = −3.07) and CAP 5 (p = 0.0140, t = −2.50) in the PACG group. No significant group differences in MDT were detected for CAP 3 (p = 0.308) or CAP 4 (p = 0.577).Group differences in fractional occupancy (FO) across CAP states are shown in Figure 2C. Significant alterations in FO were observed in four of the six CAP states. Compared with healthy controls, PACG patients demonstrated significantly increased FO for CAP 1 (p = 0.0055, t = 2.84) and CAP 6 (p = 0.0047, t = 2.89), indicating that a greater proportion of total scan time was spent in these states. In contrast, FO was significantly reduced for CAP 2 (p = 0.0019, t = −3.19) and CAP 5 (p = 0.0094, t = −2.65) in the PACG group. No significant group differences in FO were detected for CAP 3 (p = 0.4741) or CAP 4 (p = 0.7467).The statistical results are detailed in Table 1.Group-level state-to-state transition probability matrices for PACG patients and healthy controls are shown in Figure 2D. In both groups, transitions were dominated by self-transitions (diagonal elements), indicating that each CAP state tended to persist across consecutive time points. However, marked group differences were observed in the strength of these self-transition probabilities.Compared with healthy controls, PACG patients exhibited significantly increased self-transition probabilities for CAP 1 (+0.28) and CAP 6 (+0.14), indicating enhanced state stability in these two CAP states. In contrast, self-transition probabilities were significantly reduced for CAP 2 (−0.23) and CAP 5 (−0.15) in the PACG group, reflecting decreased temporal stability of these states. No significant group differences were detected for self-transitions in CAP 3 or CAP 4.Overall, the difference matrix (PACG − HC) revealed a bidirectional alteration of CAP transition dynamics characterized by increased persistence of selected CAP states and reduced stability of others, suggesting altered patterns of state maintenance and switching in PACG.
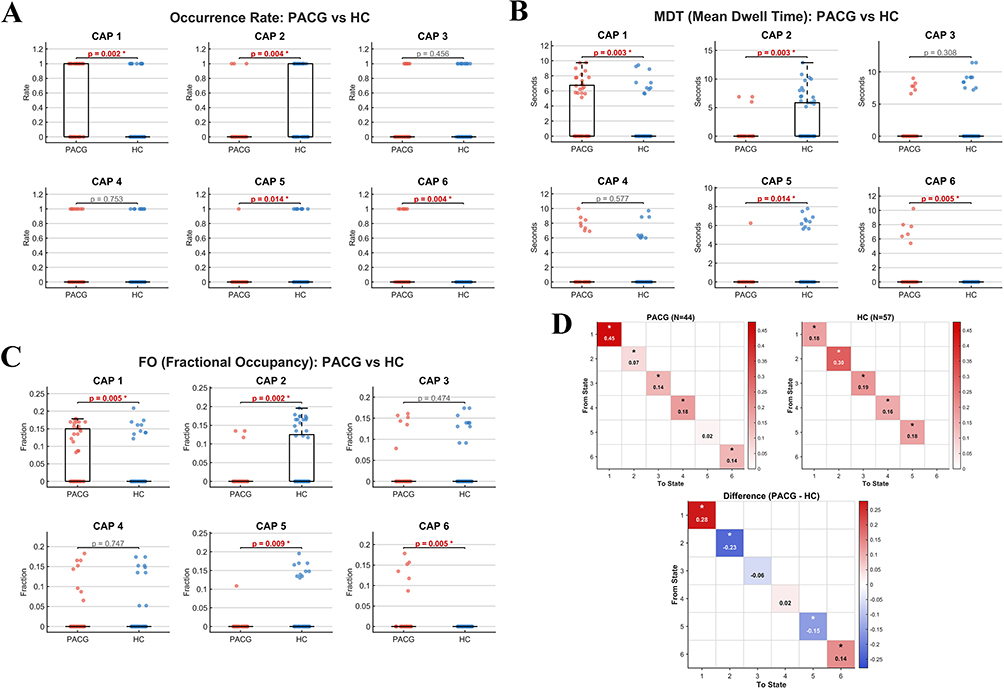 |
Figure 2 Temporal dynamics and transition profiles of CAP states in PACG. (A) Occurrence rates of six CAP states in PACG and healthy control (HC) groups. Inter-group statistical p-values are indicated, with specific activation patterns exhibiting differential frequency between groups. (B) Mean dwell time (MDT) for each CAP state. This metric quantifies the average continuous duration of occupancy in seconds for each functional state across the study populations. (C) Fractional occupancy (FO) across the six CAP states. Values represent the proportion of total scan time spent in each specific activation pattern, with group-wise statistical variations indicated by p-values. (D) State-to-state transition probabilities for PACG and HC groups. Altered shifting patterns between functional states are identified through group-wise differences. Color intensity represents the magnitude and direction of the change in transition probability between specific state pairs. Notes: * indicates statistically significant between-group differences at p < 0.05, including transition probabilities in (D). |
Imaging–Transcriptomic Associations and Functional Enrichment of CAP-Related Alterations
The CAP State 1 t-statistic map used for PLS analysis was derived from regional PACG-versus-HC differences in CAP State 1 within the typical frequency band (0.01–0.08 Hz).PLS regression was performed to examine normative transcriptional patterns spatially associated with CAP-related functional alterations by linking regional PACG-versus-HC t-values from the CAP State 1 t-statistic map with cortical gene expression profiles derived from the Allen Human Brain Atlas. A null distribution of PLS1-weighted Z-scores was generated using 1,000 spatial permutation (spin) tests to assess statistical significance (Figure 3A). PLS1 scores were positively correlated with State 1 co-activation values across cortical regions (R = 0.44, P < 0.001; Figure 3B), indicating that the two measures showed a similar spatial trend across cortical regions. Spatial maps of State 1 co-activation and PLS1 scores are shown to illustrate their cortical distribution patterns (Figure 3C). Genes were ranked according to their PLS1 loadings, identifying genes with high positive and negative PLS1 loadings with strong positive weights, including GPCPD1, KCNAB3, FGF9, and SCRT1, as well as strong negative weights, such as NKAIN4, KCNN3, DPYSL3, and SCN9A (Figure 3D).
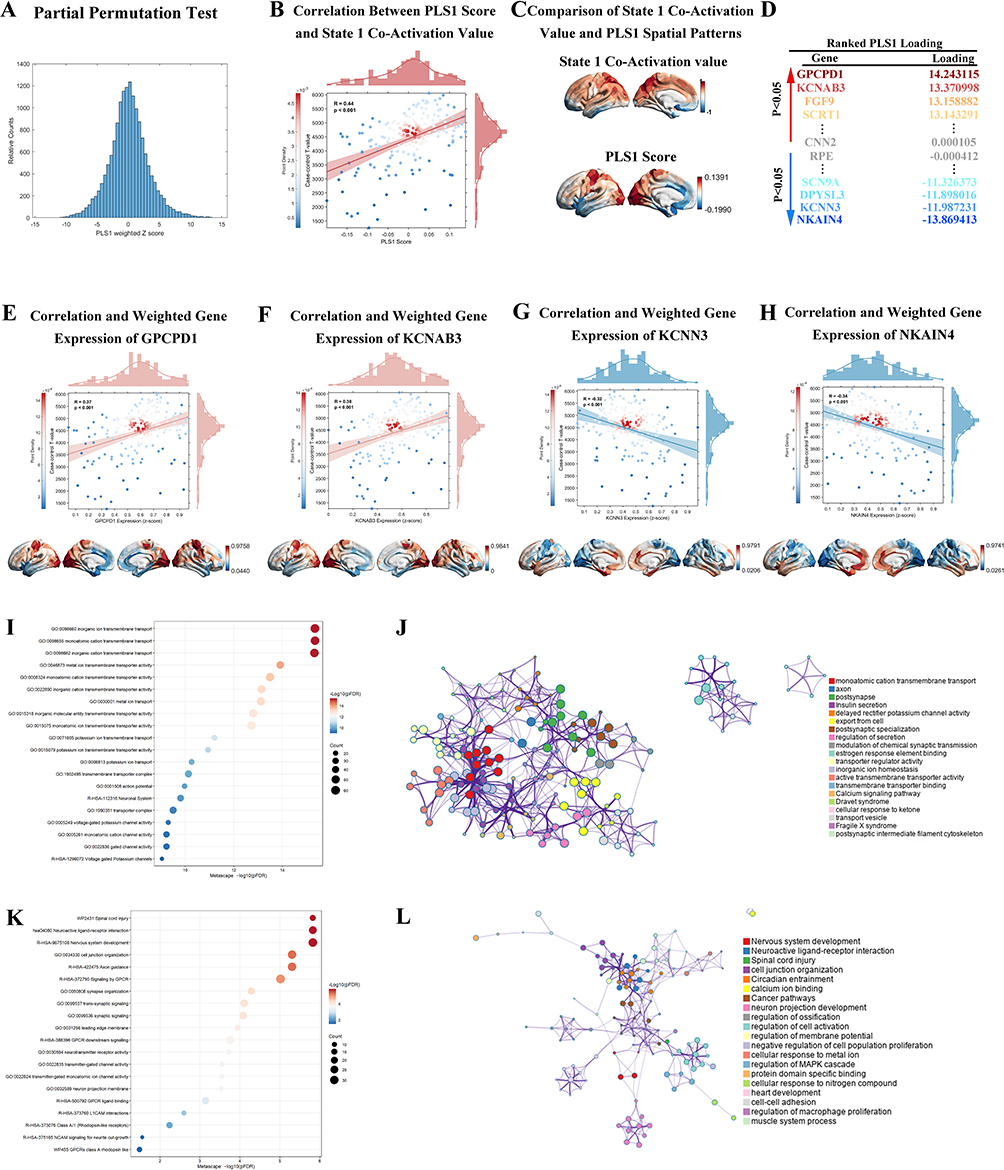 |
Figure 3 Partial least squares (PLS) regression and transcriptomic-CAP association profiles. (A) Null distribution of PLS1-weighted Z-scores derived from 1,000 spatial permutation tests, providing the statistical reference for associations between regional gene expression and CAP-related functional alterations. (B) Spatial correlation between PLS1 scores and State 1 CAP-related t-values across cortical regions (R = 0.44, P < 0.001). (C) Side-by-side visualization of the State 1 co-activation map and the PLS1 score map. (D) Ranking of genes based on PLS1 loadings, identifying primary contributors with strong positive (e.g., GPCPD1, KCNAB3, FGF9, SCRT1) and negative (e.g., NKAIN4, KCNN3, DPYSL3, SCN9A) weights. (E–H) Regional associations with CAP alterations for (E) GPCPD1 (R = 0.37, P < 0.001), (F) KCNAB3 (R = 0.33, P < 0.001), (G) KCNN3 (R = −0.32, P < 0.001), and (H) NKAIN4 (R = −0.34, P < 0.001). Cortical maps display Z-score normalized expression gradients across specific regions including the occipital and temporal lobes, where color intensity represents the alignment with disease-related functional alterations.(I and J) Functional enrichment for genes with positive PLS1 loadings (PLS1+), including (I) a ranking of Gene Ontology (GO) terms by -log_10P significance and associated gene counts, and (J) functional interaction profiles where colors signify biological categories and connectivity represents functional overlap or semantic similarity. (K and L) Functional enrichment for genes with negative PLS1 loadings (PLS1−), including (K) the distribution of enriched biological pathways by statistical significance and associated gene counts, and (L) functional convergence across categories through category-dependent coloring and similarity-based connectivity. |
To further illustrate the spatial correspondence between gene expression and CAP-related alterations, representative genes from both ends of the PLS1 spectrum were examined. Regional expression levels of GPCPD1 (R = 0.37, P < 0.001) and KCNAB3 (R = 0.33, P < 0.001) were positively associated with CAP-related alterations, whereas KCNN3 (R = −0.32, P < 0.001) and NKAIN4 (R = −0.34, P < 0.001) showed inverse associations (Figure 3E–H). Functional enrichment analysis demonstrated distinct biological signatures for genes with positive and negative PLS1 loadings. Genes with positive PLS1 loadings (PLS1+) were significantly enriched in Gene Ontology terms related to ion transmembrane transport and channel activity, as reflected by the ranking of enriched GO terms based on statistical significance (Figure 3I). Functional interaction analysis further revealed that these enriched terms formed a highly interconnected network, indicating shared biological functions and semantic similarity (Figure 3J). In contrast, genes with negative PLS1 loadings (PLS1−) were enriched in biological pathways associated with synaptic organization, neurodevelopmental processes, and receptor-mediated signaling, with pathway enrichment summarized according to statistical significance (Figure 3K). Network-based convergence analysis illustrated functional clustering across these categories, highlighting coordinated regulation at the synaptic and network levels (Figure 3L).
Cell-Type–Specific Transcriptomic and Intercellular Network Characteristics of PACG-Related CAP State 1 Alterations
To characterize the cellular and intercellular transcriptomic features associated with CAP-related low-frequency signal variance, cell-type–specific analyses were performed based on CAP State 1 t-statistic map in the 0.01–0.08 Hz band derived from the typical-range CAP state (State 1). Cortical surface mapping of this regional metric across 400 brain regions revealed distinct spatial distributions when projected onto seven canonical brain cell types, including astrocytes, endothelial cells, microglia, excitatory neurons, inhibitory neurons, oligodendrocytes, and oligodendrocyte precursor cells (Figure 4A).Quantitative overlap analysis demonstrated that genes associated with State 1–related 0.01–0.08 Hz signal variance exhibited selective enrichment across cell types (Figure 4B). After FDR correction, statistically significant enrichment was observed in endothelial cells, excitatory neurons, and inhibitory neurons, whereas no significant overlap was detected in astrocytes, microglia, oligodendrocytes, or oligodendrocyte precursor cells, indicating preferential cellular involvement in CAP-related functional dynamics.Functional enrichment analysis further revealed distinct biological process profiles across cell types (Figure 4C). Gene Ontology analysis highlighted enrichment of processes related to inorganic cation and ion transmembrane transport, calcium signaling, synapse organization, postsynaptic membrane components, cell junction assembly, and neuronal system–related pathways, reflecting functional heterogeneity associated with low-frequency signal alterations during the typical-range CAP state.To assess intercellular relationships, gene-level overlap and functional similarity networks were constructed based on shared CAP-associated genes (Figure 4D and E). Gene-level overlap analysis revealed pronounced sharing of CAP-associated genes primarily among excitatory neurons, inhibitory neurons, and endothelial cells, with excitatory neurons exhibiting the highest degree of connectivity. In contrast, functional similarity analysis demonstrated broader convergence of Gene Ontology biological processes across multiple cell types, indicating coordinated functional programs despite limited overlap at the individual gene level.
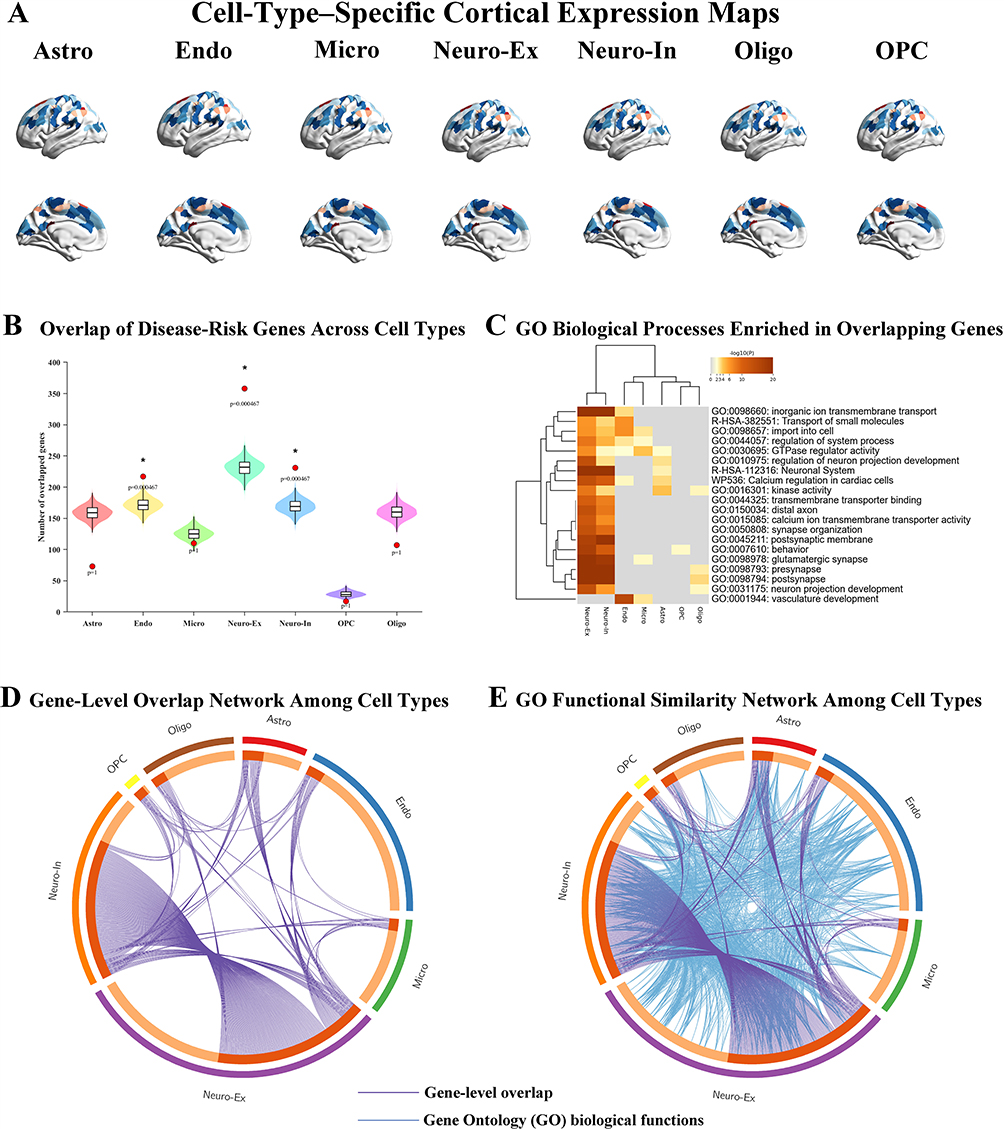 |
Figure 4 Cell-type–specific transcriptomic signatures associated with CAP-related signal variance. (A) Cortical surface maps illustrate the regional distribution of the 0.01–0.08 Hz signal variance, mapped onto seven canonical brain cell types, including astrocytes (Astro), endothelial cells (Endo), microglia (Micro), excitatory neurons (Neuro-Ex), inhibitory neurons (Neuro-In), oligodendrocytes (Oligo), and oligodendrocyte precursor cells (OPCs). Warmer colors represent regions with higher values. (B) Bar plots show the number of overlapping genes between 0.01–0.08 Hz-associated genes and cell-type-specific gene sets. Statistically significant enrichment (FDR-corrected p < 0.05) is indicated by asterisks. (C) Heatmap displays the enrichment of Gene Ontology biological processes across different cell types, highlighting functional pathway divergence associated with 0.01–0.08 Hz signal alterations.(D and E) Chord diagrams illustrate intercellular interaction networks inferred from shared CAP-associated genes across major brain cell types. The thickness of each connection represents the extent of gene overlap, reflecting potential molecular crosstalk underlying CAP-related functional alterations between distinct cellular populations. |
Spatial Associations Between PACG Dynamic Functional Architecture and Neuromolecular Topography
To examine whether PACG-related CAP alterations spatially correspond to normative neurotransmitter receptor and transporter distributions, we examined the spatial correlations between the CAP State 1 t-statistic map in the typical frequency band (0.01–0.08 Hz) and receptor/transporter density maps derived from PET and SPECT imaging. The selected 13 PET/SPECT-derived neurochemical maps comprised receptor-, transporter-, ligand-specific, and cerebral blood flow measures, thereby providing normative indices of neurochemical organization across multiple neuromodulatory systems.This multimodal approach enabled a comprehensive assessment of the normative neurochemical context for interpreting the spatial distribution of PACG-related CAP alterations.As shown in Figure 5A, nine molecular targets—including A4B2, HDAC, M1, CMRglu, 5HT6, KOR, mGluR5, SERT, and SV2A—exhibited significant spatial associations with PACG-related functional alterations, with both uncorrected and spin-test p values falling below 0.05. Notably, in contrast to the patterns observed in other neurodegenerative conditions, all nine systems exhibited positive spatial correlations with PACG-related changes (Figure 5B). This consistent pattern indicates that brain regions characterized by greater receptor density or higher metabolic/synaptic markers tend to exhibit more pronounced functional reorganization in PACG.
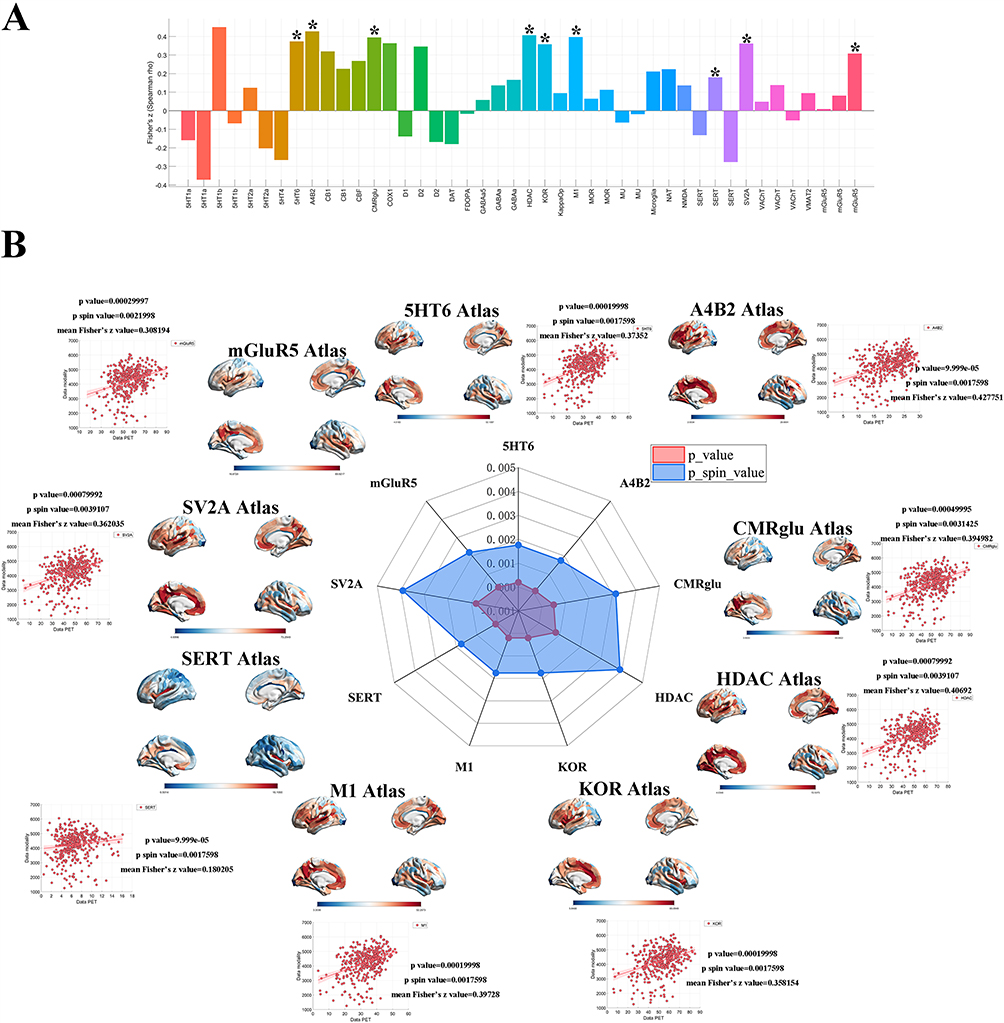 |
Figure 5 Spatial associations between PACG-related dynamic functional alterations and neuromolecular/physiological maps. (A) Preliminary spatial screening. Bar plot displaying the Fisher Z-transformed Spearman correlation coefficients between voxel-wise CAP alterations in the 0.01–0.08 Hz band and a comprehensive library of receptor/transporter or physiological density maps derived from PET imaging. Positive Z values (Z > 0) indicate spatially positive correlations, whereas negative Z values (Z < 0) indicate inverse spatial relationships. Nine systems exhibited statistically significant spatial coupling (marked with asterisks, P < 0.05), identified as candidate molecular substrates underlying the functional reorganization in PACG. (B) Robustness validation of core molecular targets. Radar plot and supplementary visualizations summarize the statistical significance of spatial associations for the nine identified targets: 5HT6, A4B2, CMRglu, HDAC, KOR, M1, SERT, SV2A, and mGluR5. The central radar chart compares the unadjusted p-values (red area) with the spin-test–corrected p-values (blue area), providing a measure of statistical robustness against spatial autocorrelation. Surrounding scatter plots illustrate the linear associations between PET-derived molecular densities and PACG-related dynamic functional alterations across the 400 Schaefer-parcellated regions. Each plot includes a regression line and is annotated with the corresponding mean Fisher Z values, raw p-values, and spin-test p-values (e.g., A4B2: Z = 0.428, p < 0.001, p_spin= 0.0017). The cortical surface maps visualize the topographic distribution of the corresponding molecular templates, serving as a biological reference for the observed functional-molecular coupling in PACG. |
The spatial coupling was particularly robust for the cholinergic system (A4B2: mean Fisher’s z = 0.428, p_spin = 0.0017; M1: mean Fisher’s z = 0.397, p_spin = 0.0017) and the epigenetic regulator HDAC (mean Fisher’s z = 0.407, p_spin = 0.0039). These quantitative findings suggest that PACG-related CAP alterations are spatially non-random and show correspondence with normative microscale molecular topography. Specifically, the strong alignment with neuromodulatory receptors, synaptic integrity markers (SV2A), and glucose metabolism (CMRglu) provides a normative neurochemical framework for interpreting the spatial distribution of CAP-related alterations in PACG.
Machine Learning–Based Classification Performance
The overall classification performance of the five machine-learning models is summarized in Table 3. When trained on the top ten brain-region features selected from 400 parcels within a specific CAP state, the classifiers showed modest discriminative performance.
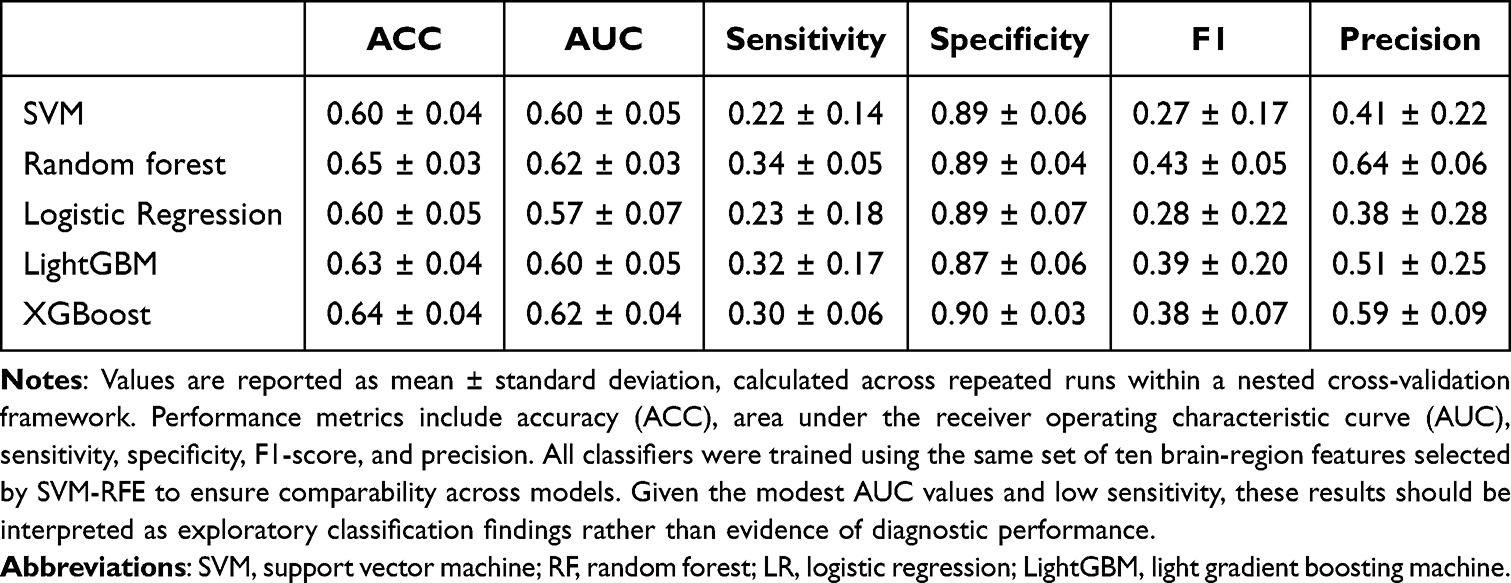 |
Table 3 Machine-Learning Performance Based on the Top Ten CAP-Derived Brain-Region Features |
Across models, classification accuracy ranged from 0.60 ± 0.04 for SVM and logistic regression to 0.65 ± 0.03 for random forest, while AUC values ranged from 0.57 ± 0.07 for logistic regression to 0.62 ± 0.04 for XGBoost. Specificity was relatively high across classifiers, ranging from 0.87 to 0.90, whereas sensitivity was low, ranging from 0.22 to 0.34. This pattern indicates that the models classified healthy controls more accurately than PACG patients.
Tree-based models, including random forest, LightGBM, and XGBoost, showed numerically higher sensitivity and F1-scores than the linear models, although the overall differences across classifiers were small. Precision values ranged from 0.38 ± 0.28 for logistic regression to 0.64 ± 0.06 for random forest.
At the individual feature level, a default mode network region involving the posterior cingulate/precuneus, LH-Default pCunpcc-2, showed relatively consistent contributions across the five machine-learning classifiers, including SVM, random forest, logistic regression, LightGBM, and XGBoost. Detailed classification performance metrics for each model are provided in Table 3, and the corresponding ROC curves are shown in Figure 6.
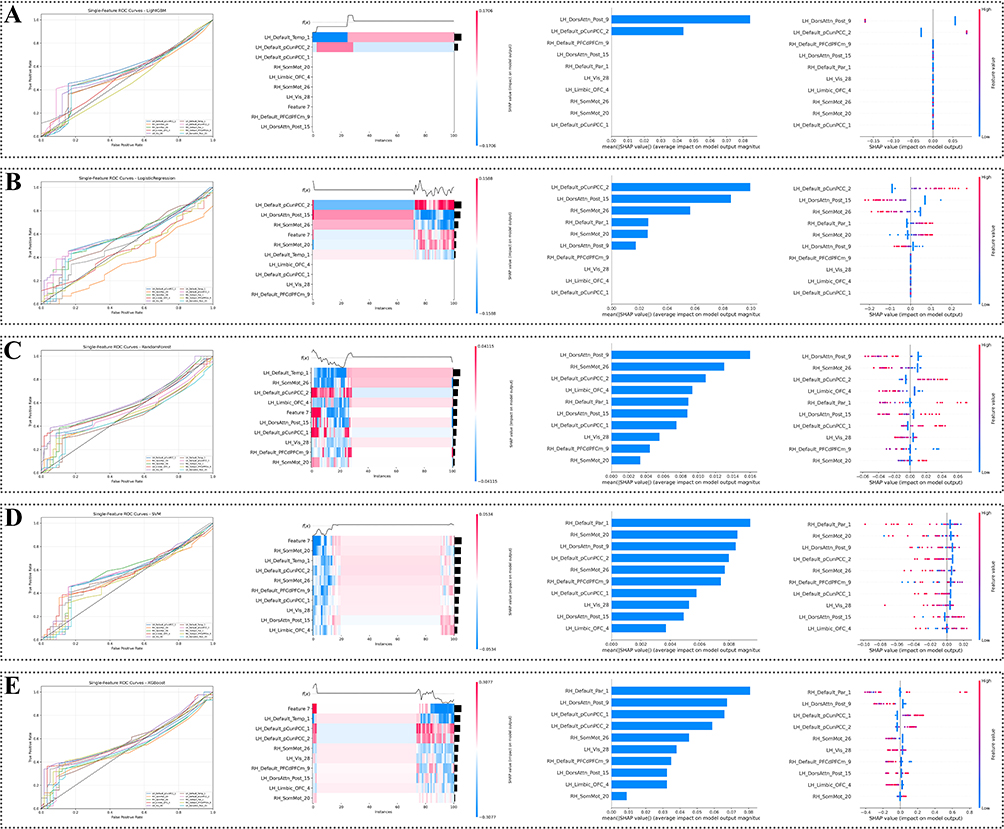 |
Figure 6 Machine-learning performance and feature contribution analysis based on state-specific co-activation pattern features. (A–E) correspond to LightGBM, logistic regression, random forest, support vector machine (SVM), and XGBoost, respectively. The first column displays receiver operating characteristic (ROC) curves for the five machine-learning models based on selected brain-region features derived from the Schaefer-400 parcellation. The dashed diagonal line indicates chance-level performance. The second column presents SHAP heatmaps showing instance-level feature contributions to model outputs, where the x-axis represents individual subjects and the y-axis denotes selected brain-region features. Colors indicate SHAP values. The third column shows mean absolute SHAP value plots, summarizing the average magnitude of feature contributions across subjects. The fourth column displays SHAP beeswarm plots showing the distribution of SHAP values across subjects, with point colors indicating corresponding feature values. |
Discussion
In the present study, we provide evidence that primary angle-closure glaucoma (PACG) is associated with state-specific alterations in large-scale brain dynamics, as captured by CAP states. A key novelty of this study is that it extends previous glaucoma neuroimaging research from static functional connectivity or regional spontaneous activity measures to a dynamic, state-based characterization of whole-brain co-activation patterns. By integrating multiple complementary CAP dynamic metrics, including occurrence, dwell time, fractional occupancy, and transition probability, our findings indicate that PACG-related brain dysfunction is characterized not by a uniform disruption across all functional states, but by selective stabilization of specific CAP configurations alongside suppression of others. This dynamic CAP-based framework provides a systems-level perspective on PACG-related functional reorganization by characterizing not only altered spatial co-activation patterns, but also how the brain occupies and transitions among recurring functional states over time.
Specifically, the increased occurrence, prolonged dwell time, elevated fractional occupancy, and enhanced self-transition probability of CAP 1 and CAP 6 in PACG suggest an abnormal bias toward specific dynamic configurations. In contrast, the concurrent suppression of CAP 2 and CAP 5 indicates reduced accessibility of complementary brain states. This pattern is consistent with prior studies of dynamic functional connectivity and large-scale brain state organization, which have shown that pathological conditions are often characterized by biased occupancy of specific brain states rather than simple global increases or decreases in functional connectivity.14,17,29 Therefore, the present findings suggest that PACG-related brain dysfunction may involve altered temporal coordination and reduced flexibility of intrinsic brain activity.
Importantly, earlier dynamic connectivity studies have emphasized that state-specific alterations often occur within pairs of spatially antagonistic or competing functional configurations, rather than affecting entire networks uniformly.14,16 Consistent with this framework, our findings suggest that CAP-related disruptions in PACG are embedded within limbic-centered CAP pairs that share similar network constituents but show opposing activation patterns. The enhanced stability of LIM–DAN–VAN and LIM–VAN–FPN-related CAP states may reflect a shift toward dynamic modes supporting affective modulation and attentional control during rest. Conversely, the reduced occurrence, dwell time, and stability of the complementary CAP states, particularly CAP 2 and CAP 5, may indicate reduced accessibility of alternative dynamic configurations and altered flexible state switching.
Collectively, these results suggest that PACG-related functional alterations are not limited to localized visual or sensorimotor dysfunction, but may involve a broader imbalance between competing intrinsic brain states. The selective stabilization of limbic-centered CAP configurations and concurrent destabilization of complementary states extend prior static and dynamic connectivity findings in glaucoma and provide a novel systems-level perspective on how chronic visual impairment may reshape the temporal architecture of large-scale brain activity.
Beyond these dynamic alterations at the systems level, we further sought to investigate the normative molecular and cellular context associated with CAP-related functional alteration.In the present study, we identified a significant imaging–transcriptomic spatial association between CAP-related functional alterations in primary angle-closure glaucoma to distinct cortical transcriptional gradients. Genes with positive and negative PLS1 loadings exhibited clearly dissociable functional enrichment profiles, suggesting that CAP-related functional alterations spatially correspond to complementary normative transcriptional profiles.
This dissociation is consistent with an increasing number of large-scale imaging–transcriptomic studies demonstrating that macroscale brain organization is underpinned by distinct but coordinated transcriptional axes.50 Genes with positive PLS1 loadings were predominantly enriched in ion transmembrane transport and ion channel–related molecular functions, particularly potassium channel activity.30 This finding aligns with prior transcriptomic and neurophysiological evidence indicating that ion channel expression patterns play a central role in shaping intrinsic neuronal excitability and cortical oscillatory dynamics.30,51 Previous imaging–gene expression studies have further shown that regions exhibiting greater functional activity or variability tend to align with transcriptional profiles enriched for ion channel and synaptic membrane genes, highlighting the importance of membrane excitability in sustaining large-scale brain dynamics.18,50 In the context of glaucoma, growing evidence suggests that altered neuronal excitability and disrupted electrophysiological signaling extend beyond the visual system, potentially reflecting widespread cortical involvement.52,53 The additional enrichment of postsynaptic specialization, axonal components, and regulated secretion within the PLS1+ gene set further supports the notion that excitability-related molecular programs are tightly coupled with synaptic compartmentalization and activity-dependent signaling processes.30,54 In contrast, genes with negative PLS1 loadings were enriched in pathways related to nervous system development, neuron projection development, synaptic organization, and neuroactive ligand–receptor interaction, including G protein–coupled receptor–mediated signaling.30 Similar transcriptional signatures have been reported in studies of macroscale functional networks, where genes involved in synaptic signaling, receptor modulation, and neurodevelopmental processes often show spatial patterns inversely related to regional functional activation.18 These molecular programs are thought to reflect longer-term regulatory and plasticity-related mechanisms that shape network architecture and synaptic communication rather than immediate electrophysiological properties.54,55 Consistent with previous work, the involvement of axon guidance, cell junction organization, and endocytosis suggests that CAP-related functional alterations may be associated with adaptive or maladaptive remodeling of synaptic connectivity and receptor trafficking.56
At the level of representative genes, positively weighted genes such as GPCPD1 and KCNAB3 showed spatial expression patterns aligned with CAP-related alterations and have previously been implicated in membrane lipid metabolism and potassium channel regulation, respectively—processes critical for neuronal excitability and signal integration.57,58 In contrast, negatively weighted genes including KCNN3 and NKAIN4 exhibited inverse spatial associations with CAP-related alterations and are known to participate in calcium-activated potassium channel function and Na⁺/K⁺-ATPase–related homeostatic regulation, suggesting roles in synaptic stabilization and neuronal maintenance rather than acute excitability.59,60 These gene-level observations provide convergent support for the broader transcriptional dissociation between excitability-related and synaptic regulatory programs identified at the pathway level.
Importantly, the opposing transcriptional profiles observed for PLS1+ and PLS1− genes are consistent with a dual-axis model of brain organization proposed in prior literature, in which intrinsic neuronal excitability and synaptic or developmental regulatory processes jointly contribute to large-scale functional dynamics.50 Within this framework, ion channel–dominated molecular programs support the rapid modulation and stability of functional brain states, whereas synaptic signaling and neurodevelopmental pathways provide a structural and regulatory backdrop that constrains network-level communication.50,61 Our findings extend this conceptual framework to dynamic CAP analysis in glaucoma, indicating that PACG-related brain state alterations spatially align with complementary normative transcriptional axes related to neuronal excitability and synaptic regulatory processes.
Together, by integrating CAP-based functional dynamics with transcriptomic profiling and situating the results within established imaging–genetics literature, this study provides a biologically grounded interpretation of large-scale brain alterations in primary angle-closure glaucoma. These findings underscore the importance of considering both excitability-related and synaptic regulatory molecular mechanisms when interpreting dynamic functional brain changes in neuro-ophthalmological disorders.
Previous neuroimaging and imaging–transcriptomic studies have consistently shown that low-frequency BOLD fluctuations are closely linked to coordinated neuronal activity and synaptic integration processes, rather than being uniformly distributed across all brain cell types.18,44 In line with this body of work, our cell-type–specific transcriptomic analyses revealed selective enrichment of CAP-related low-frequency signal variance in excitatory neurons and inhibitory neurons during the typical-range CAP state, supporting the notion that excitation–inhibition balance plays a central role in shaping large-scale functional brain dynamics.62 Prior studies examining resting-state networks and dynamic functional connectivity have similarly reported that neuronal gene expression signatures, particularly those related to synaptic signaling and ion transport, are preferentially aligned with intrinsic functional organization.
Beyond neuronal populations, accumulating evidence has highlighted the contribution of vascular and endothelial processes to low-frequency fMRI signals through neurovascular coupling mechanisms.63,64 Endothelial cells have been implicated in regulating cerebral blood flow, blood–brain barrier function, and metabolic support for neuronal activity, all of which can influence BOLD signal variability.63 Consistent with these observations, the significant enrichment of CAP-related genes in endothelial cells observed in our study suggests that vascular-related molecular programs may contribute to the modulation of low-frequency signal variance associated with dynamic brain states, extending prior findings by situating endothelial involvement within the framework of CAP dynamics.
Functional enrichment analyses further revealed convergence on biological processes related to ion and calcium transmembrane transport, synaptic organization, postsynaptic membrane components, and cell junction assembly. These processes have been repeatedly associated with intrinsic brain activity and functional connectivity in previous transcriptomic and systems neuroscience studies, underscoring their relevance for both neuronal communication and intercellular coordination.18,44,50 The involvement of calcium signaling and cell junction–related pathways also aligns with earlier work suggesting that activity-dependent signaling and cellular connectivity are critical for the temporal coordination of large-scale brain networks.62,65
Importantly, our intercellular network analyses revealed a dissociation between gene-level overlap and functional convergence across cell types, a pattern that has been increasingly recognized in studies of brain organization.30,47,66 Previous research has shown that different cell types may employ distinct gene sets to support similar biological processes, resulting in functional convergence without extensive gene sharing. In this context, the pronounced gene-level overlap observed among excitatory neurons, inhibitory neurons, and endothelial cells, coupled with broader functional convergence across multiple cell types, suggests a coordinated but cell-type–specific molecular architecture underlying CAP-related low-frequency dynamics.67,68
Together, by integrating our findings with existing evidence from neuroimaging, transcriptomics, and neurovascular research, the present study supports a model in which dynamic brain states emerge from the interaction of neuronal excitability, synaptic organization, and vascular regulation. This multi-cellular perspective extends previous work on intrinsic brain activity by highlighting how coordinated molecular programs across distinct cellular populations may jointly shape CAP-related functional dynamics in primary angle-closure glaucoma.
At the receptor level, PACG-related dynamic functional alterations were significantly correlated with the distribution of several neurotransmitter systems, indicating that neuromodulatory topography may provide a normative spatial context for PACG-related CAP alterations. Cholinergic receptors, particularly A4B2 and M1 subtypes, showed strong positive associations, suggesting that cholinergic-rich regions may be especially vulnerable to sensory integration deficits in glaucoma.69 Associations with 5HT6 and SERT further implicate serotonergic signaling in modulating arousal and sensory gating, consistent with prior reports of non-visual network involvement in PACG.
The spatial associations with HDAC and SV2A-related maps provide potential epigenetic- and synaptic-density-related contexts for interpreting altered CAP dynamics. Specifically, the association with HDAC-related maps may provide an epigenetic-related spatial context for PACG-related functional alterations, but should not be interpreted as direct evidence of chromatin remodeling or altered neuroplasticity. Similarly, the association with SV2A-related maps suggests that CAP alterations may be spatially aligned with regions characterized by higher normative synaptic-density signals, providing additional context for macroscale functional alterations.70 In addition, the associations with mGluR5 and CMRglu indicate that PACG-related CAP alterations may preferentially occur in regions with higher normative glutamatergic receptor density and glucose metabolic activity. These findings may be consistent with increased metabolic and synaptic vulnerability in regions affected by chronic visual impairment, but they do not provide direct evidence for trans-synaptic excitotoxicity or disease-specific neurochemical changes.71
Significant KOR (κ-opioid receptor) associations suggest a role for opioid signaling in gating sensory inputs and regulating cortical states, as seen in other sensory deprivation models. Collectively, these findings indicate that PACG-related CAP alterations show spatial correspondence with multiple neuromodulatory, metabolic, and epigenetic systems. Linking receptor distributions to regional functional fluctuations provides a multi-dimensional neurochemical framework for understanding disrupted cortical coordination in PACG, consistent with evidence that glaucoma may have broader neurodegenerative effects.
A key methodological consideration of the present study is the use of SVM-based recursive feature elimination within a nested cross-validation framework.72–75 Compared with single-split or performance-driven feature selection, this strategy was adopted to reduce the risk of information leakage and to provide a more conservative evaluation of CAP-derived regional features. In the present analysis, the same feature-selection procedure was applied across classifiers to explore whether selected brain regions contained group-discriminative information between PACG patients and healthy controls.
However, the machine-learning findings should be interpreted cautiously. Although the selected CAP-derived features yielded above-chance classification performance across several models, the overall discriminative ability was modest, with AUC values ranging from 0.57 to 0.62. In particular, sensitivity was low, whereas specificity was relatively high, indicating that the models were better at identifying healthy controls than PACG patients. Therefore, these results do not support the current use of CAP-derived features as diagnostic biomarkers for PACG, but rather suggest that CAP-based regional measures may contain limited group-level information.75–77
The broadly comparable performance across linear and non-linear classifiers suggests that the observed classification pattern was not strongly dependent on a single model architecture. Nevertheless, this consistency should be regarded as preliminary rather than confirmatory evidence, given the limited classification performance and the relatively small sample size. Larger independent cohorts, external validation datasets, and more comprehensive ophthalmological severity measures will be required to determine whether CAP-derived features have potential clinical relevance in future studies.75–77
Among the selected regions, LH-Default pCunpcc-2, involving the posterior cingulate cortex and precuneus within the default mode network (DMN), showed relatively consistent contributions across classifiers. This region is a core hub of the DMN and is involved in integrating internally directed processes with sensory information, including visual input.78,79 PACG is characterized by chronic and progressive visual impairment, which may lead to long-term alterations in the balance between externally driven visual processing and internally oriented cognitive networks.10,71,80 Within this context, the contribution of the posterior cingulate/precuneus region during the selected CAP state may reflect altered interactions between visual networks and the DMN.
Given the modest classification performance, the involvement of LH-Default pCunpcc-2 should be interpreted as a candidate region for future investigation rather than as a validated discriminative feature. Its contribution across multiple classifiers and SHAP analyses may provide exploratory evidence that DMN-related regions participate in PACG-associated functional reorganization. However, further validation in larger and independent datasets is necessary to determine the reliability and clinical significance of this finding.75–77,81
In summary, the present study integrates dynamic CAP analysis, imaging–transcriptomic association, cell-type–specific profiling, neuromodulatory receptor mapping, and machine learning–based feature selection to provide a multiscale characterization of brain functional alterations in primary angle-closure glaucoma. Rather than reflecting uniform disruption of functional networks, PACG-related brain changes may be better understood as state-specific alterations in intrinsic brain dynamics, involving imbalances between competing functional states that spatially align with normative molecular and cellular architectures. By linking temporal brain state dynamics with normative transcriptional gradients and cellular profiles, our findings extend current models of glaucoma-related brain involvement beyond static connectivity and provide a hypothesis-generating systems-level framework for understanding brain functional alterations associated with chronic visual impairment.
Limitations and Future Directions
Several limitations should be acknowledged. First, this study used a cross-sectional design; therefore, although CAP-derived metrics revealed PACG-related alterations in dynamic brain functional organization, they cannot be interpreted as direct indicators of disease progression or disease burden. Longitudinal studies are needed to determine whether CAP alterations can track clinical progression or disease severity in PACG. Future work should integrate CAP metrics with comprehensive ophthalmological variables, including intraocular pressure, disease duration, visual field defects, retinal nerve fiber layer thickness, cup-to-disc ratio, medication use, and disease stage, to better clarify the clinical relevance of dynamic brain alterations.
Second, the transcriptomic and cell-type enrichment analyses were based on normative reference datasets rather than molecular data obtained directly from patients with PACG. In particular, the AHBA data were derived from neurologically healthy postmortem donors, and the cell-type annotations were also based on external reference data. Therefore, the observed imaging–transcriptomic and cell-type associations should be interpreted as spatial correspondence with normative biological architecture, rather than as evidence of disease-specific molecular or cellular mechanisms. These biological annotation analyses remain exploratory and do not establish causal interactions among PACG, altered brain function, gene expression, and cellular composition. Future studies combining multimodal neuroimaging, patient-derived molecular data, longitudinal clinical assessments, and experimental validation will be needed to clarify the biological mechanisms underlying PACG-associated brain alterations.
Third, given the high-dimensional nature of the multiscale analyses, including regional neuroimaging features, transcriptomic profiles, cell-type annotations, and neurochemical maps, residual false-positive risk cannot be fully excluded despite the use of spatial permutation testing, FDR or Bonferroni correction, bootstrapping, and nested cross-validation. Therefore, these findings should be considered exploratory and hypothesis-generating, requiring validation in larger independent cohorts with preregistered analytical pipelines.
Finally, although CAP analysis provides complementary information beyond conventional static functional connectivity by characterizing recurring whole-brain co-activation states and their temporal dynamics, its potential clinical utility remains to be established. Future multi-center studies with larger sample sizes and independent validation datasets are required to evaluate whether CAP-derived measures can serve as reliable imaging markers for disease monitoring, patient stratification, or treatment-response assessment in PACG.
Conclusion
In conclusion, the present study demonstrates that primary angle-closure glaucoma is associated with state-specific alterations in intrinsic brain dynamics, as revealed by resting-state fMRI–based co-activation pattern analysis. Rather than showing uniform disruption across all brain states, PACG patients exhibited selective increases in the occurrence, dwell time, fractional occupancy, and self-transition probability of specific CAP states, accompanied by reduced engagement of complementary states. These findings suggest an altered balance between competing large-scale functional configurations involving limbic, attentional, sensorimotor, control, and default mode networks.
By integrating CAP-derived alterations with normative transcriptomic, cell-type, and neurotransmitter receptor maps, this study further provides a multiscale biological context for interpreting PACG-associated brain functional changes. The observed spatial associations with gene expression gradients, excitatory and inhibitory neuronal signatures, endothelial-cell enrichment, and neuromodulatory receptor distributions suggest that PACG-related functional alterations may be constrained by the brain’s normative molecular, cellular, and neurochemical architecture. However, these findings should be interpreted as spatial associations rather than direct evidence of disease-specific molecular mechanisms.Given the high-dimensional nature of the multiscale analyses, including regional neuroimaging features, transcriptomic profiles, cell-type annotations, and neurochemical maps, residual false-positive risk cannot be fully excluded despite the use of spatial permutation testing, FDR or Bonferroni correction, bootstrapping, and nested cross-validation. Therefore, these findings should be considered exploratory and hypothesis-generating and require validation in larger independent cohorts with preregistered analytical pipelines.
Machine-learning analyses indicated that CAP-derived regional features contained limited group-discriminative information, with relatively high specificity but low sensitivity. Therefore, these results should be regarded as exploratory and do not support the current use of CAP-derived features as diagnostic biomarkers for PACG. Overall, this study provides a hypothesis-generating, systems-level framework for understanding brain functional alterations associated with PACG and highlights the need for future studies with larger cohorts, detailed ophthalmological severity measures, and independent validation datasets.
Ethics Approval and Consent to Participate
Ethical approval for this study was granted by the Research Ethics Committee of The Affiliated Eye Hospital of Nanchang University.All procedures were conducted in compliance with the principles of the Declaration of Helsinki.Before enrollment, participants were fully informed about the study objectives, procedures, potential risks, and expected benefits, and written informed consent was obtained from all individuals. Ethics approval number: YLP20260045
Acknowledgments
We appreciate all who have contributed to this study.
Disclosure
The authors declare that they have no known competing financial interests or personal relationships that could have appeared to influence the work reported in this paper.
References
1. Tham YC, Li X, Wong TY, Quigley HA, Aung T, Cheng CY. Global prevalence of glaucoma and projections of glaucoma burden through 2040: a systematic review and meta-analysis. Ophthalmology. 2014;121(11):2081–24. doi:10.1016/j.ophtha.2014.05.013
2. Quigley HA, Addicks EM, Green WR. Optic nerve damage in human glaucoma. III. Quantitative correlation of nerve fiber loss and visual field defect in glaucoma, ischemic neuropathy, papilledema, and toxic neuropathy. Arch Ophthalmol. 1982;100(1):135–146. doi:10.1001/archopht.1982.01030030137016
3. Prokosch V, Li P, Shi X. Glaucoma as a neurodegenerative and inflammatory disease. Das Glaukom ist eine neurodegenerative und neuroinflammatorische Erkrankung. Klinische Monatsblatter fur Augenheilkunde. 2023;240(2):125–129. doi:10.1055/a-1965-0044
4. Zhang QJ, Wang D, Bai ZL, Ren BC, Li XH. Diffusion tensor imaging of optic nerve and optic radiation in primary chronic angle-closure glaucoma using 3T magnetic resonance imaging. Int J Ophthalmol. 2015;8(5):975–979. doi:10.3980/j.issn.2222-3959.2015.05.22
5. Nuzzi R, Dallorto L, Rolle T. Changes of visual pathway and brain connectivity in glaucoma: a systematic review. Front Neurosci. 2018;12:363. doi:10.3389/fnins.2018.00363
6. Fox MD, Raichle ME. Spontaneous fluctuations in brain activity observed with functional magnetic resonance imaging. Nat Rev Neurosci. 2007;8(9):700–711. doi:10.1038/nrn2201
7. Damoiseaux JS, Rombouts SA, Barkhof F, et al. Consistent resting-state networks across healthy subjects. Proc Natl Acad Sci USA. 2006;103(37):13848–13853. doi:10.1073/pnas.0601417103
8. Wang R, Tang Z, Liu T, Sun X, Wu L, Xiao Z. Altered spontaneous neuronal activity and functional connectivity pattern in primary angle-closure glaucoma: a resting-state fMRI study. Neurol Sci. 2021;42(1):243–251. doi:10.1007/s10072-020-04577-1
9. Chen L, Li S, Cai F, et al. Altered functional connectivity density in primary angle-closure glaucoma patients at resting-state. Quant Imaging Med Surg. 2019;9(4):603–614. doi:10.21037/qims.2019.04.13
10. Wang Y, Chen L, Cai F, et al. Altered functional connectivity of the thalamus in primary angle-closure glaucoma patients: a resting-state fMRI study. Front Neurol. 2022;13:1015758. doi:10.3389/fneur.2022.1015758
11. Wang J, Li T, Zhou P, Wang N, Xian J, He H. Altered functional connectivity within and between the default model network and the visual network in primary open-angle glaucoma: a resting-state fMRI study. Brain Imaging Behav. 2017;11(4):1154–1163. doi:10.1007/s11682-016-9597-3
12. Li S, Li P, Gong H, et al. Intrinsic functional connectivity alterations of the primary visual cortex in primary angle-closure glaucoma patients before and after surgery: a resting-state fMRI study. PLoS One. 2017;12(1):e0170598. doi:10.1371/journal.pone.0170598
13. Allen EA, Damaraju E, Plis SM, Erhardt EB, Eichele T, Calhoun VD. Tracking whole-brain connectivity dynamics in the resting state. Cereb Cortex. 2014;24(3):663–676. doi:10.1093/cercor/bhs352
14. Hutchison RM, Womelsdorf T, Allen EA, et al. Dynamic functional connectivity: promise, issues, and interpretations. NeuroImage. 2013;80:360–378. doi:10.1016/j.neuroimage.2013.05.079
15. Preti MG, Bolton TA, Van De Ville D. The dynamic functional connectome: state-of-the-art and perspectives. NeuroImage. 2017;160:41–54. doi:10.1016/j.neuroimage.2016.12.061
16. Liu X, Duyn JH. Time-varying functional network information extracted from brief instances of spontaneous brain activity. Proc Natl Acad Sci USA. 2013;110(11):4392–4397. doi:10.1073/pnas.1216856110
17. Liu X, Chang C, Duyn JH. Decomposition of spontaneous brain activity into distinct fMRI co-activation patterns. Front Syst Neurosci. 2013;7:101. doi:10.3389/fnsys.2013.00101
18. Richiardi J, Altmann A, Milazzo AC, et al; IMAGEN consortium. BRAIN NETWORKS. Correlated gene expression supports synchronous activity in brain networks. Science. 2015;348(6240):1241–1244. doi:10.1126/science.1255905
19. Fornito A, Arnatkevičiūtė A, Fulcher BD. Bridging the gap between Connectome and Transcriptome. Trends Cognitive Sci. 2019;23(1):34–50. doi:10.1016/j.tics.2018.10.005
20. Logothetis NK. What we can do and what we cannot do with fMRI. Nature. 2008;453(7197):869–878. doi:10.1038/nature06976
21. Lake BB, Ai R, Kaeser GE, et al. Neuronal subtypes and diversity revealed by single-nucleus RNA sequencing of the human brain. Science. 2016;352(6293):1586–1590. doi:10.1126/science.aaf1204
22. Deco G, Ponce-Alvarez A, Hagmann P, Romani GL, Mantini D, Corbetta M. How local excitation-inhibition ratio impacts the whole brain dynamics. J Neurosci. 2014;34(23):7886–7898. doi:10.1523/JNEUROSCI.5068-13.2014
23. Citri A, Malenka RC. Synaptic plasticity: multiple forms, functions, and mechanisms. Neuropsychopharmacology. 2008;33(1):18–41. doi:10.1038/sj.npp.1301559
24. Hansen JY, Shafiei G, Markello RD, et al. Mapping neurotransmitter systems to the structural and functional organization of the human neocortex. Nat Neurosci. 2022;25(11):1569–1581. doi:10.1038/s41593-022-01186-3
25. Deco G, Kringelbach ML, Jirsa VK, Ritter P. The dynamics of resting fluctuations in the brain: metastability and its dynamical cortical core. Sci Rep. 2017;7(1):3095. doi:10.1038/s41598-017-03073-5
26. Litjens G, Kooi T, Bejnordi BE, et al. A survey on deep learning in medical image analysis. Med Image Anal. 2017;42:60–88. doi:10.1016/j.media.2017.07.005
27. Arbabshirani MR, Plis S, Sui J, Calhoun VD. Single subject prediction of brain disorders in neuroimaging: promises and pitfalls. NeuroImage. 2017;145(Pt B):137–165. doi:10.1016/j.neuroimage.2016.02.079
28. Munroe L, da Silva M, Heidari F, et al. Applications of interpretable deep learning in neuroimaging: a comprehensive review. Imaging Neurosci. 2024;2:imag–2–00214. doi:10.1162/imag_a_00214
29. Wang Y, Shu Y, Cai G, et al. Altered static and dynamic functional network connectivity in primary angle-closure glaucoma patients. Sci Rep. 2024;14(1):11682. doi:10.1038/s41598-024-62635-6
30. Arnatkeviciute A, Fulcher BD, Fornito A. A practical guide to linking brain-wide gene expression and neuroimaging data. NeuroImage. 2019;189:353–367. doi:10.1016/j.neuroimage.2019.01.011
31. Shi Y, Li Y, Ci R, et al. Dynamic functional connectivity and transcriptomic signatures reveal stage-dependent brain network dysfunction in Alzheimer’s disease spectrum. Alzheimer’s Res Ther. 2025;17(1):247. doi:10.1186/s13195-025-01898-1
32. Yan CG, Wang XD, Zuo XN, Zang YF. DPABI: Data processing & analysis for (Resting-State) brain imaging. Neuroinformatics. 2016;14(3):339–351. doi:10.1007/s12021-016-9299-4
33. Jenkinson M, Bannister P, Brady M, Smith S. Improved optimization for the robust and accurate linear registration and motion correction of brain images. NeuroImage. 2002;17(2):825–841. doi:10.1016/s1053-8119(02)91132-8
34. Ashburner J. A fast diffeomorphic image registration algorithm. NeuroImage. 2007;38(1):95–113. doi:10.1016/j.neuroimage.2007.07.007
35. Collins DL, Neelin P, Peters TM, Evans AC. Automatic 3D intersubject registration of MR volumetric data in standardized Talairach space. J Comput Assist Tomography. 1994;18(2):192–205.
36. Candemir C. Spatial smoothing effect on group-level functional connectivity during resting and task-based fMRI. Sensors. 2023;23(13):5866. doi:10.3390/s23135866
37. Alahmadi AAS. Effects of different smoothing on global and regional resting functional connectivity. Neuroradiology. 2021;63(1):99–109. doi:10.1007/s00234-020-02523-8
38. Lowe MJ, Mock BJ, Sorenson JA. Functional connectivity in single and multislice echoplanar imaging using resting-state fluctuations. NeuroImage. 1998;7(2):119–132. doi:10.1006/nimg.1997.0315
39. Zuo XN, Di Martino A, Kelly C, et al. The oscillating brain: complex and reliable. NeuroImage. 2010;49(2):1432–1445. doi:10.1016/j.neuroimage.2009.09.037
40. Cordes D, Haughton VM, Arfanakis K, et al. Frequencies contributing to functional connectivity in the cerebral cortex in “resting-state” data. AJNR Am J Neuroradiol. 2001;22(7):1326–1333.
41. Schaefer A, Kong R, Gordon EM, et al. Local-global Parcellation of the human cerebral cortex from intrinsic functional connectivity MRI. Cereb. Cortex. 2018;28(9):3095–3114. doi:10.1093/cercor/bhx179
42. Yang H, Zhang H, Di X, et al. Reproducible coactivation patterns of functional brain networks reveal the aberrant dynamic state transition in schizophrenia. NeuroImage. 2021;237:118193. doi:10.1016/j.neuroimage.2021.118193
43. Wang J, Wang X, Xia M, Liao X, Evans A, He Y. GRETNA: a graph theoretical network analysis toolbox for imaging connectomics. Front Hum Neurosci. 2015;9:386. doi:10.3389/fnhum.2015.00386
44. Hawrylycz MJ, Lein ES, Guillozet-Bongaarts AL, et al. An anatomically comprehensive atlas of the adult human brain transcriptome. Nature. 2012;489(7416):391–399. doi:10.1038/nature11405
45. Sun L, Liang X, Duan D, et al. Structural insight into the individual variability architecture of the functional brain connectome. NeuroImage. 2022;259:119387. doi:10.1016/j.neuroimage.2022.119387
46. Zhou Y, Zhou B, Pache L, et al. Metascape provides a biologist-oriented resource for the analysis of systems-level datasets. Nat Commun. 2019;10(1):1523. doi:10.1038/s41467-019-09234-6
47. Seidlitz J, Nadig A, Liu S, et al. Transcriptomic and cellular decoding of regional brain vulnerability to neurogenetic disorders. Nat Commun. 2020;11(1):3358. doi:10.1038/s41467-020-17051-5
48. Dukart J, Holiga S, Rullmann M, et al. JuSpace: A tool for spatial correlation analyses of magnetic resonance imaging data with nuclear imaging derived neurotransmitter maps. Hum Brain Mapp. 2021;42(3):555–566. doi:10.1002/hbm.25244
49. Varma S, Simon R. Bias in error estimation when using cross-validation for model selection. BMC Bioinf. 2006;7:91. doi:10.1186/1471-2105-7-91
50. Burt JB, Demirtaş M, Eckner WJ, et al. Hierarchy of transcriptomic specialization across human cortex captured by structural neuroimaging topography. Nat Neurosci. 2018;21(9):1251–1259. doi:10.1038/s41593-018-0195-0
51. Buzsáki G, Draguhn A. Neuronal oscillations in cortical networks. Science. 2004;304(5679):1926–1929. doi:10.1126/science.1099745
52. Li T, Liu Z, Li J, et al. Altered amplitude of low-frequency fluctuation in primary open-angle glaucoma: a resting-state FMRI study. Invest Ophthalmol Visual Sci. 2014;56(1):322–329. doi:10.1167/iovs.14-14974
53. Kasi A, Faiq MA, Chan KC. In vivo imaging of structural, metabolic and functional brain changes in glaucoma. Neural Regen Res. 2019;14(3):446–449. doi:10.4103/1673-5374.243712
54. Holtmaat A, Svoboda K. Experience-dependent structural synaptic plasticity in the mammalian brain. Nat Rev Neurosci. 2009;10(9):647–658. doi:10.1038/nrn2699
55. Collingridge G, Isaac JTR, Wang YT. Receptor trafficking and synaptic plasticity. Nat Rev Neurosci. 2004;5(12):952–962. doi:10.1038/nrn1556
56. Carroll RC, Beattie EC, von Zastrow M, Malenka RC. Role of AMPA receptor endocytosis in synaptic plasticity. Nat Rev Neurosci. 2001;2(5):315–324. doi:10.1038/35072500
57. Stefanello ST, Matté C, Schuck PF, Ferreira GC, Wyse ATS. Glycerophosphodiester phosphodiesterase activity and membrane lipid metabolism in the brain. Biochimica et Biophysica Acta (BBA). 2017;1862(3):300–308. doi:10.1016/j.bbalip.2016.12.006
58. Pongs O, Schwarz JR. Ancillary subunits associated with voltage-dependent K+ channels. Physiol Rev. 2010;90(2):755–796. doi:10.1152/physrev.00020.2009
59. Liu T, Li T, Xu D, et al. Small-conductance calcium-activated potassium channels in the heart: expression, regulation and pathological implications. Philos Trans R Soc London Ser B. 2023;378(1879):20220171. doi:10.1098/rstb.2022.0171
60. Gorokhova S, Bibert S, Geering K, Heintz N. A novel family of transmembrane proteins interacting with beta subunits of the Na,K-ATPase. Hum Mol Genet. 2007;16(20):2394–2410. doi:10.1093/hmg/ddm167
61. Hawrylycz MJ, Lein ES, Guillozet-Bongaarts AL, et al. Canonical genetic signatures of the adult human brain. Nat Neurosci. 2015;18(12):1832–1844. doi:10.1038/nn.4171
62. Okun M, Lampl I. Instantaneous correlation of excitation and inhibition during ongoing and sensory-evoked activities. Nat Neurosci. 2008;11(5):535–537. doi:10.1038/nn.2105
63. Iadecola C. The neurovascular unit coming of age: a journey through neurovascular coupling in health and disease. Neuron. 2017;96(1):17–42. doi:10.1016/j.neuron.2017.07.030
64. Fulcher BD, Murray JD, Zerbi V, Wang XJ. Multimodal gradients across mouse cortex. Proc Natl Acad Sci USA. 2019;116(10):4689–4695. doi:10.1073/pnas.1814144116
65. Zeisel A, Muñoz-Manchado AB, Codeluppi S, et al. Brain structure. Cell types in the mouse cortex and hippocampus revealed by single-cell RNA-seq. Science. 2015;347(6226):1138–1142. doi:10.1126/science.aaa1934
66. Saunders A, Macosko EZ, Wysoker A, et al. Molecular diversity and specializations among the cells of the adult mouse brain. Cell. 2018;174(4):1015–1030.e16. doi:10.1016/j.cell.2018.07.028
67. Shine JM, Breakspear M, Bell PT, et al. Human cognition involves the dynamic integration of neural activity and neuromodulatory systems. Nat Neurosci. 2019;22(2):289–296. doi:10.1038/s41593-018-0312-0
68. Chen Y, Wang Y, Chen L, et al. Altered resting-state amygdalar functional connectivity in primary angle-closure glaucoma patients. J Integrat Neurosci. 2024;23(4):75. doi:10.31083/j.jin2304075
69. Gulledge AT, Bucci DJ, Zhang SS, Matsui M, Yeh HH. M1 receptors mediate cholinergic modulation of excitability in neocortical pyramidal neurons. J Neurosci. 2009;29(31):9888–9902. doi:10.1523/JNEUROSCI.1366-09.2009
70. Calkins DJ. Critical pathogenic events underlying progression of neurodegeneration in glaucoma. Prog Retinal Eye Res. 2012;31(6):702–719. doi:10.1016/j.preteyeres.2012.07.001
71. Le Merrer J, Becker JA, Befort K, Kieffer BL. Reward processing by the opioid system in the brain. Physiol Rev. 2009;89(4):1379–1412. doi:10.1152/physrev.00005.2009
72. Hoffmann A, Heinrich C, Hutter F. Stability of feature selection methods for high-dimensional data: a review. Briefings Bioinf. 2018;19(5):926–938. doi:10.1093/bib/bbx085
73. Guyon I, Weston J, Barnhill S, Vapnik V. Gene selection for cancer classification using support vector machines. Machine Learning. 2002;46(1–3):389–422. doi:10.1023/A:1012487302797
74. Varoquaux G, Raamana PR, Engemann DA, Hoyos-Idrobo A, Schwartz Y, Thirion B. Assessing and tuning brain decoders: cross-validation, caveats, and guidelines. NeuroImage. 2017;145(Pt B):166–179. doi:10.1016/j.neuroimage.2016.10.038
75. Jafrasteh B, Adeli E, Pohl KM, Kuceyeski A, Sabuncu MR, Zhao Q. Statistical variability in comparing accuracy of neuroimaging based classification models via cross validation. Sci Rep. 2025;15(1):28745. doi:10.1038/s41598-025-12026-2
76. Mateos-Pérez JM, Dadar M, Lacalle-Aurioles M, Iturria-Medina Y, Zeighami Y, Evans AC. Structural neuroimaging as clinical predictor: a review of machine learning applications. NeuroImage Clin. 2018;20:506–522. doi:10.1016/j.nicl.2018.08.019
77. Fransson P, Marrelec G. The precuneus/posterior cingulate cortex plays a pivotal role in the default mode network: evidence from a partial correlation network analysis. NeuroImage. 2008;42(3):1178–1184. doi:10.1016/j.neuroimage.2008.05.059
78. Utevsky AV, Smith DV, Huettel SA. Precuneus is a functional core of the default-mode network. J Neurosci. 2014;34(3):932–940. doi:10.1523/JNEUROSCI.4227-13.2014
79. Baseler HA, Gouws A, Haak KV, et al. Large-scale remapping of visual cortex is absent in adult humans with macular degeneration. Nat Neurosci. 2011;14(5):649–655. doi:10.1038/nn.2793
80. Spires-Jones TL, Hyman BT. The intersection of amyloid beta and tau at synapses in Alzheimer’s disease. Neuron. 2014;82(4):756–771. doi:10.1016/j.neuron.2014.05.004
81. Whitaker KJ, Vértes PE, Romero-Garcia R, et al. Adolescence is associated with genomically patterned consolidation of the hubs of the human brain connectome. Proc Natl Acad Sci USA. 2016;113(32):9105–9110. doi:10.1073/pnas.1601745113
 © 2026 The Author(s). This work is published and licensed by Dove Medical Press Limited. The
full terms of this license are available at https://www.dovepress.com/terms
and incorporate the Creative Commons Attribution
- Non Commercial (unported, 4.0) License.
By accessing the work you hereby accept the Terms. Non-commercial uses of the work are permitted
without any further permission from Dove Medical Press Limited, provided the work is properly
attributed. For permission for commercial use of this work, please see paragraphs 4.2 and 5 of our Terms.
© 2026 The Author(s). This work is published and licensed by Dove Medical Press Limited. The
full terms of this license are available at https://www.dovepress.com/terms
and incorporate the Creative Commons Attribution
- Non Commercial (unported, 4.0) License.
By accessing the work you hereby accept the Terms. Non-commercial uses of the work are permitted
without any further permission from Dove Medical Press Limited, provided the work is properly
attributed. For permission for commercial use of this work, please see paragraphs 4.2 and 5 of our Terms.