Back to Journals » Drug Design, Development and Therapy » Volume 12
REST, not REST4, is a risk factor associated with radiotherapy plus chemotherapy efficacy in glioma
Authors Li C ![]() , Zou H, Wang ZF, Tang X, Fan X, Zhang K, Liu J, Li Z
, Zou H, Wang ZF, Tang X, Fan X, Zhang K, Liu J, Li Z ![]()
Received 5 January 2018
Accepted for publication 27 March 2018
Published 22 May 2018 Volume 2018:12 Pages 1363—1371
DOI https://doi.org/10.2147/DDDT.S161602
Checked for plagiarism Yes
Review by Single anonymous peer review
Peer reviewer comments 2
Editor who approved publication: Dr Qiongyu Guo
Cuilin Li,1,2 Hecun Zou,1–3 Zhifei Wang,4 Xinyue Tang,1,2 Xitang Fan,4 Ke Zhang,1,2 Jianqiu Liu,1,2 Zhi Li1,2
1Department of Clinical Pharmacology, Xiangya Hospital, Central South University, Changsha, China; 2Institute of Clinical Pharmacology, Central South University and Hunan Key Laboratory of Pharmacogenetics, Changsha, China; 3Institute of Life Sciences, Chongqing Medical University, Chongqing, China; 4Department of Neurosurgery, Third Xiangya Hospital of Central South University, Changsha, China
Background/aim: Repressor element silencing transcription factor (REST) is a transcription repressor, expressed in several malignancies. This study aims to evaluate the prognostic values of REST and its splicing variant REST4 in glioma, and investigate the potential correlation between REST and REST4.
Methods: REST and REST4 expression values were evaluated by qRT-PCR in 89 patients with gliomas and 10 with normal brain tissues.
Results: Upregulation of REST was related to higher World Health Organization (WHO) grade, larger tumor size, higher ki67, and higher p53 positive rate. After radiotherapy+temozolomide (RT+TMZ) treatment, low REST expression patients could get better therapeutic efficacy (P=0.031). The positive rate of REST4 expression was only 13.5% in glioma tissues, and REST4 expression was not associated with clinical characteristics and REST expression in this study.
Conclusions: REST was a prognostic factor in glioma, while REST4 was not. REST expression can be a predictor in evaluating the survival outcome of gliomas patients treated with RT+TMZ after surgery.
Keywords: REST, REST4, glioma, radiotherapy, chemotherapy, prognosis
Introduction
Glioma, one of the most common primary brain tumors, accounts for 74.6% of malignant brain and central nervous system (CNS) tumors.1 According to the National Comprehensive Cancer Network (NCCN) guidelines of CNS cancers, maximum surgical resection followed with radiotherapy (RT), plus concomitant and adjuvant chemotherapy (temozolomide, TMZ) is the recommended therapeutic strategy for newly diagnosed glioma.2 However, the median overall survival time of glioblastoma is still less than 15 months after treatment with this recommended therapy.3 Recently, several genetic alterations, such as IDH1 mutation4 and O-6-methylguanine-DNA methyltransferase (MGMT) methylation,5 have been identified as the prognostic biomarkers of glioma, which impels us to find more genetic biomarkers to make it more precise for gliomas diagnosis and target therapy.
REST (repressor element silencing transcription factor), also known as neuron restrictive silencer factor (NRSF), is a transcription repressor. By binding to its target genes, REST can regulate gene expression in neural and non-neural cells depending on cell types. In neural cells and tumors, REST acts as an oncogene. However, in non-neural cells and tumors, such as lung,6 breast,7 and colon,8,9 REST acts as a tumor suppressor.10 In neural cells, the dysregulation of REST was reported to be associated with neurological dysfunction, such as Parkinson’s disease,11,12 epilepsy,13 and ischemic stroke.14 In glioblastoma cells, REST promoted cell proliferation and migration.15 In medulloblastoma, REST expression was elevated, and high REST was correlated with poor prognosis.16
REST4, an alternative splicing variant of REST, was reported to be a nuclear target of REST because of its number five zinc finger motif.17 Recently, REST4 was demonstrated to be downregulated, and influence REST expression, in glioma.18 However, REST4 expression was only detected in eight glioma tissues, which needs further verification. Therefore, our work focuses on verifying the interaction between REST and REST4, and investigating whether REST4 will be a prognostic biomarker in glioma.
REST expression has been confirmed to be associated with glioma grades.18 In this study, we aimed to investigate the predictive and prognostic value of REST and its splicing variant, REST4, in glioma, and explore the influence of REST expression on RT and chemotherapy in glioma patients.
Materials and methods
Patients and tissue samples
A total of 89 primary glioma tissues and 10 normal brain tissues were enrolled in this study. All of these patients were recruited from Xiangya Hospital of Central South University from July 2015 to December 2016. Gliomas were diagnosed and graded by the Pathology Department of Xiangya Hospital according to the WHO (World Health Organization) grading system. In the present study, patients with chronic disease or other cancers were excluded. All participants gave written informed consent, and this study was approved by the Ethics Committee of the Institute of Clinical Pharmacology in Central South University. Tissue samples were stored in liquid nitrogen immediately after surgery until further experiments. The clinical characteristics, such as age, gender, MGMT promoter methylation, and IDH1 mutation were all collected from the case management system in Xiangya Hospital.
Treatment
According to the demand of patients, some of them chose the hospital near to their home to receive subsequent therapy, and only 40 patients received the RT plus TMZ concomitant and adjuvant chemotherapy in Xiangya Hospital. About 1 month after surgery, patients received a total dose of RT of 54–60 Gy, which was divided into 28–30 days, and 1.8–2.0 Gy daily. Concomitant and adjuvant chemotherapy (TMZ) was conducted with 120–150 mg per day during the RT. After these treatments for about 30 days, magnetic resonance imaging (MRI) was performed, and the short-term therapeutic efficacy was assessed according to the results of MRI. Based on the MRI, complete response (CR) was defined as the disappearance of all enhancing and non-enhancing tumor; partial response (PR) as a decrease of more than 50% of the diameter of the primary tumor; stable disease (SD) meant the remaining conditions or a small increase of under 25%; while progressive disease (PD) was defined as an increase of at least 25% in tumor size or the appearance of a new tumor.19 Also, the adverse reactions were recorded during therapy.
RNA extraction and quantitative real-time PCR (qRT-PCR)
Total RNA was extracted from all tissues by trizol reagent (Code No 9108, Takara Bio Inc., Shiga, Japan) according to the manufacturer’s protocol. The quality and quantity of extracted RNA was measured by a NanoDrop Spectrophotometer (Shimadzu Biotech, Beijing China). The extracted RNA was determined to be pure only when the A260/A280 ratio is 1.8 to 2.1. For the reverse transcription reaction, 1 μg of total RNA was used by PrimeScript™ RT reagent kit with gDNA Eraser (Perfect Real Time) (Code No RR047A, Takara Bio Inc., Kusatsu, Japan). The qRT-PCR was conducted by Light Cycle@480 II (Roche, Basel, Switzerland) by using a SYBR® Premix DimerEraser™ (Perfect Real Time) (Code No: RR091A, Takara Bio Inc.) in a 20 μL mixture according to the manufacturer’s protocol. The reaction was carried out at 95°C for 30 s for one cycle, and 95°C for 5 s, 55°C for 30 s, and 72°C for 30 s for 45 cycles. Primers used in these reactions are listed in Table 1. The relative expression of target gene was normalized to the endogenous gene β-actin, calculated by the 2−ΔΔCt method. All of this qRT-PCR was conducted in duplicate.
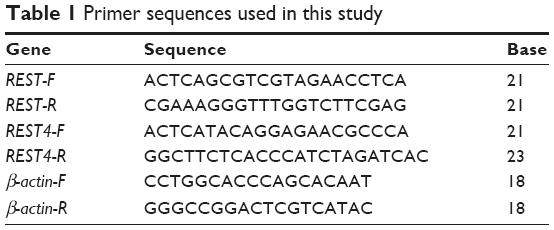 | Table 1 Primer sequences used in this study |
Expression analysis in GEO and TCGA database
Four expression profiles (GSE4271,20 GSE4412,21 GSE7696,22,23 and GSE429024) were obtained from the Gene Expression Omnibus (GEO; http://www.ncbi.nlm.nih.gov/geo/) database.25 All of these series were based on Affymetrix Human Genome U133 Plus 2.0 Array platform (Affymetrix Inc., Santa Clara, CA, USA). In GSE4271, 77 primary high-grade astrocytomas, including WHO grade III and IV astrocytomas, were analyzed. A total of 24 grade III and 50 grade IV gliomas were used in GSE4412, 80 glioblastomas, and four non-tumor tissues in GSE7696, and 23 non-tumor tissues, 157 gliomas (including 45 grade II, 31 grade III, and 81 grade IV) data were obtained in GSE4290. The clinical information and gene expression data of 152 glioblastoma multiforme (GBM) and 460 LGG (low grade glioma) patients were downloaded from The Cancer Genome Atlas (TCGA) (Illumina HiSeq) (http://www.cancergenome.nih.gov/). In this dataset, most of the gliomas patients were treated with RT and/or TMZ chemotherapy.
Statistical analysis
All statistical analyses were performed using SPSS 18.0 (IBM Corp, Chicago, IL, USA) and Graph Pad Prism 5 (Graph Pad Software, Inc, San Diego, CA, USA). The measurement data between two groups were compared by Student’s t-test, and performed with mean±standard deviation (SD). The goodness-of-fit chi-squared test was used to analyze the classified variable. Overall survival (OS) was deemed as the clinical end point of this study. The survival analysis was calculated by the Kaplan–Meier method and log-rank t-test to compare the difference between two groups, using the median value as the cutoff. Two-tailed P<0.05 was chosen for the criterion of statistical significance.
Results
REST is upregulated in glioma
Before experiments, we compared the expression difference of REST between glioma tissues and non-tumor brain tissues in the GSE4290 series of GEO datasets. As shown in Figure 1A, the expression level of REST was significantly elevated in glioma tissues compared with the normal brain tissues (P<0.001). The hierarchical cluster analysis also showed the upregulation of REST in glioma patients (Figure 2). Then, 89 glioma tissues and 10 normal brain tissues (six males and four females) were collected to verify REST expression by qRT-PCR. In this study, we found that REST was upregulated in gliomas compared to the normal brain tissues (Figure 1B, P<0.001), and this was in accordance with the analysis in GSE4290 and the reported manuscript.18
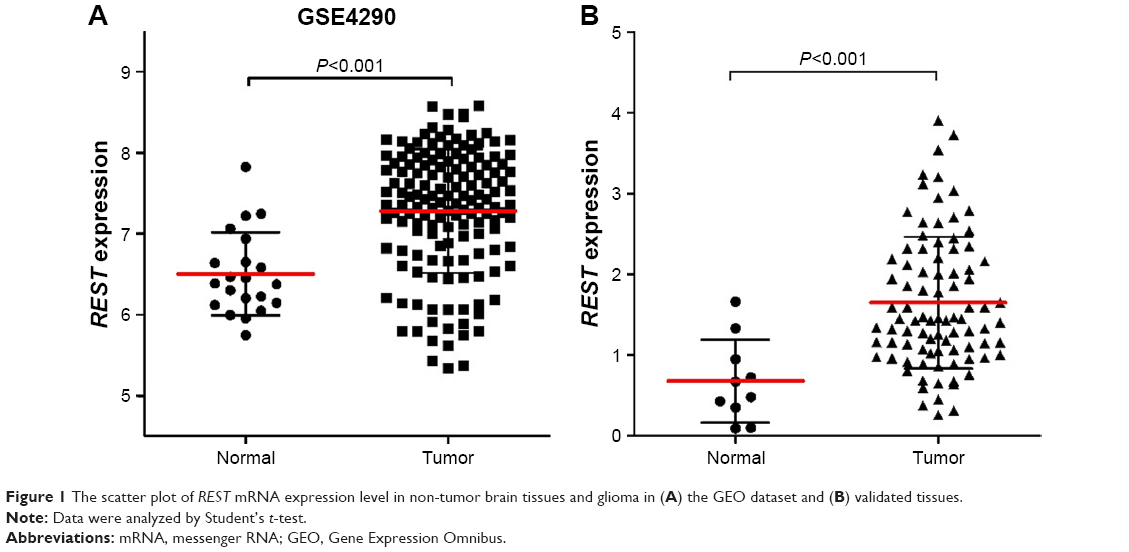 | Figure 1 The scatter plot of REST mRNA expression level in non-tumor brain tissues and glioma in (A) the GEO dataset and (B) validated tissues. |
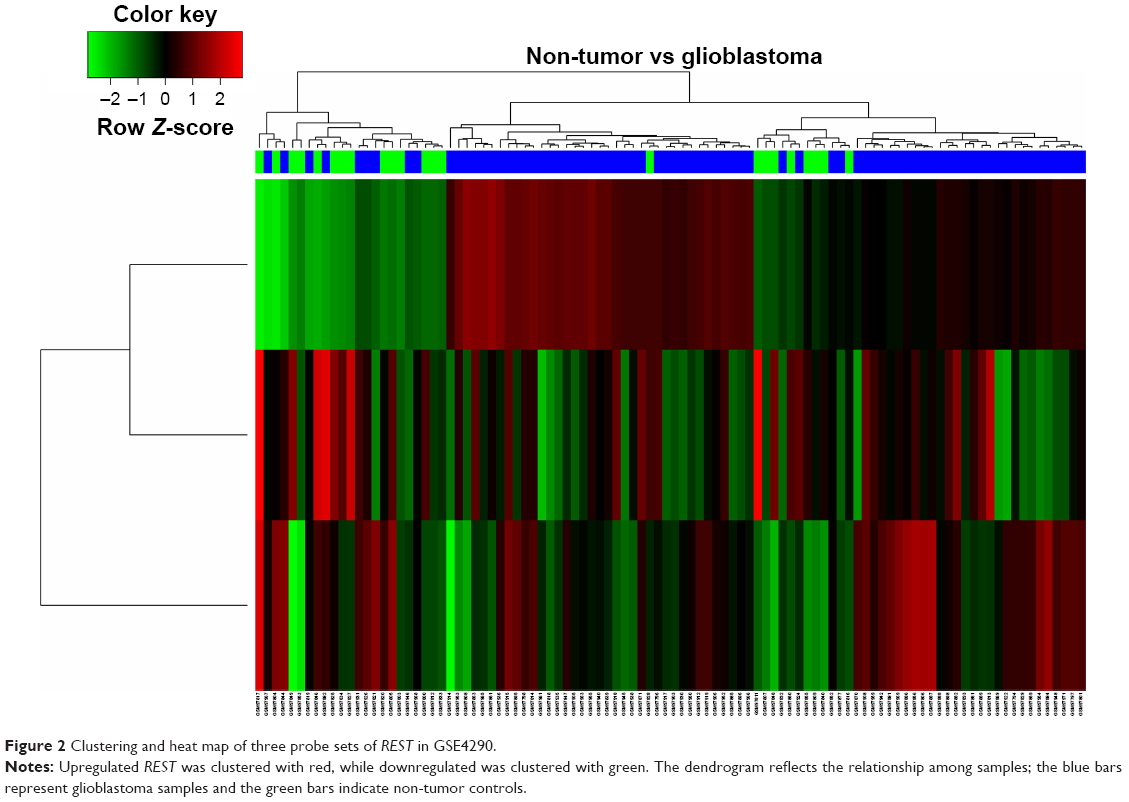 | Figure 2 Clustering and heat map of three probe sets of REST in GSE4290. |
Association between REST and clinical characteristics in glioma patients
To investigate the correlation between REST expression and clinical characteristics in glioma patients, we divided these patients into two groups (low REST expression group, n=44; high REST expression group, n=45) based on the median REST expression level. As listed in Table 2, there were no significant changes of REST expression in age, gender, or preoperative KPS (Karnofsky Performance Score). After chi-square (χ2) test, we found that REST expression was significantly associated with the WHO grade (P=0.015) and tumor size (P=0.037). REST expression was significantly higher in the high grade gliomas compared with the low grade gliomas in the GSE4290 series (Figure 3A, P<0.001) and the verification samples (Figure 3B, P=0.013). In other words, the expression level of REST was positively correlated with the malignant degree of gliomas. Further, high REST gliomas tissues were detected with high positive rates of Ki67 (P=0.026) and p53 (P=0.001). However, the IDH1 mutation and MGMT promoter methylation were not associated with REST expression in these tissues (P=0.604 and P=0.308, respectively).
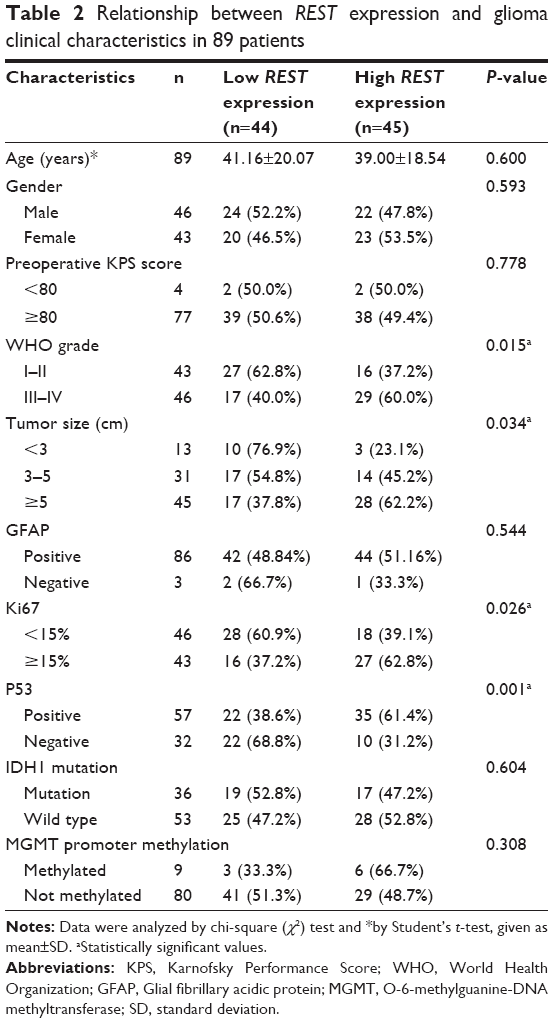 | Table 2 Relationship between REST expression and glioma clinical characteristics in 89 patients |
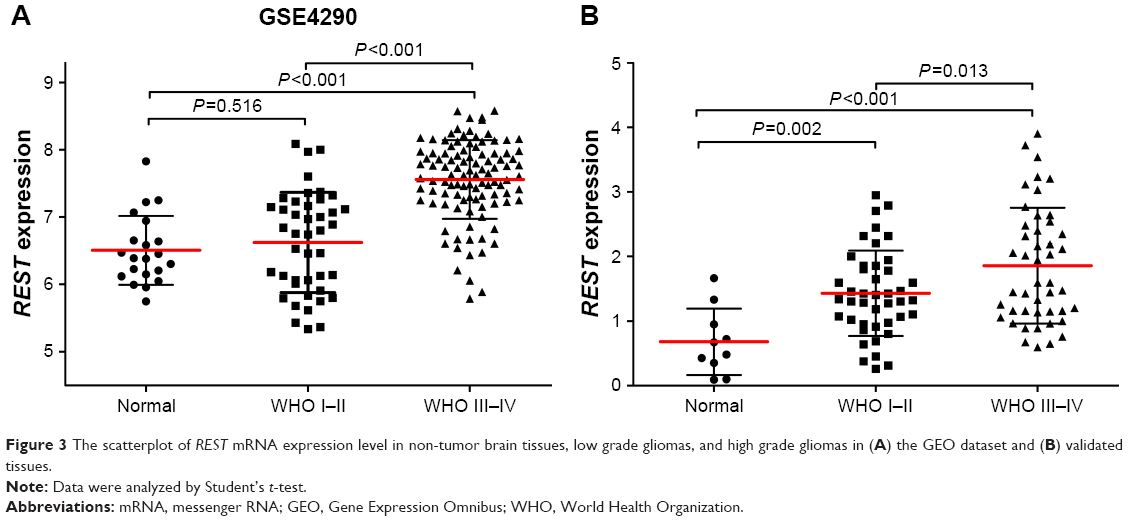 | Figure 3 The scatterplot of REST mRNA expression level in non-tumor brain tissues, low grade gliomas, and high grade gliomas in (A) the GEO dataset and (B) validated tissues. |
REST is a prognostic factor in glioma
To further determine the prognostic significance of REST in glioma, Kaplan–Meier analysis and log-rank t-test were carried out to analyze the relationship between REST expression and glioma patients’ OS in GEO and TCGA datasets. As shown in Figure 4, patients with low REST expression level showed a better prognosis than high REST in all GEO datasets (P=0.011, HR=2.038, 95% CI=1.180–3.520 in GSE4271; P=0.003, HR=2.59, 95% CI=1.328–3.842 in GSE4412; P=0.039, HR=1.801, 95% CI=1.031–3.844 in GSE7696) and the TCGA dataset (P<0.001, HR=1.933, 95% CI=1.450–2.576 in TCGA).
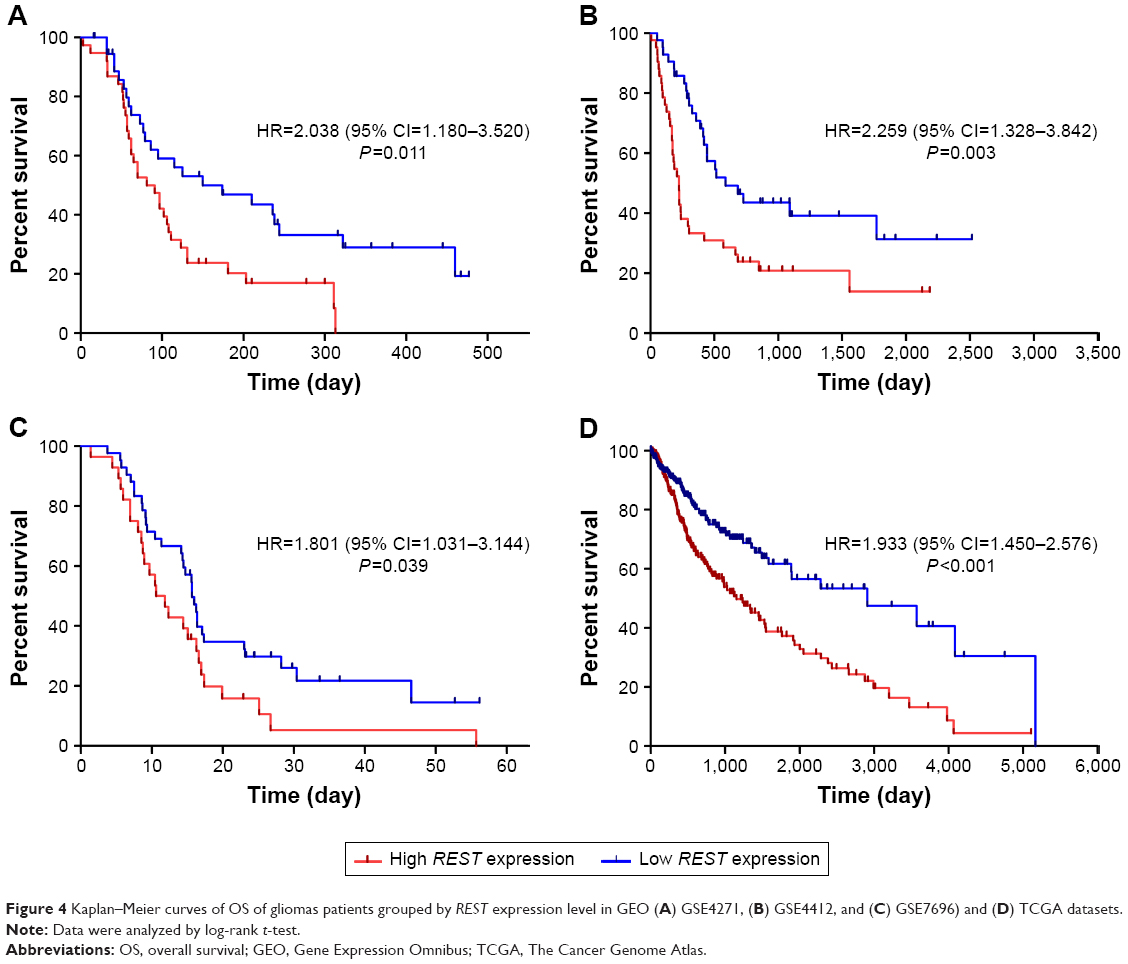 | Figure 4 Kaplan–Meier curves of OS of gliomas patients grouped by REST expression level in GEO (A) GSE4271, (B) GSE4412, and (C) GSE7696) and (D) TCGA datasets. |
Association between REST and RT+TMZ therapeutic efficacy in glioma patients
To further evaluate the association between REST expression and the therapeutic efficacy and toxicity after RT+TMZ treatment, 40 glioma patients treated with RT plus TMZ concomitant and adjuvant chemotherapy were enrolled. According to the MRI and the evaluated criteria mentioned in the method, 17 patients were categorized as CR+PR, and the response rate was 42.50% (17/40). Among these 17 patients, there were 12 in the low REST group and five in the high. The chi-square test showed that REST expression was associated with the therapeutic response after RT+TMZ treatment (Table 3, P=0.031). The survival analysis of TCGA datasets also showed that REST expression was significantly related to the OS of glioma patients treated with RT or chemotherapy (P<0.001, HR=1.995, 95% CI=1.423–2.797 in Figure 5A and P<0.001, HR=2.215, 95% CI=1.553–3.159 in Figure 5B, respectively). In other words, low REST expression glioma patients could achieve better therapeutic efficacy of RT or/and chemotherapy compared with the high REST patients.
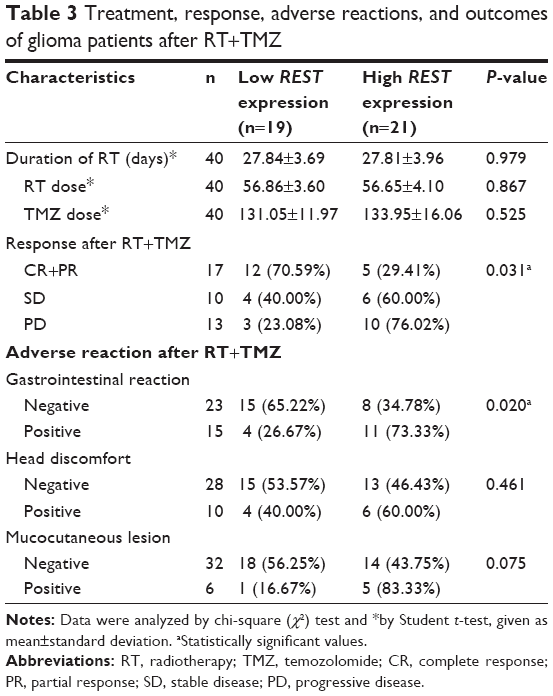 | Table 3 Treatment, response, adverse reactions, and outcomes of glioma patients after RT+TMZ |
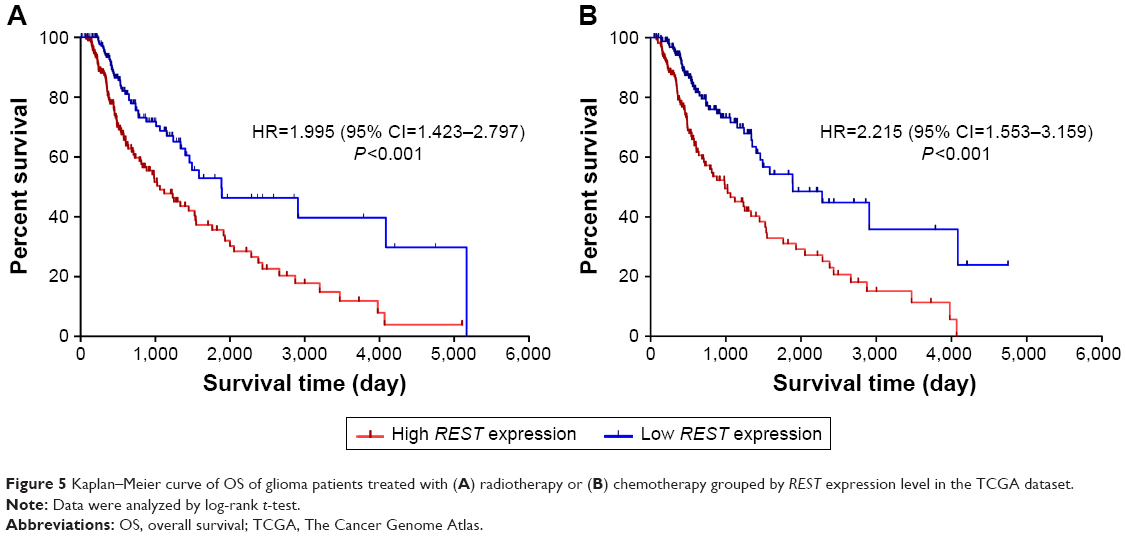 | Figure 5 Kaplan–Meier curve of OS of glioma patients treated with (A) radiotherapy or (B) chemotherapy grouped by REST expression level in the TCGA dataset. |
Apart from the therapeutic effects, we also observed the adverse reactions after RT+TMZ in these 40 glioma patients. As shown in Table 3, the expression level of REST was significantly associated with the occurrence of gastrointestinal reaction (P=0.002), but not associated with head discomfort and mucocutaneous lesion. In other words, it would be more probable for high REST glioma patients to have a gastrointestinal reaction after being treated with TMZ.
Expression of REST4 in glioma
Apart from the expression of REST, we also detected the expression of REST splicing variant, REST4 in glioma. First, there was no REST4 expression value in TCGA and GEO datasets because REST4 is a transcript of REST. Then, we detected REST4 expression in 89 glioma tissues and nine non-tumor brain tissues by using qRT-PCR. In these specimens, the positive rate of REST4 expression was 13.5% (12/77) based on the cut-off Ct value of 35.0. In the correlation analysis of REST4, we found there was no significant association between REST4 expression and REST or the clinical characteristics (Table S1).
Discussion
In this study, we validated that REST is upregulated in both GEO datasets and the verified glioma tissues. High REST expression was significantly associated with high WHO grades, high Ki67, and high TP53 mutation. As we all know, Ki67 is a proliferation marker,26 with scores also demonstrated to be associated with glioma patient’s survival.27 Also, it has been suggested as an important supplementary tool in the diagnostics and treatment of glioma.28 Further, TP53 is a well-known cell cycle arrest marker in cells.29,30 Based on these points, we can speculate that REST is a prognostic biomarker which associated with glioma cell’s proliferation and cell cycle arrest. This speculation is in accordance with Zhang et al’s15 study that REST can regulate glioblastoma cells proliferation and migration, partly through regulating the cell cycle. Therefore, we can strongly suggest that REST was a gene significantly associated with gliomas tumor size and WHO grades, based on its effects on cell proliferation and cycle arrest. Furthermore, this study also demonstrated that high REST glioma patients had short OS and bad outcomes.
Temozolomide is an orally alkylating agent which can cross the brain–blood barrier and exhibit antitumor activity by transforming to its bioactive metabolite, MTIC.31 RT plus concomitant TMZ chemotherapy is a common and recommended therapy which can significantly improve longevity and quality of life for patients with glioma.32 MGMT promoter methylation is a strong prognostic biomarker for glioblastoma patients treated with TMZ.33 In this study, we found that low REST glioma patients can get better therapeutic efficacy and less adverse reactions after treatment with RT plus concomitant TMZ chemotherapy. Data from the TCGA datasets also showed that low REST patients had better OS after RT or chemotherapy. The levels of MGMT promoter methylation were not associated with REST expression in our samples. For these circumstances, we can draw a speculation that REST may be a novel therapeutic pathway different from MGMT promoter methylation to influence the therapeutic efficacy of TMZ in glioma. However, the patients involved in this study are limited, especially those treated with RT plus TMZ, and further investigations should enroll more glioma patients so as to eliminate the possibility of false positives.
REST4, the splicing variant of REST, was reported to silence the repression activity of REST in neuronal cells.34,35 In this study, there was no significant correlation between the expression of REST and REST4. Also, REST4 was not related to glioma patients’ clinical characteristics. For the relationship between REST and REST4, different studies raise different opinions.36 Some reported that REST4 can bind to the REST DNA recognition sequence, NRSE/RE-1, so as to inhibit REST biological function.37 Some hold the view that REST4 impairs REST’s repression ability by binding to REST itself.35,38 Regardless of which ways REST4 binds to REST, it is confirmed that REST4 can influence the biological functions of REST, but not influence its expression level in glioma. In other words, it is not the way that REST4 silences REST repression ability by affecting REST expression level, but by changing REST protein structure or affecting the REST binding domain. Further, REST4 was not recommended as a prognostic biomarker in glioma in this study because of its low positive expression rate. Moreover, REST4 was not significantly associated with gliomas patients’ clinical characteristics. Although there was no direct relationship between REST and REST4 expression in this study, the molecular mechanism that REST4 regulates REST still needs further investigation.
In brief, this study provided the evidence that REST was a therapeutic predictor related to glioma patients’ outcome, but REST4 was not. Further, we found that REST expression level was related to the short-term therapeutic efficacy and adverse reactions of glioma patients after treatment with RT plus concomitant TMZ chemotherapy. Further studies should focus on the mechanism that REST influences glioma outcome and further validate the relationship between REST expression level and RT+TMZ therapeutic efficacy.
Acknowledgments
This study was partially funded by the Major Project of 863 Plan (No 2012AA02A517, 2012AA02A518), Foundation for Open Creative Platform in Higher Education of Hunan, China (No 13K002), and National Science and Technology Major Project (No 2012ZX09303013-004). Also, we thank the patients and volunteer tissue donors and the involved staff of Xiangya Hospital.
Disclosure
The authors report no conflicts of interest in this work.
References
Ostrom QT, Gittleman H, Xu J, et al. CBTRUS statistical report: primary brain and other central nervous system tumors diagnosed in the United States in 2009–2013. Neuro Oncol. 2016;18(suppl_5):v1–v75. | ||
Nabors LB, Portnow J, Ammirati M, et al. Central nervous system cancers, version 1.2015. J Natl Compr Canc Netw. 2015;13(10):1191–1202. | ||
Lam N, Chambers CR. Temozolomide plus radiotherapy for glioblastoma in a Canadian province: efficacy versus effectiveness and the impact of O6-methylguanine-DNA-methyltransferase promoter methylation. J Oncol Pharm Pract. 2012;18(2):229–238. | ||
Amankulor NM, Kim Y, Arora S, et al. Mutant IDH1 regulates the tumor-associated immune system in gliomas. Genes Dev. 2017;31(8):774–786. | ||
Cheng W, Li M, Jiang Y, et al. Association between small heat shock protein B11 and the prognostic value of MGMT promoter methylation in patients with high-grade glioma. J Neurosurg. 2016;125(1):7–16. | ||
Kreisler A, Strissel PL, Strick R, Neumann SB, Schumacher U, Becker CM. Regulation of the NRSF/REST gene by methylation and CREB affects the cellular phenotype of small-cell lung cancer. Oncogene. 2010;29(43):5828–5838. | ||
Lv H, Pan G, Zheng G, et al. Expression and functions of the repressor element 1 (RE-1)-silencing transcription factor (REST) in breast cancer. J Cell Biochem. 2010;110(4):968–974. | ||
Chang YT, Lin TP, Campbell M, et al. REST is a crucial regulator for acquiring EMT-like and stemness phenotypes in hormone-refractory prostate cancer. Sci Rep. 2017;7:42795. | ||
Svensson C, Ceder J, Iglesias-Gato D, et al. REST mediates androgen receptor actions on gene repression and predicts early recurrence of prostate cancer. Nucleic Acids Res. 2014;42(2):999–1015. | ||
Negrini S, Prada I, D’Alessandro R, Meldolesi J. REST: an oncogene or a tumor suppressor? Trends Cell Biol. 2013;23(6):289–295. | ||
Yu M, Suo H, Liu M, et al. NRSF/REST neuronal deficient mice are more vulnerable to the neurotoxin MPTP. Neurobiol Aging. 2013;34(3):916–927. | ||
Lu T, Aron L, Zullo J, et al. REST and stress resistance in ageing and Alzheimer’s disease. Nature. 2014;507(7493):448–454. | ||
Roopra A, Dingledine R, Hsieh J. Epigenetics and epilepsy. Epilepsia. 2012;53(Suppl 9):2–10. | ||
Noh KM, Hwang JY, Follenzi A, et al. Repressor element-1 silencing transcription factor (REST)-dependent epigenetic remodeling is critical to ischemia-induced neuronal death. Proc Natl Acad Sci U S A. 2012;109(16):E962–E971. | ||
Zhang D, Li Y, Wang R, et al. Inhibition of REST suppresses proliferation and migration in glioblastoma cells. Int J Mol Sci. 2016;17(5):pii: E664. | ||
Taylor P, Fangusaro J, Rajaram V, et al. REST is a novel prognostic factor and therapeutic target for medulloblastoma. Mol Cancer Ther. 2012;11(8):1713–1723. | ||
Shimojo M. Characterization of the nuclear targeting signal of REST/NRSF. Neurosci Lett. 2006;398(3):161–166. | ||
Ren H, Gao Z, Wu N, et al. Expression of REST4 in human gliomas in vivo and influence of pioglitazone on REST in vitro. Biochem Bioph Res Commun. 2015;463(4):504–509. | ||
Rizzo D, Scalzone M, Ruggiero A, et al. Temozolomide in the treatment of newly diagnosed diffuse brainstem glioma in children: a broken promise? J Chemother. 2015;27(2):106–110. | ||
Costa BM, Smith JS, Chen Y, et al. Reversing HOXA9 oncogene activation by PI3K inhibition: epigenetic mechanism and prognostic significance in human glioblastoma. Cancer Res. 2010;70(2):453–462. | ||
Freije WA, Castro-Vargas FE, Fang Z, et al. Gene expression profiling of gliomas strongly predicts survival. Cancer Res. 2004;64(18):6503–6510. | ||
Lambiv WL, Vassallo I, Delorenzi M, et al. The Wnt inhibitory factor 1 (WIF1) is targeted in glioblastoma and has a tumor suppressing function potentially by induction of senescence. Neuro Oncol. 2011;13(7):736–747. | ||
Murat A, Migliavacca E, Gorlia T, et al. Stem cell-related “self-renewal” signature and high epidermal growth factor receptor expression associated with resistance to concomitant chemoradiotherapy in glioblastoma. J Clin Oncol. 2008;26(18):3015–3024. | ||
Sun L, Hui AM, Su Q, et al. Neuronal and glioma-derived stem cell factor induces angiogenesis within the brain. Cancer Cell. 2006;9(4):287–300. | ||
Barrett T, Wilhite SE, Ledoux P, et al. NCBI GEO: archive for functional genomics data sets – update. Nucleic Acids Res. 2013;41(Database issue):D991–D995. | ||
Sahin S, Isik Gonul I, Cakir A, Seckin S, Uluoglu O. Clinicopathological significance of the proliferation markers Ki67, RacGAP1, and topoisomerase 2 alpha in breast cancer. Int J Surg Pathol. 2016;24(7):607–613. | ||
Arshad H, Ahmad Z, Hasan SH. Gliomas: correlation of histologic grade, Ki67 and p53 expression with patient survival. Asian Pac J Cancer Prev. 2010;11(6):1637–1640. | ||
Torp SH. Diagnostic and prognostic role of Ki67 immunostaining in human astrocytomas using four different antibodies. Clin Neuropathol. 2002;21(6):252–257. | ||
Li B, Gao Y, Rankin GO, et al. Chaetoglobosin K induces apoptosis and G2 cell cycle arrest through p53-dependent pathway in cisplatin-resistant ovarian cancer cells. Cancer Lett. 2015;356(2 Pt B):418–433. | ||
Bersani C, Xu LD, Vilborg A, Lui WO, Wiman KG. Wig-1 regulates cell cycle arrest and cell death through the p53 targets FAS and 14-3-3sigma. Oncogene. 2014;33(35):4407–4417. | ||
Grauer OM, Wesseling P, Adema GJ. Immunotherapy of diffuse gliomas: biological background, current status and future developments. Brain Pathol. 2009;19(4):674–693. | ||
Bailey S, Howman A, Wheatley K, et al. Diffuse intrinsic pontine glioma treated with prolonged temozolomide and radiotherapy – results of a United Kingdom phase II trial (CNS 2007 04). Eur J Cancer. 2013;49(18):3856–3862. | ||
Weller M, Tabatabai G, Kastner B, et al. MGMT promoter methylation is a strong prognostic biomarker for benefit from dose-intensified temozolomide rechallenge in progressive glioblastoma: the DIRECTOR trial. Clin Cancer Res. 2015;21(9):2057–2064. | ||
Lee JH, Chai YG, Hersh LB. Expression patterns of mouse repressor element-1 silencing transcription factor 4 (REST4) and its possible function in neuroblastoma. J Mol Neurosci. 2000;15(3):205–214. | ||
Shimojo M, Paquette AJ, Anderson DJ, Hersh LB. Protein kinase A regulates cholinergic gene expression in PC12 cells: REST4 silences the silencing activity of neuron-restrictive silencer factor/REST. Mol Cell Biol. 1999;19(10):6788–6795. | ||
Li C, Wang Z, Tang X, Zeng L, Fan X, Li Z. Molecular mechanisms and potential prognostic effects of REST and REST4 in glioma (Review). Mol Med Rep. 2017;16(4):3707–3712. | ||
Lee JH, Shimojo M, Chai YG, Hersh LB. Studies on the interaction of REST4 with the cholinergic repressor element-1/neuron restrictive silencer element. Brain Res Mol Brain Res. 2000;80(1):88–98. | ||
Hersh LB, Shimojo M. Regulation of cholinergic gene expression by the neuron restrictive silencer factor/repressor element-1 silencing transcription factor. Life Sci. 2003;72(18–19):2021–2028. |
Supplementary material
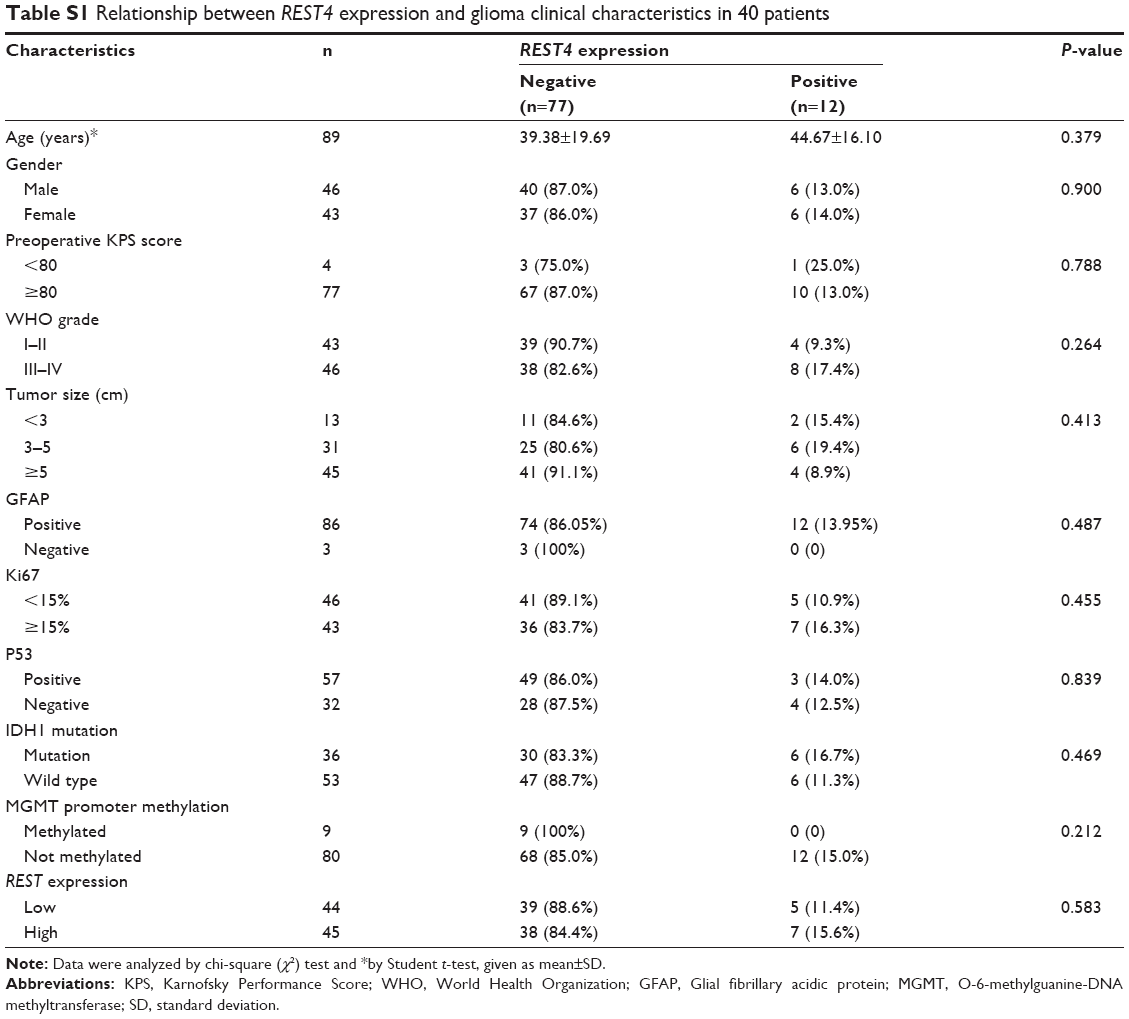 | Table S1 Relationship between REST4 expression and glioma clinical characteristics in 40 patients |
 © 2018 The Author(s). This work is published and licensed by Dove Medical Press Limited. The
full terms of this license are available at https://www.dovepress.com/terms
and incorporate the Creative Commons Attribution
- Non Commercial (unported, 3.0) License.
By accessing the work you hereby accept the Terms. Non-commercial uses of the work are permitted
without any further permission from Dove Medical Press Limited, provided the work is properly
attributed. For permission for commercial use of this work, please see paragraphs 4.2 and 5 of our Terms.
© 2018 The Author(s). This work is published and licensed by Dove Medical Press Limited. The
full terms of this license are available at https://www.dovepress.com/terms
and incorporate the Creative Commons Attribution
- Non Commercial (unported, 3.0) License.
By accessing the work you hereby accept the Terms. Non-commercial uses of the work are permitted
without any further permission from Dove Medical Press Limited, provided the work is properly
attributed. For permission for commercial use of this work, please see paragraphs 4.2 and 5 of our Terms.