Back to Journals » International Journal of Chronic Obstructive Pulmonary Disease » Volume 16
Responsivity and Reproducibility of Sputum Inflammatory Biomarkers During COPD Exacerbation and Stable Phases – A Pilot Study
Authors Ditz B, Kistemaker LEM, van den Berge M, Vonk JM ![]() , Gosens R, Kerstjens HAM
, Gosens R, Kerstjens HAM ![]()
Received 1 July 2021
Accepted for publication 27 September 2021
Published 10 November 2021 Volume 2021:16 Pages 3055—3064
DOI https://doi.org/10.2147/COPD.S326081
Checked for plagiarism Yes
Review by Single anonymous peer review
Peer reviewer comments 2
Editor who approved publication: Prof. Dr. Richard Russell
B Ditz,1,2 LEM Kistemaker,2– 4 M van den Berge,1,2 JM Vonk,2,5 R Gosens,2,3 HAM Kerstjens1,2
1Department of Pulmonary Diseases, University Medical Center, University of Groningen, Groningen, the Netherlands; 2Groningen Research Institute for Asthma and COPD, University Medical Center Groningen, University of Groningen, Groningen, the Netherlands; 3Department of Molecular Pharmacology of Groningen, University of Groningen, Groningen, the Netherlands; 4Aquilo BV, Groningen, the Netherlands; 5Department of Epidemiology, University Medical Center Groningen, University of Groningen, Groningen, the Netherlands
Correspondence: HAM Kerstjens
Department of Pulmonary Diseases, University Medical Center, University of Groningen, Groningen, the Netherlands
Email [email protected]
Introduction: There is a great interest to identify airway biomarkers to evaluate the potential and efficacy of anti-inflammatory therapeutic interventions. In this pilot study, we compared cytokine mRNA and protein levels of IL-6, IL-8, CCL2, CCL4, and TNF-α, as well as LTB-4 expression regarding their reproducibility and responsivity in induced sputum in COPD patients.
Methods: We recruited a cohort of 17 patients with a moderate COPD exacerbation, necessitating antibiotics and/or oral corticosteroids. Patients were followed for two consecutive stable phase visits. Cytokine mRNA and protein levels were measured in induced sputum samples.
Results: IL-6 and CCL4 protein levels decreased from exacerbation to stable phase, whereas their mRNA expression showed the same trend (not statistically significant). Coefficients of variation were overall lower (ie, more favorable for responsiveness) at protein levels compared to mRNA levels. No significant differences were observed in the reproducibility between cytokine mRNA expression and protein measurements. IL-6, IL-8, CCL2, and TNF-α gene expression levels yielded moderate to high intraclass correlation coefficients and/or Spearman correlation coefficients between both stable phase samples in contrast to their protein levels.
Conclusion: Our findings suggest that several protein levels yield better responsivity with lower noise-to-signal ratios compared to their respective mRNA levels. In contrast, cytokine mRNA expression was more reproducible as it varied less in a stable state than proteins. Future studies are needed with a larger sample size to further evaluate the differences of responsivity and reproducibility between cytokine mRNA and protein measurements, not only during exacerbations.
Keywords: COPD, exacerbation, induced sputum, cytokines, mRNA and protein levels
Introduction
Airway inflammation represents the main underlying feature in the pathogenesis of chronic obstructive pulmonary disease (COPD).1 Changes in pulmonary function as measured with spirometry are the main response parameters of treatment in COPD in daily clinical practice, but only poorly reflect both the burden to the patient and the underlying pathology. Therefore, there is a great interest to identify sensitive airway biomarkers to evaluate the potential and efficacy of for instance anti-inflammatory therapeutic interventions.2,3
A biomarker can be useful for monitoring if it changes markedly with treatment or over time when the severity of the underlying disease varies, but changes little under stable conditions. The former is called responsivity, the latter reproducibility. The optimum in general is both high responsivity and high reproducibility. The analysis of sputum represents a noninvasive and patient-friendly method that allows the objective assessment of response to treatment and disease activity in the lower airways.4 It has been repeatedly shown that COPD patients have higher numbers of inflammatory cells, as well as higher concentrations of various inflammatory markers in induced sputum compared to healthy controls.5–7
Assessment of the reproducibility and responsivity of cytokine measurements in sputum represents a crucial milestone on the path of finding robust sputum biomarkers. Several factors affect these outcomes negatively, including the inability to cough up spontaneous sputum in some patients and the variable dilution effects in induced sputum samples by nebulized saline solutions. Further technical problems include dithiothreitol (DTT) pretreatment which is used to dissolve disulfide bonds to make sputum less viscous, but can also dissolve the same bonds in several cytokines leading to modified levels.8,9 Finally, it is conceivable that treatments tested for their effect on sputum inflammation can have an effect by themselves on sputum cytokine concentrations by affecting the water content, such as anticholinergic medication.
The methodological problems in the determination of protein levels and variable dilution have contributed to studies failing to demonstrate consistent associations between the reduction of COPD symptoms, exacerbations, and cytokine concentrations in induced sputum amongst others in studies investigating the effect of corticosteroids or anticholinergics.10–12
In the light of prospective COPD interventional studies, it is necessary to identify robust airway biomarkers that overcome these technical limitations. A conceptually attractive approach is the analysis of m (messenger) RNA instead of protein levels as an inflammatory marker since the level of mRNA can be normalized to a housekeeping gene, circumventing at least the variable dilution involved in induced sputum with saline. To our knowledge, there is only little data regarding the longitudinal analysis of cytokine mRNA expression in induced sputum samples. We hypothesized that assessing cytokine activity by measuring their RNA expression might help reduce the measurement noise in sputum inductions and improve both responsivity and reproducibility. In this prospective study, we aimed to compare cytokine mRNA and protein levels of IL-6, IL-8, CCL2, CCL4, and TNF-α, as well as LTB-4 expression regarding their responsivity (exacerbation to stable phase) and reproducibility (stable to stable phase) in induced sputum in COPD patients to assess their potential as an outcome measure.
Methods
Subjects
Patients with COPD were included at the occurrence of a moderate exacerbation necessitating antibiotics and/or oral corticosteroids, in the outpatient setting. Patients had to be smokers or ex-smokers with a smoking history of more than 10 pack-years, aged above 40 years, with a postbronchodilator FEV1 below 80% of predicted but above 0.8 L, and with a postbronchodilator FEV1/forced vital capacity (FVC) below 0.7.2 Patients with pneumonia as determined by X-ray, intake of oral prednisolone and/or antibiotics longer than 48 h, need for mechanical ventilation, treatment with immune-modulating agents, a history of asthma, or significant other diseases that could influence the result of the study were excluded. The study was performed following the principles stated in the Declaration of Helsinki. The local medical ethics committee (University of Groningen, Groningen, the Netherlands) approved the study. Written informed consent was obtained from all patients. The study was registered with Clinical trials.gov (NCT03924843).
Study Design
We recruited a cohort of patients with a moderate COPD exacerbation. These patients were followed for two consecutive stable phase visits. The first stable phase visit took place after at least six weeks of the initial visit and the cessation of oral prednisolone and/or antibiotic treatment. The second was subsequently done still in the stable phase, approximately one week after the first stable phase visit. At each visit, the medical history was evaluated and a physical examination was performed by a physician who also evaluated the presence of an exacerbation. In addition, spirometry was performed, followed by sputum induction (SI).
Sputum Induction and Processing
We used one of two methods for SI, employing different saline solutions, which was dependent on the degree of bronchoconstriction to perform SI safely in patients with a low FEV1. We adapted a protocol by Bathoorn et al, starting with a 0.9% saline solution in shorter exposure times and gradually increasing tonicity in subjects with a lower FEV1, leading to closer monitoring time of the decrease in FEV1 (Figure 1).13
- If the FEV1 was >1.5 L, SI was performed using a 5% hypertonic saline solution three times for five minutes (ie, regular protocol).
- If the FEV1 was <1.5 L, but >0.8 L, SI was started using a 0.9% saline solution, and its tonicity was gradually increased, as depicted in Figure 1 (ie, cautious protocol).
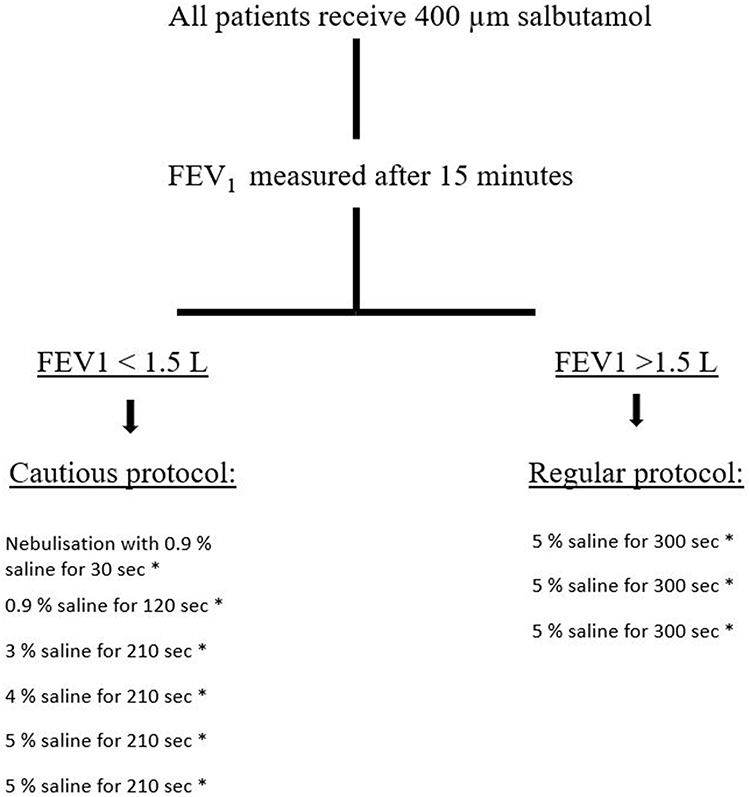 |
Figure 1 Sputum induction protocol. Abbreviations: FEV1, forced expiratory volume in 1 second; L, liters. Notes: If the decrease in FEV1 is >20%, the sputum induction is stopped. If the decrease in FEV1 is 10 to 20% of the postsalbutamol inhalation FEV1, patients receive 200 µg salbutamol. After 10 min FEV1 is measured again. If FEV1 is <90% of baseline FEV1, the SI is stopped. After each step, the patients are asked to cough up sputum. As far as feasible, patients are encouraged to complete all of the steps of the entire protocol. aFEV1 is measured. |
Study participants underwent the same sputum induction protocol with the same nebulized saline solutions during exacerbation and stable phase visits (eg, when the cautious protocol was stopped after 3% saline solution, due to a drop in FEV1, during the exacerbation visit, the follow-up sputum inductions were also stopped after 3% saline solution). Furthermore, follow-up sputum inductions took place at the same time of the day, compared to the exacerbation visit, to mitigate potential effects caused by circadian variations of sputum inflammatory cells during all three visits.
Processing/Analysis
The volume of the induced sputum samples was determined by weighing. The sample was then mixed with an equal volume of 0.1% sputolysin (dithiothreitol, DTT, Calbiochem, USA). To ensure complete homogenization, the samples were placed in a shaking water bath at 37°C for 15 min, once interrupted by gently mixing the sample. The homogenized sputum was centrifuged (350× g) for 10 min at 20°C. The cell-free supernatant was collected and stored in aliquots at −80°C pending analysis of soluble mediators. The cell pellet was then resuspended in phosphate-buffered saline (PBS) containing 1% (w/v) human serum albumin (HSA), pH 7.4, to a final volume of 2–5 mL, followed by filtration through a nylon gauze (pore size approximately 48 µm, Thompson, Ontario) to remove clumps.
Total cell numbers were counted and the percentage of squamous cells was determined. In case >80% of cells were squamous cells, the sample was rejected and an additional sputum induction was performed (one sample). A differential cell count was subsequently performed on the cells, mRNA was extracted from cells, and biomarker concentrations were measured in the supernatant. For a differential cell count, cytospin-preparations were stained with May–Grünwald, and Giemsa and a cell count was performed by counting at least 400 cells in duplicate in a blinded fashion. LTB4 and protein levels of cytokines (IL-6, IL-8, CCL2, CCL4, and TNF-α) were determined using ELISA. The cell pellet was stored in a lysis buffer until extraction. Total RNA was extracted, reverse transcribed into cDNA, and subjected to qRT-PCR. The number of cells was limited for certain samples, and to guarantee samples of sufficient quality, only samples with an RNA concentration >5 ng/µL were included in the analysis (12 samples rejected). Real-time PCR data were analyzed using the comparative cycle threshold (Ct: amplification cycle number) method. The amount of the target gene was normalized to the endogenous reference gene SDHA.
Statistical Analysis
Demographic variables are presented as median values (interquartile range, IQR). The endpoint parameters were mRNA levels of IL-6, IL-8, CCL2, CCL4, and TNF-α, next to the respective cytokine protein levels. In addition, inflammatory cell profiles and LTB4 lipid concentrations were assessed. Sputum inflammatory cell counts and cytokine protein levels were log-transformed (after adding 0.1 to each variable). Mean values and standard deviations (SD) were computed and presented, or median with IQR in case of non-normally distributed variables after log-transformation. Responsivity was described as the change in measurements from visit 1 (exacerbation) to visit 2 (stable phase). Non-normally distributed variables were analyzed using Wilcoxon signed rank test, and normally distributed variables using paired t tests. To circumvent the variable number of protein and mRNA samples, we also calculated the coefficient of variation (CV) from exacerbation to stable phase, as the SD/absolute mean difference. A smaller CV denotes more response signal relative to the variability (better noise to signal ratio). We calculated intraclass correlation coefficients (ICC), applying a two-way random effects model, to assess the reproducibility of measurements between the two stable phase visits (visit 2 and 3). A higher ICC denotes a more reproducible test. Since several protein levels could not be normalized to a normal distribution to allow for among others the ICC calculation, we also calculated Spearman correlation coefficients between the two stable phase visits. The statistical analyses were performed using R software (v3.6.1).
Results
Twenty-one COPD participants were recruited. Four participants were excluded after the baseline visit due to the inability to cough up a sputum sample, their request, and repetitive COPD exacerbations. The baseline characteristics of the patients included in the current analyses are presented in Table 1 and their inflammatory parameters in Tables 2 and 3. The median squamous cell contamination was 6.6% in sputum samples during exacerbation and 30.7% during stable phases. The median sputum viability was 83.7% during exacerbation and 81.5% during stable phases.
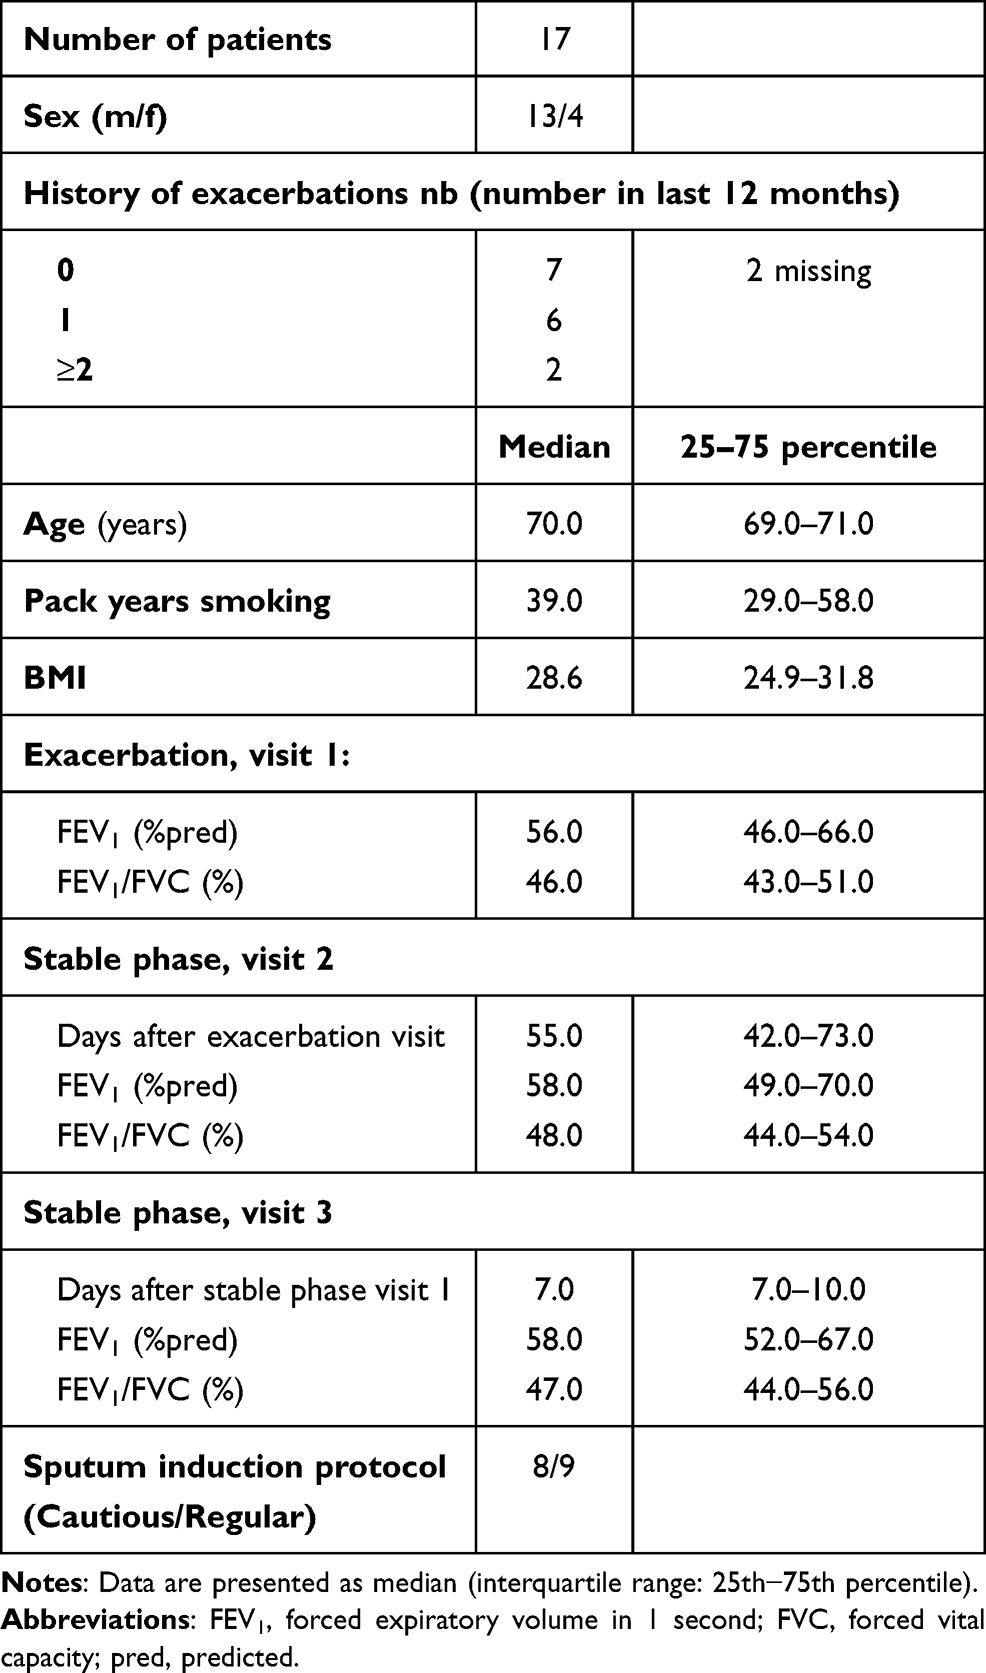 |
Table 1 Baseline Clinical and Demographic Characteristics |
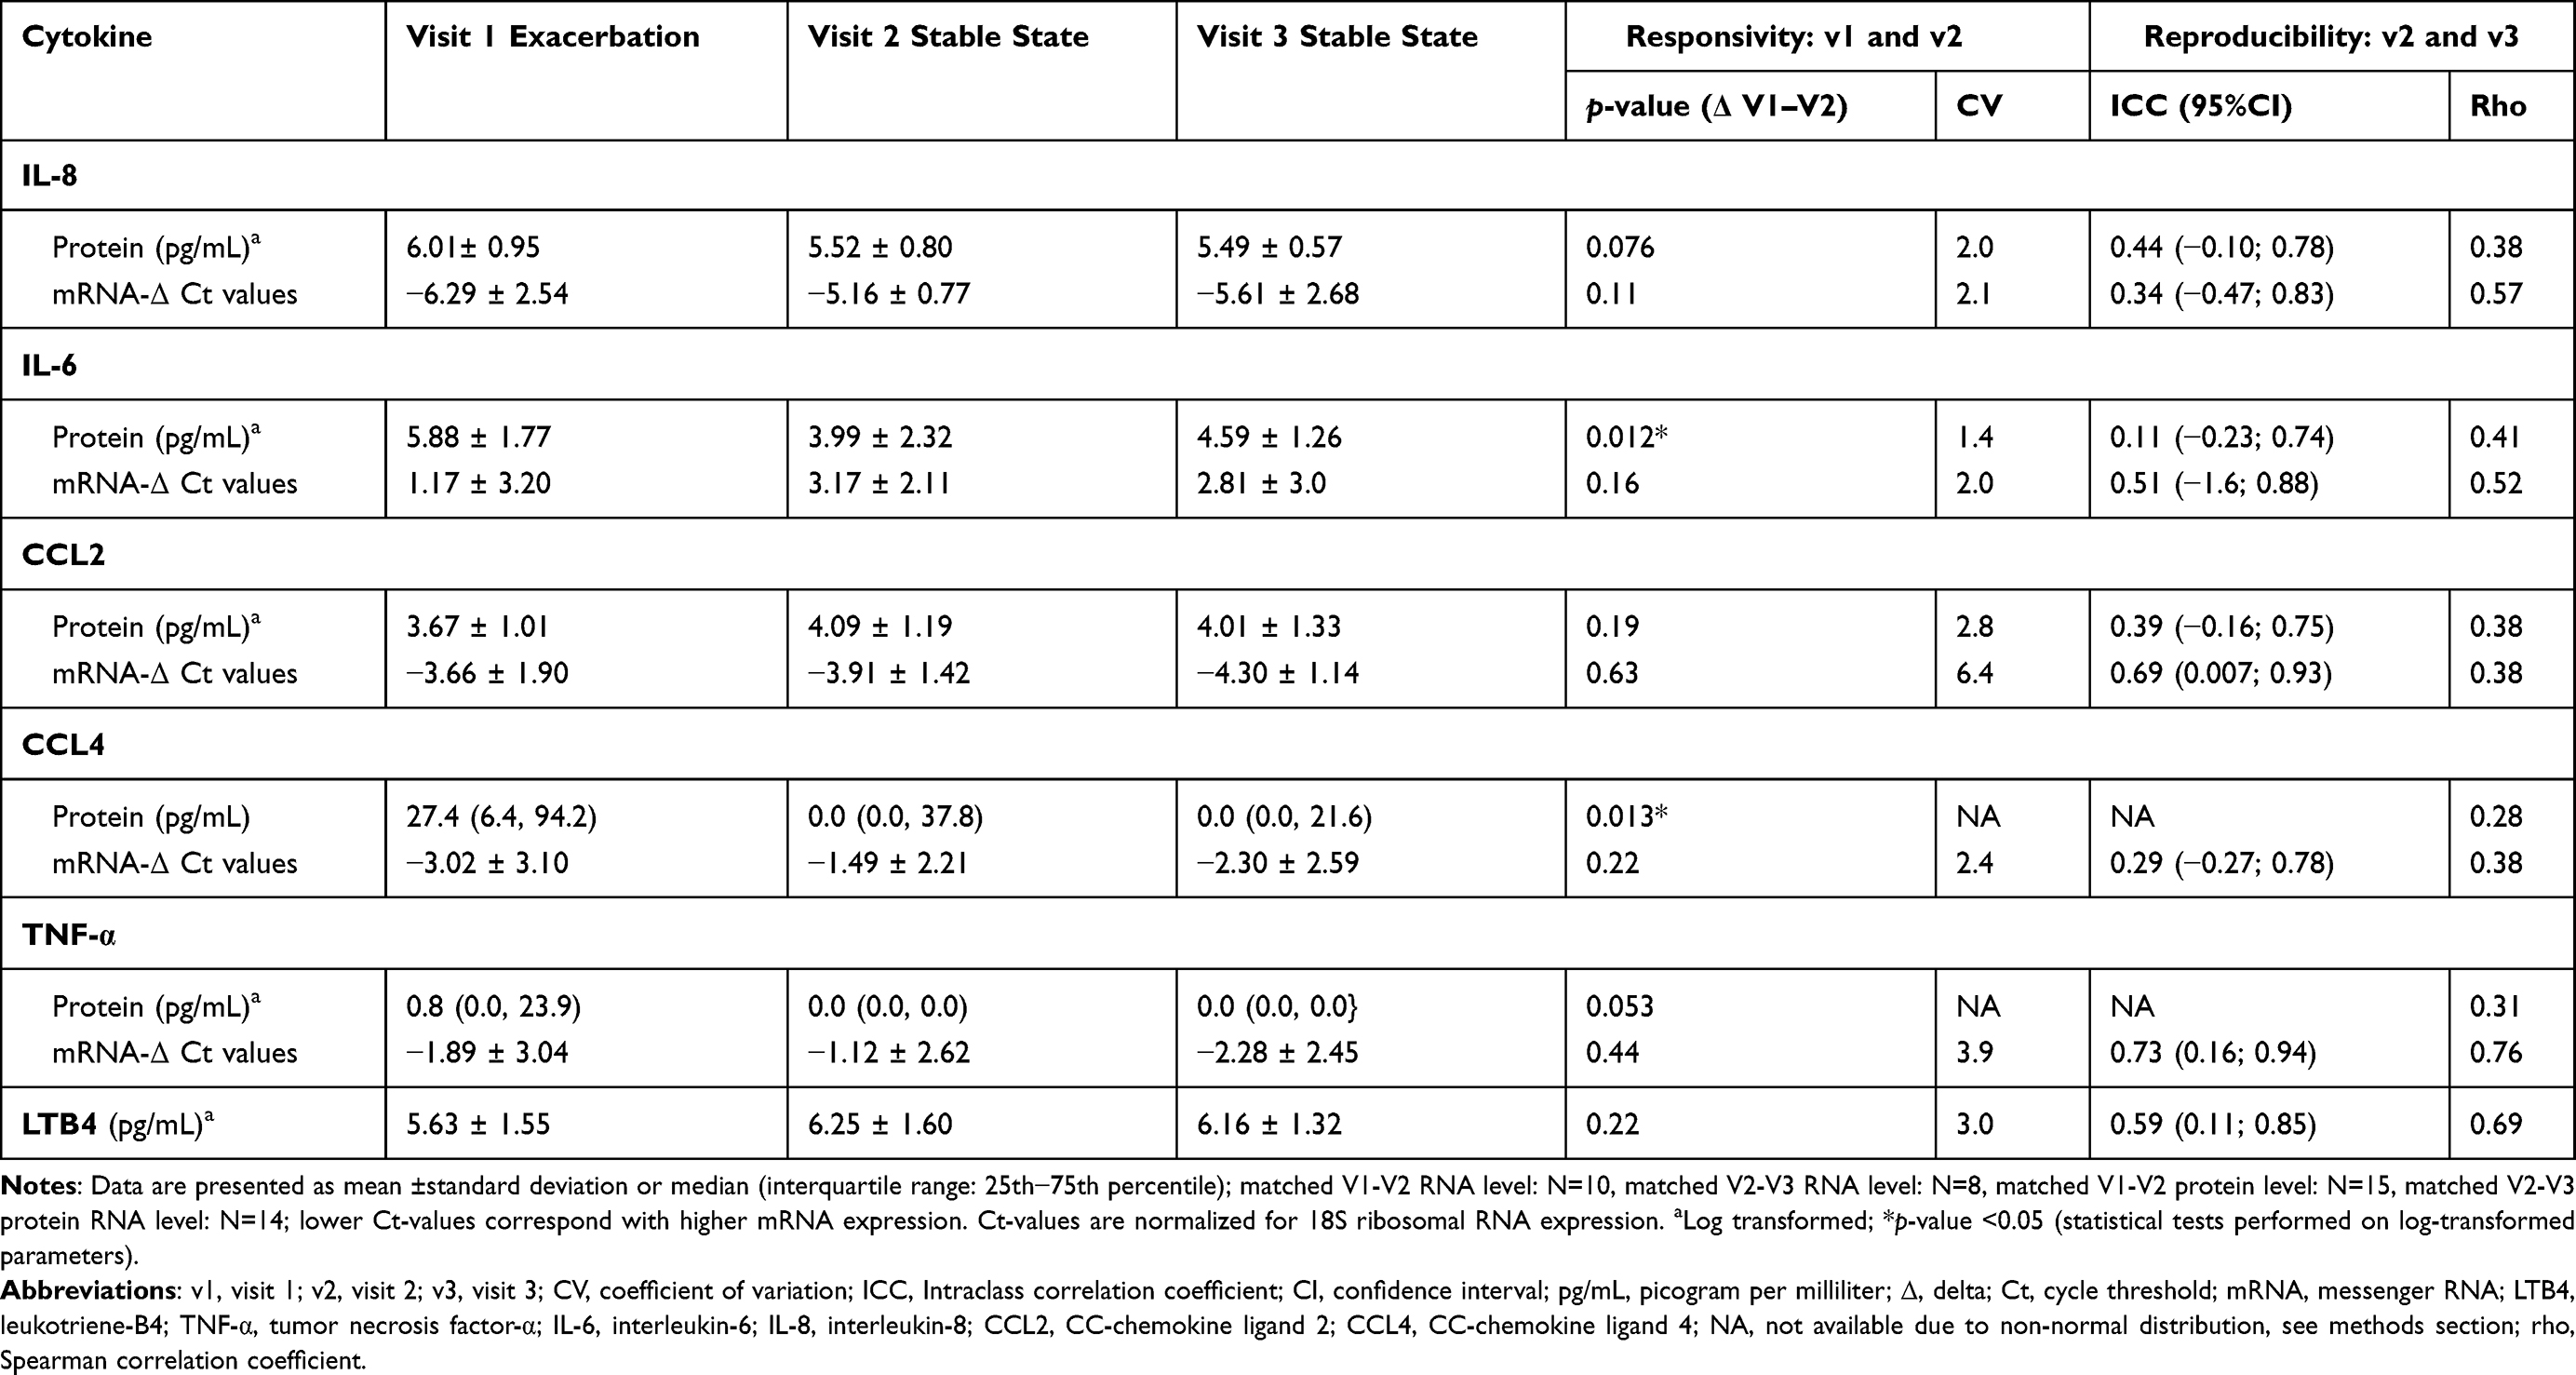 |
Table 2 Sputum Inflammatory Cytokine Markers |
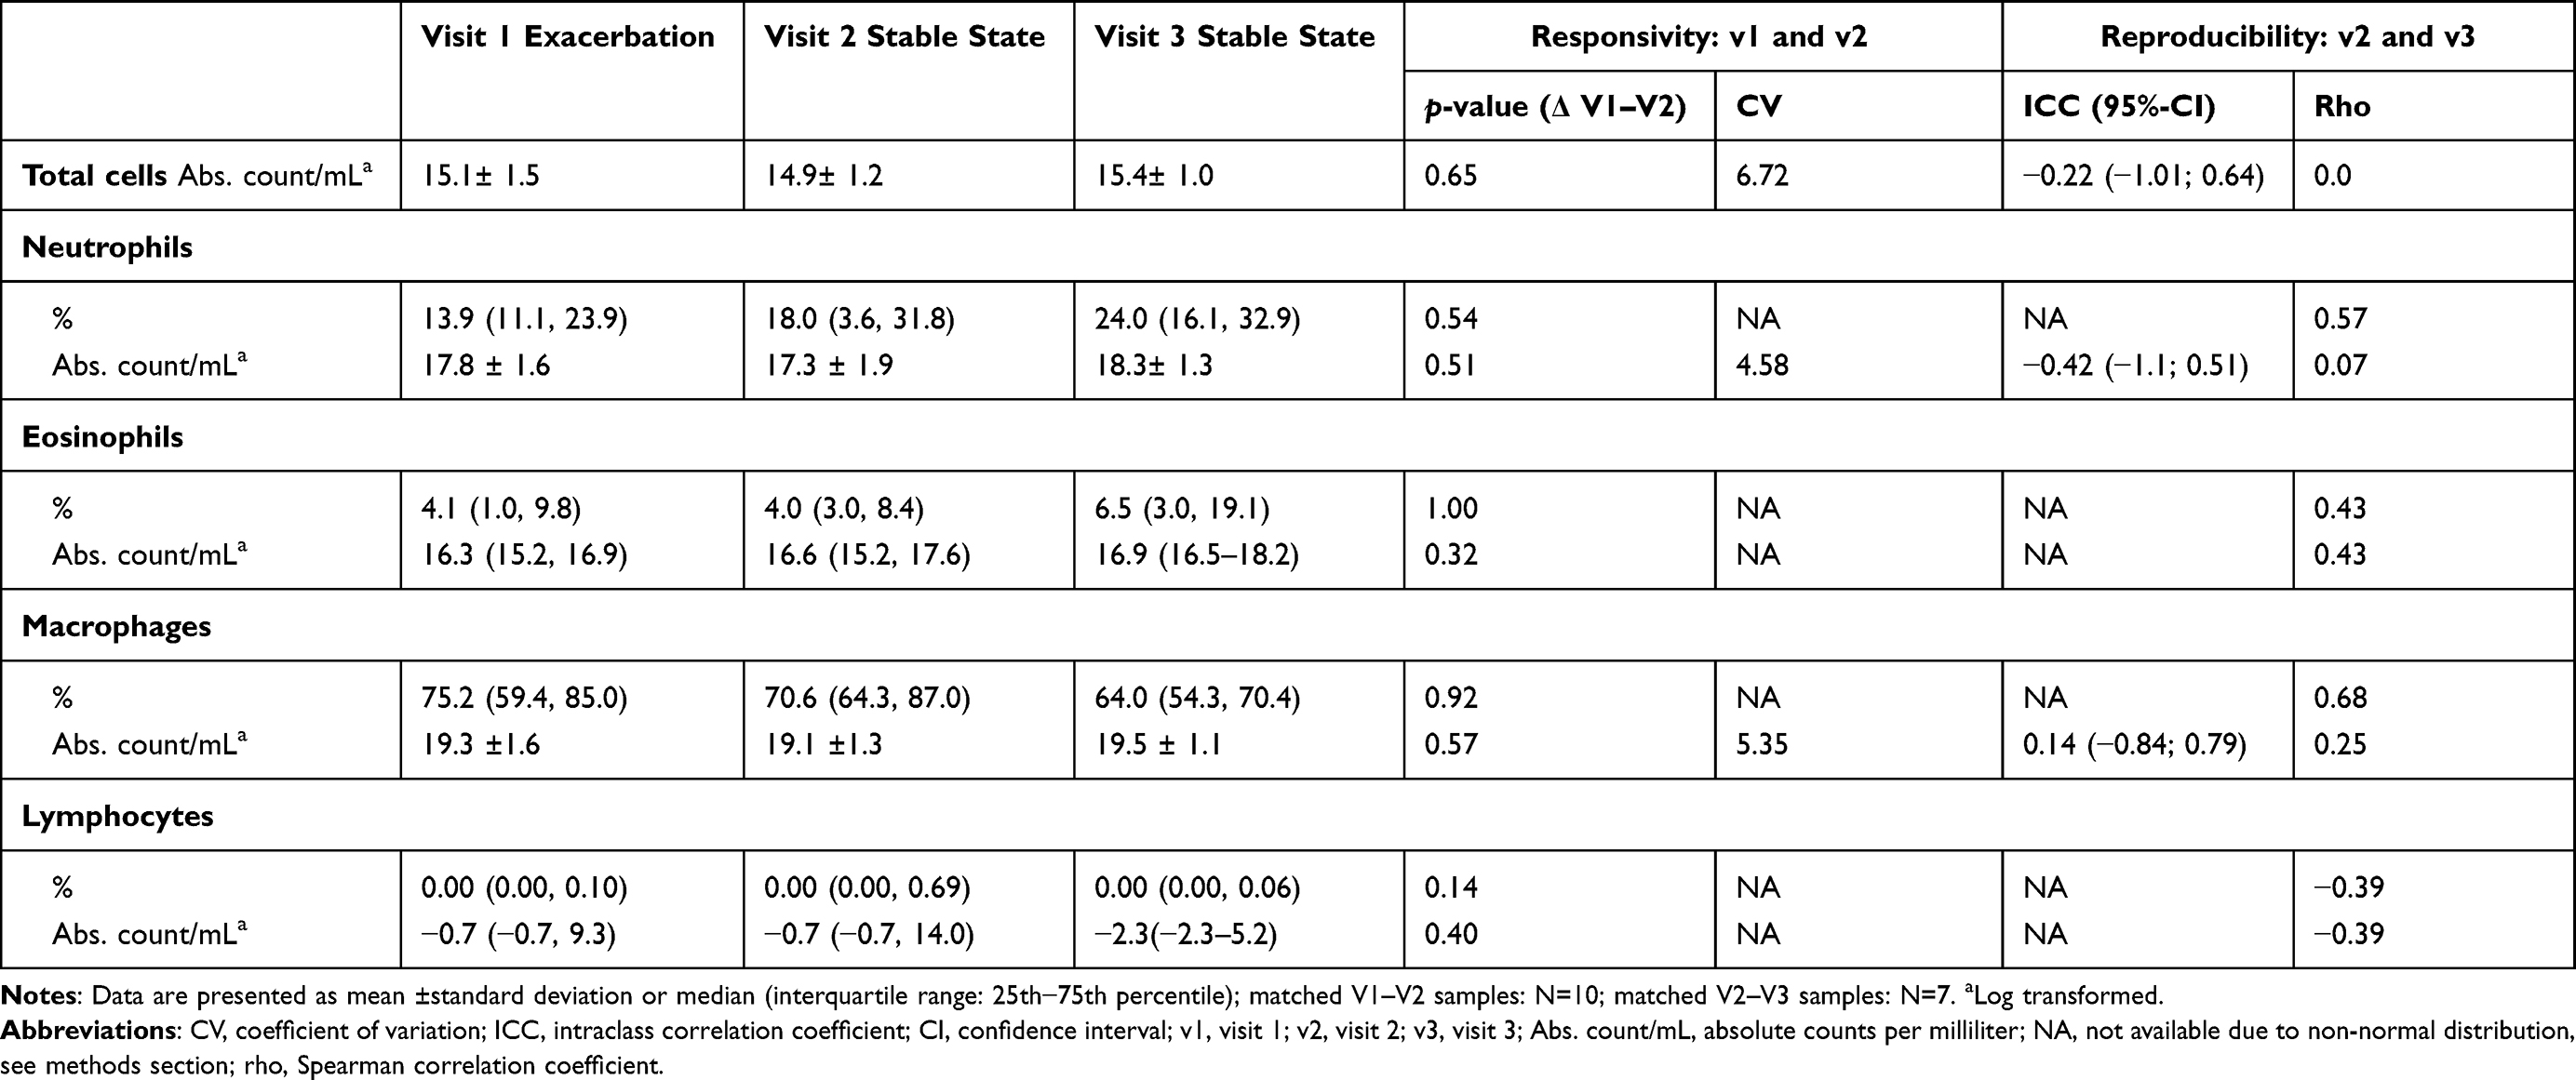 |
Table 3 Sputum Inflammatory Cells |
Responsivity
The responsivity of sputum cytokine measurements was evaluated between visit 1 (exacerbation) and visit 2 (stable phase), which consisted of a median period of 55 days.
Fifteen matched sputum samples were analyzed, whereas 10 matched sputum samples were of sufficient mRNA quality for this analysis. IL-6 and CCL4 protein levels decreased from exacerbation to stable phase (p-value <0.05). The change in mRNA expression of IL-6 and CCL4 showed the same trend but was not statistically significant (p-value >0.05). No significant changes were identified for the cytokines IL-8, CCL2, and TNF-α at protein or mRNA-levels nor for LTB4 between the exacerbation and stable phase visit (Table 2). Coefficients of variation (CV) were calculated to evaluate the variability versus signal independently of the number of samples; these were overall lower (ie, more favorable for responsivity) at protein levels compared to mRNA levels.
Next to cytokines, inflammatory cell counts and cell percentage from 10 matched sputum samples showed no statistically significant differences between the exacerbation and stable phase (Table 3). Coefficients of variation could only be calculated for absolute counts of neutrophils and macrophages and could not be calculated for their respective cell percentages, due to their non-normal distribution.
Reproducibility
The reproducibility of sputum cytokine measurements was evaluated between two stable phases, which consisted of a median interval of seven days.
Fourteen matched sputum samples were analyzed for cytokine protein levels. Eight matched sputum samples exhibited sufficient mRNA quality and were included for this analysis. Intraclass correlation coefficients were moderate for IL-6 (mRNA: 0.51), CCL2 (mRNA: 0.69), and LTB4 (0.59) and good for TNF-α (mRNA: 0.73). The confidence intervals of the intraclass correlation coefficients were overlapping for mRNA levels and protein levels of IL-8, Il-6, and CCL2. Therefore, no significant difference in the reproducibility of these measurements between mRNA and protein levels was observed. Intraclass correlation coefficients could not be computed for protein levels of CCL4 and TNF-α since these showed non-normal distribution after log-transformation.
Spearman correlation coefficients between the two stable phase visits were moderate for mRNA levels of IL-8 (rho=0.57), IL-6 (rho=0.52), TNF-α (rho=0.76) and better than the correlations of their respective protein levels which were poor.
Next to cytokines, seven matched sputum samples were available for inflammatory cell count analysis. ICCs could be calculated for absolute counts of neutrophils and macrophages and could not be calculated for their respective cell percentages due to their non-normal distribution. Spearman correlation coefficients were moderate for cell percentages of neutrophils (rho=0.57) and macrophages (rho=0.68) in contrast to their absolute cell counts which were poor.
Discussion
In this prospective pilot study, we assessed the responsivity and reproducibility of cytokine mRNA compared to protein levels of IL-6, IL-8, CCL2, CCL4, and TNF-α in induced sputum samples from COPD subjects to evaluate their relative potential as an objective outcome measure.
To evaluate responsivity, matched samples were compared from exacerbation to stable phase. Protein levels of IL-6 and CCL4 decreased after an exacerbation, whereas IL-8 and TNF-α followed the same direction without reaching statistical significance, not dissimilar from earlier reports.14–16 mRNA expression levels of these cytokines showed the same trend but did not reach statistical significance in our study. Importantly, fewer samples had sufficient mRNA quality (N=10) for subsequent analysis compared to protein levels (N=15). Therefore, the power of the analysis for mRNA expression was reduced, compared to proteins, which might be the explanation for the lack of significant effects for IL-6 and CCL4 mRNA expression. To circumvent the problem of lower sample size, we also calculated the coefficient of variation (CV), which is independent of sample size as opposed to formal statistical testing. In our analyses, the CVs were also higher for RNA levels compared to protein levels, ie less favorable, again not favoring mRNA as the more responsive measurement.
To evaluate the reproducibility, matched samples from stable phases were compared (median interval seven days). No significant differences were observed in the reproducibility between cytokine mRNA expression and protein measurements. Again, fewer matched samples were available for mRNA expression (N=8) than for protein analysis (N=14), thus reducing the power of this analysis. Intraclass correlation coefficients and/or Spearman correlation coefficients were moderate for gene expression levels of IL-6, IL-8, CCL2, and TNF-α, and were generally much lower for protein levels.17 This suggests that assessing gene expression might yield more reproducible results compared to protein levels. However, this hypothesis requires careful interpretation, and future studies with a larger sample size are needed to confirm this assumption.
No differences were identified for absolute cell counts and cell percentages concerning their responsivity between exacerbation and stable phase. Further, the responsivity of cell counts and cell percentages could not be compared since no coefficients of variation could be calculated due to non-normal distribution. For the same reason, no intraclass correlation coefficients could be calculated for most cell counts and cell percentages. Spearman correlation coefficients were moderate for cell percentages of neutrophils (rho=0.57) and macrophages (rho=0.68) between both stable phases in contrast to their absolute cell counts, suggesting that inflammatory cell percentages might yield more reproducible results compared to absolute cell count levels.
There are several strong points of this study. First, it has been shown that the duration of sputum induction and varying saline solutions during sputum inductions can affect the cellular and biochemical composition in sputum samples.18 Our study participants underwent the same sputum induction protocol during stable phase visits compared to their exacerbation visits in this study. Thus, the same nebulized saline solutions were administered during the follow-up sputum inductions to control for the dilutional effect which might be caused by different saline solutions during sputum inductions.
Second, to yield optimal RNA expression data, sputum samples were processed according to the “whole sputum method”, and were immediately stabilized using an mRNA-stabilizing kit. Frøssing et al have recently demonstrated that sputum collected using the “whole sputum method” is a reliable method for inflammatory phenotyping and for gene expression analysis, and yields superior results compared to the “plug selection method”.19
Third, there is preliminary evidence that circadian variations of sputum inflammatory cells might affect outcomes in subjects with respiratory diseases.20 Therefore, follow-up sputum inductions took place at the same time of the day during all three visits in this study, compared to the exacerbation visit, to mitigate possible effects caused by circadian variations. Nevertheless, more research is needed to investigate the impact of diurnal variation on sputum inflammatory cells in COPD.
Fourth, sputum samples need to be processed after collection and are generally pretreated with dithiothreitol (DTT) to dissolve the sticky sputum. It has been shown that DTT pretreatment can influence the detection of cytokine protein and gene expression levels in sputum sample.8,9 Therefore, in our study, all sputum samples were uniformly processed with DTT to allow standardization in this study, but this does not fully overcome the measurement errors due to the DTT introduction itself.
There are also limitations related to our study. No power calculation was performed for our primary outcome since mRNA cytokine markers have not been studied well enough in induced sputum samples from COPD subjects. We aimed for 15 fully evaluable subjects, based on similar methodological studies in sputum evaluating other readouts. In our study, considerably fewer matched samples were available for mRNA expression compared to protein analysis, suggesting that the cytokine mRNA expression analyses were underpowered and perhaps limiting their usefulness. Follow-up studies could consider making fewer cytospins, as these provided relatively little additional information in our study, and in other studies largely provided information limited to eosinophil counts. This would save cells for RNA extraction.
In our study, we evaluated the responsivity only from moderate COPD exacerbations to stable state but did not include subjects with severe exacerbations. Future studies should consider evaluating the responsivity between severe COPD exacerbations and stable phase as well as before and after medical interventions. In addition, it will be insightful to stratify for smoking status, number of exacerbations in the last 12 months as well as the cause of COPD exacerbations; our pilot study was underpowered to analyse these subgroups separately. It is currently not well known whether the heterogeneity of COPD exacerbations (ie, bacterial/viral/eosinophilic) affects the responsivity or reproducibility of the inflammatory outcomes.
Furthermore, we evaluated the reproducibility of cytokine mRNA and protein measurements with a median interval of seven days. Although all included subjects were clinically stable at both visits, it could be speculated that airway inflammatory patterns still changed during this interval. Future studies should consider evaluating the reproducibility of cytokine mRNA and protein measurements with a shorter interval, perhaps even on the same day.
In summary, several protein levels yielded better noise to signal ratios (better responsivity) compared to their respective mRNA levels, not sustaining the hypothesis that mRNA normalization would overcome variable dilution of samples during the sputum induction procedure. The signals in IL-6 and CCL4 protein levels were the highest. Conversely, cytokine mRNA expression varied less in a stable state than proteins, indicating that measuring cytokine activity at gene expression level might improve reproducibility in sputum inductions compared to proteins. Future studies are needed with a larger sample size to further evaluate the differences of responsivity and reproducibility between cytokine mRNA and protein measurements.
Data Sharing Statement
Data sets used and/or analyzed during the current study are available from the corresponding author ([email protected]) on reasonable request.
Author Contributions
All authors made a significant contribution to the work reported, whether that is in the conception, study design, execution, acquisition of data, analysis and interpretation, or in all these areas. All authors took part in drafting, revising or critically reviewing the article; gave final approval of the version to be published; have agreed on the journal to which the article has been submitted; and agree to be accountable for all aspects of the work.
Funding
The submitted work is cofinanced by the Ministry of Economic Affairs and Climate Policy by means of the PPP.
Disclosure
RG reports grants from Boehringer Ingelheim, Chiesi, Sanofi-Aventis, and Aquilo, outside the submitted work. HK reports research grants from GSK, Novartis, and Boehringer, and fees for consultancies in advisory boards from GSK, Novartis, and Boehringer, all paid to his institution. MvdB reports grants from Astra Zeneca, Novartis, Genetech, Roche, Sanofi, outside the submitted work. LK is an employee of Aquilo BV. BD and JMV have nothing to disclose. The authors report no other conflicts of interest in this work.
References
1. Hogg JC, Timens W. The pathology of chronic obstructive pulmonary disease. Annu Rev Pathol. 2009;4(1):435–459. doi:10.1146/annurev.pathol.4.110807.092145
2. GOLD. Global Strategy for the Diagnosis, Management and Prevention of COPD, Global Initiative for Chronic Obstructive Lung Disease (GOLD); 2020.
3. Kistemaker LE, Oenema TA, Meurs H, Gosens R. Regulation of airway inflammation and remodeling by muscarinic receptors: perspectives on anticholinergic therapy in asthma and COPD. Life Sci. 2012;91(21–22):1126–1133. doi:10.1016/j.lfs.2012.02.021
4. Hogg JC, Chu F, Utokaparch S, et al. The nature of small-airway obstruction in chronic obstructive pulmonary disease. N Engl J Med. 2004;350(26):2645–2653. doi:10.1056/NEJMoa032158
5. O’Donnell RA, Richter A, Ward J, et al. Expression of ErbB receptors and mucins in the airways of long term current smokers. Thorax. 2004;59(12):1032–1040. doi:10.1136/thx.2004.028043
6. Rutgers SR, Timens W, Kaufmann HF, et al. Comparison of induced sputum with bronchial wash, bronchoalveolar lavage and bronchial biopsies in COPD. Eur Respir J. 2000;15(1):109–115. doi:10.1183/09031936.00.15110900
7. Singh D, Edwards L, Tal-Singer R, Rennard S. Sputum neutrophils as a biomarker in COPD: findings from the ECLIPSE study. Respir Res. 2010;11:77. doi:10.1186/1465-9921-11-77
8. Woolhouse IS, Bayley DL, Stockley RA. Effect of sputum processing with dithiothreitol on the detection of inflammatory mediators in chronic bronchitis and bronchiectasis. Thorax. 2002;57(8):667–671. doi:10.1136/thorax.57.8.667
9. Goldmann T, Pedersen F, Seehase S, et al. The effect of dithiothreitol on the transcriptome of induced sputum cells. Respiration. 2013;86(3):262–263. doi:10.1159/000348392
10. Brightling CE, Monteiro W, Ward R, et al. Sputum eosinophilia and short-term response to prednisolone in chronic obstructive pulmonary disease: a randomised controlled trial. Lancet. 2000;356(9240):1480–1485. doi:10.1016/S0140-6736(00)02872-5
11. Powrie DJ, Wilkinson TM, Donaldson GC, et al. Effect of tiotropium on sputum and serum inflammatory markers and exacerbations in COPD. Eur Respir J. 2007;30(3):472–478. doi:10.1183/09031936.00023907
12. Perng DW, Tao CW, Su KC, et al. Anti-inflammatory effects of salmeterol/fluticasone, tiotropium/fluticasone or tiotropium in COPD. Eur Respir J. 2009;33(4):778–784. doi:10.1183/09031936.00115308
13. Bathoorn E, Liesker J, Postma D, et al. Safety of sputum induction during exacerbations of COPD. Chest. 2007;131(2):432–438. doi:10.1378/chest.06-2216
14. Bhowmik A, Seemungal TAR, Sapsford RJ, et al. Relation of sputum inflammatory markers to symptoms and lung function changes in COPD exacerbations. Thorax. 2000;55(2):114–120. doi:10.1136/thorax.55.2.114
15. Bafadhel M, McKenna S, Terry S, et al. Acute exacerbations of chronic obstructive pulmonary disease: identification of biologic clusters and their biomarkers. Am J Respir Crit Care Med. 2011;184(6):662–671. doi:10.1164/rccm.201104-0597OC
16. Barnes PJ. The cytokine network in chronic obstructive pulmonary disease. Am J Respir Cell Mol Biol. 2009;41(6):631–638. doi:10.1165/rcmb.2009-0220TR
17. Koo TK, Li MY. A guideline of selecting and reporting intraclass correlation coefficients for reliability research. J Chiropr Med. 2016;15(2):155–163. doi:10.1016/j.jcm.2016.02.012
18. Gershman NH, Liu H, Wong HH, et al. Fractional analysis of sequential induced sputum samples during sputum induction: evidence that different lung compartments are sampled at different time points. J Allergy Clin Immunol. 1999;104(2 I):322–328. doi:10.1016/S0091-6749(99)70374-X
19. Frøssing L, Kjærsgaard Klein D, Backer V, et al. The six-gene expression signature in whole sampled sputum provides clinically feasible inflammatory phenotyping of asthma. ERJ Open Res. 2020;6(1):00280–02019. doi:10.1183/23120541.00280-2019
20. Panzer SE, Dodge AM, Kelly EA, et al. Circadian variation of sputum inflammatory cells in mild asthma. J Allergy Clin Immunol. 2003;111(2):308–312. doi:10.1067/mai.2003.65
21. Menten P, Wuyts A, Van Damme J. Macrophage inflammatory protein-1. Cytokine Growth Factor Rev. 2002;13(6):455–481.
 © 2021 The Author(s). This work is published and licensed by Dove Medical Press Limited. The
full terms of this license are available at https://www.dovepress.com/terms
and incorporate the Creative Commons Attribution
- Non Commercial (unported, 3.0) License.
By accessing the work you hereby accept the Terms. Non-commercial uses of the work are permitted
without any further permission from Dove Medical Press Limited, provided the work is properly
attributed. For permission for commercial use of this work, please see paragraphs 4.2 and 5 of our Terms.
© 2021 The Author(s). This work is published and licensed by Dove Medical Press Limited. The
full terms of this license are available at https://www.dovepress.com/terms
and incorporate the Creative Commons Attribution
- Non Commercial (unported, 3.0) License.
By accessing the work you hereby accept the Terms. Non-commercial uses of the work are permitted
without any further permission from Dove Medical Press Limited, provided the work is properly
attributed. For permission for commercial use of this work, please see paragraphs 4.2 and 5 of our Terms.