Back to Journals » International Journal of Nanomedicine » Volume 10 » Issue 1
Response of human mesenchymal stem cells to intrafibrillar nanohydroxyapatite content and extrafibrillar nanohydroxyapatite in biomimetic chitosan/silk fibroin/nanohydroxyapatite nanofibrous membrane scaffolds
Authors Lai G, Shalumon K, Chen J ![]()
Received 4 September 2014
Accepted for publication 16 October 2014
Published 12 January 2015 Volume 2015:10(1) Pages 567—584
DOI https://doi.org/10.2147/IJN.S73780
Checked for plagiarism Yes
Review by Single anonymous peer review
Peer reviewer comments 3
Editor who approved publication: Dr Thomas Webster
Guo-Jyun Lai,1,* KT Shalumon,1,* Jyh-Ping Chen1,2
1Department of Chemical and Materials Engineering, 2Research Center for Industry of Human Ecology, Chang Gung University of Science and Technology, Taoyuan, Taiwan, Republic of China
*These authors contributed equally to this work
Abstract: Incorporation of nanohydroxyapatite (nHAP) within a chitosan (CS)/silk fibroin (SF) nanofibrous membrane scaffold (NMS) may provide a favorable microenvironment that more closely mimics the natural bone tissue physiology and facilitates enhanced osteogensis of the implanted cell population. In this study, we prepared pristine CS/SF NMS, composite CS/SF/nHAP NMS containing intrafibrillar nHAP by in situ blending of 10% or 30% nHAP before the electrospinning step, and composite CS/SF/nHAP NMS containing extrafibrillar nHAP by depositing 30% nHAP through alternative soaking surface mineralization. We investigated the effect of the incorporation of HAP nanoparticles on the physicochemical properties of pristine and composite NMS. We confirmed the presence of ~30 nm nHAP in the composite nanofibrous membranes by thermogravimetry analysis (TGA), X-ray diffraction (XRD), and scanning electron microscopy (SEM), either embedded in or exposed on the nanofiber. Nonetheless, the alternative soaking surface mineralization method drastically influenced the mechanical properties of the NMS with 88% and 94% drop in Young’s modulus and ultimate maximum stress. Using in vitro cell culture experiments, we investigated the effects of nHAP content and location on proliferation and osteogenic differentiation of human bone marrow mesenchymal stem cells (hMSCs). The proliferation of hMSCs showed no significant difference among pristine and composite NMS. However, the extent of osteogenic differentiation of hMSCs was found to be positively correlated with the content of nHAP in the NMS, while its location within the nanofiber played a less significant role. In vivo experiments were carried out with hMSCs seeded in CS/SF/30%nHAP NMS prepared by in situ blending and subcutaneous implantation in nude mice. Micro-computed tomography images as well as histological and immunohistochemical analysis of the retrieved hMSCs/NMS construct 1 and 2 months postimplantation indicated that NMS had the potential for bone regeneration and can be suggested as a promising scaffold for bone tissue engineering.
Keywords: chitosan, silk fibroin, hydroxyapatite, electrospinning, nanofibers, human bone marrow stem cells, bone tissue engineering
Introduction
Bone grafting and reconstruction have gone through significant progress, from surgical reconstruction to regeneration of lost tissue. Previously, autografts and allografts were used extensively for bone grafts, and most of them were harvested from the patient’s own body or from a cadaver. Due to donor morbidity and immunogenic reactions, both methods had their own restrictions for extensive use. Such limitations created substantial interest in the requirement of bone grafts made up of artificial materials.1 One of the potential and newly emerging biomedical technologies that aids the repair and regeneration of deficient tissues is “tissue engineering”. It is a combinatorial approach of materials science, cell biology, engineering technology, and transplantation to treat or replace damaged tissues. In spite of advances in technology, the complete regeneration and development of complex tissues or organs, such as heart, muscle, kidney, liver, and lung, is still a distant milestone in the twenty-first century. Several aspects like cell sources, vascularization, biomaterials, design of drug delivery systems, etc, are to be considered and resolved to overcome the challenges in tissue engineering. Biomaterials made of synthetic and/or natural polymers in three-dimensional forms can provide different mechanical/degradation properties based on the nature of the material and the methodology of preparation. Systematic improvements of mechanically optimal polymeric scaffold architecture by impregnating conductive/inductive factors with controlled releasing/degradation potentials could provide a suitable environment for extracellular matrix (ECM) production.2 One of the most widely investigated tissue engineering scenarios is bone regeneration using composite polymeric materials. The scaffold’s architecture should allow the differentiation of preosteoblasts to osteogenic phenotypes through appropriate cell–material interactions.3
A variety of methods are available for the fabrication of scaffold architecture into the required size and shape.4 Salt leaching, freeze drying, gas foaming, and electrospinning are some of the techniques in this regard to fabricate ideal scaffolds.5–7 Among them, nanofibers produced by electrospinning stood first, due to its unique properties in simulating collagenous environment in the ECM. However, the ECM of bone tissue is a combination of organic–inorganic phases made of collagen I and III, glycosaminoglycans (GAGs) and calcium phosphate in the form of hydroxyapatite (HAP). Therefore, an ideal scaffold for bone tissue engineering should be a combination of polymeric–ceramic counterparts with compatible mechanical strength and osteoconductive/inductive factors.8
A combined approach of biodegradable/biocompatible polymeric materials with chitosan (CS) and silk fibroin (SF) is considered to be effective in functioning as an excellent scaffold matrix.9 CS is an osteocompatible and osteoconductive cationic polysaccharide, which is produced by partial deacetylation of chitin and with a molecular structure similar to GAGs. Because of its origin from a natural source, CS has excellent biocompatibility and degradability. Moreover, the degradation products of CS are nontoxic and bioresorbable in nature. It is reported to be a useful material for migration and differentiation of bone marrow mesenchymal stem cells.10 Though it is good for differentiation, poor processability and inferior mechanical properties hinder the applicability of CS alone in tissue engineering. To solve this problem, CS can be combined with other polymeric biomaterials such as alginate, gelatin, hyaluronic acid, and SF to develop better scaffolds for tissue engineering by retaining its osteogenic activities, but with improved mechanical properties.11–14
Blending of CS with other natural biocompatible materials like SF is expected to provide enhanced tissue repair and regeneration.9 This natural fibrous protein is used as biomaterial for various potential biomedical applications, including bone tissue engineering.15 It has excellent biocompatibility, biodegradability, and mechanical strength and can hence be modified into films, gels, sponges, and nanofibers.16 Unlike CS, SF scaffolds are more responsive in cell proliferation than differentiation.9 The oxygen permeability of SF is high, but can still maintain minimal inflammatory reactions. SF is reported to be useful for various tissue engineering applications, including bone, liver, cartilage, and skin.16–18 SF nanofibers are viable substrates to culture chondrocytes, osteoblasts, and mesenchymal stem cells to enhance cell attachment and proliferation.19 Though nanofibrous scaffolds are favored by many investigations due to their high interconnectivity, collagenous environment, and resemblance to natural tissues, they are weak under mechanical loadings. Thus, in order to use fibrous scaffolds when subject to tensional/compressional stresses in bone tissue engineering application, enhancement in scaffold mechanical properties is highly desired.20–22 In order to increase the mechanical strength, fibrous scaffolds could be fabricated by depositing HAP on the surface or growing HAP within the interior of electrospun nanofibers.22,23 Though various studies for the incorporation of osteoconductive HAP nanoparticles (nanohydroxyapatite, nHAP) in polymer fibers were reported,24,25 there have been a relatively limited number of investigations for CS or SF nanofibers containing HAP nanoparticles.26,27 A more extensive experimental scenario is essential to combine proliferation–differentiation factors with mechanical stability of the scaffold.
Based on the previous results observed in CS/SF NMS, we used a 1:1 combination of CS and SF to simulate a clinically relevant scaffold matrix.28 Osteoconductive nHAP was incorporated into the polymer matrix through in situ blending or soaking mineralization method. Through in vitro and in vivo studies, we want to evaluate the response of human bone marrow-derived mesenchymal stem cells (hMSCs) to CS/SF nanofibers augmented with intrafibrillar or extrafibrillar nHAP, and thereby ascertain the clinical potential of the CS/SF/nHAP nanofibrous membrane scaffold (NMS).
Material and methods
Materials
Chitosan with a degree of deacetylation of 98% and a molecular weight of 1×10⁵ Da was procured from Fluka Sigma-Aldrich, Seelze, Germany. Bombyx mori silk was supplied by a farm in Miaoli County, Taiwan. Dichloromethane (DCM) and trifluoroacetic acid (TFA) were purchased from Alfa Aesar (Ward Hill, MA, USA) and J.T. Baker® (Avantor Performance Materials, Center Valley, PA, USA) respectively. Ethanol, calcium chloride (CaCl2) and NaHCO3 were available from Echo (Taipei, Taiwan), Sigma Aldrich (St Louis, MO, USA) and (Saitama, Japan), respectively. Membrane Filtration Products Inc., (Seguin, TX, USA) provided CelluSep H1 dialysis membrane tubes. Except Bombyx mori silk, all the chemicals were used as received. Fetal bovine serum (FBS) and Dulbecco’s Modified Eagle’s Medium (DMEM) were purchased from Invitrogen (Life Technologies, Carlsbad, CA, USA).
Synthesis and characterization of nHAP nanoparticles
A chemical precipitation method using Ca2HPO4·2H2O and CaCO3 was used to prepare nHAP particles.29 The morphology and size of nHAP was analyzed using a transmission electron microscope (TEM) operated at 100 kV (JEOL JEM 2000EXII, JEOL, Tokyo, Japan). X-ray diffraction (XRD) diffractometer (Simens D5005) was used to examine the crystallographic phases of nHAP, with a monochromatic CuK radiation (wavelength =1.54056 Å). The diffraction patterns were collected at angles 20°–60°. The Fourier transform infrared spectroscopy (FTIR) spectrum of nHAP was recorded using a Horiba FT-730 spectrometer (Horiba, Ltd., Kyoto, Japan) at a range of 400–4,000 cm−1.
Preparation of CS/SF and CS/SF/nHAP NMS
A stepwise purification method of Bombyx mori silk produced SF. Briefly, 0.5% (w/w) NaHCO3 solution was used to treat Bombyx mori silk twice, followed by sericin removal (degumming) with distilled water at 70°C for 30 minutes. Degummed silk was dissolved in CaCl2/CH3CH2OH/H2O solvent mixture (molar ratio of 1:2:8) at 70°C for 6 hours to obtain a SF solution. A cellulose dialysis membrane tube (MWCO =50,000) was used for the removal of impurities from the SF solution followed by overnight lyophilization to get regenerated SF. In order to fabricate CS/SF NMS, a 10% (w/w) CS/SF solution was prepared by dissolving CS and SF in a 1:1 ratio in TFA/DCM mixture (7:3, w/w). To prepare in situ blended CS/SF/10%nHAP and CS/SF/30%nHAP NMS, nHAP was added to the CS/SF solution, prepared above, to reach a final concentration of 10% and 30% (w/w), respectively. A high voltage power supply (Glassman, High Bridge, NJ, USA), and a syringe pump (KD Scientific Co., Holliston, MA, USA) fit with a 5 mL syringe and a 22 gauge needle was used to produce the electrospun nanofibers. A voltage of 18 kV, flow rate of 0.5 mL/h and a needle tip target distance of 12 cm was used to deposit the NMS on a static aluminum foil collector. Both pristine and composite NMSs were immersed in a 7% (v/v) ammonia/75% (v/v) ethanol aqueous solution for 30 minutes to remove the residual TFA and reduce the water solubility of SF. The soaking mineralization of CS/SF NMS was prepared by the alternate soaking method.30 The CS/SF NMS was first immersed in 0.5 M CaCl2 solution for 10 minutes followed by rinsing with distilled deionized (DDI) water. The immersion was continued with 0.3 M of Na2HPO4 solution for 10 minutes to constitute one cycle of Ca-P treatment. The NMS was allowed to undergo various cycles of alternate soaking to confirm different amounts of nHAP deposition on the nanofiber surface. The NMS prepared with 5 cycles of alternate soaking was chosen in the study since it had comparable nHAP content with CS/SF/30%nHAP and is indicated as CS/SF (Ca-P).
Characterization of CS/SF and CS/SF/nHAP NMS
The morphology of a nanofibrous membrane (NFM) was observed with a scanning electron microscope (SEM; Hitachi S3000N). The average fiber diameter was calculated by measuring at least 100 random fibers from 10 images using ImageJ software. FTIR spectra were obtained using a Horiba 730 FTIR spectrometer (HORIBA Ltd.) over a wavenumber range of 400–2,000 cm−1 and a resolution of 2 cm−1. XRD patterns were recorded on a Siemens D5005 X-ray diffractometer (Siemens, Munich, Germany) having a CuK source, a quartz monochromater, and a geniometric plate. The performed scanning speed was 2°/min from 5° to 60°. X-ray photoelectron spectroscopy (XPS; Physical Electronics PHI 1600 ESCA system) was used to determine the chemical compositions and chemical states of the nanofibers in a depth range of 5 nm. In the XPS experiment, a monochromatic Al Ka (1,486.6 eV) X-ray source was used with a magnesium anode at 15 kV and 400 W. A region of 0.4×0.4 mm2 on each sample surface was analyzed with a hemispherical analyzer using pass energies of 187.85 eV for survey spectra. Thermogravimetry analysis (TGA) was conducted with TGA 2050 (TA Instruments, New Castle, DE, USA) at a controlled heating rate of 10°C/min from 25°C to 600°C. Tensile properties of NMS were tested at a deforming rate of 5 mm/min using a tabletop mechanical testing machine (Tinius Olsen H1KT, Tinius Olsen, Surrey, UK) equipped with a 10 N loading cell. Strip shaped NMSs (10×50 mm2) were allowed to undergo tensile elongation at a crosshead speed of 5 mm/min. The Young’s modulus (slope within the initial elastic region), the ultimate tensile strength (maximum stress at break), and the elongation-at-break (maximum tensile strain at break) were calculated from the tensile stress–strain curves.
In vitro cell culture
In vitro cell culture experiments were performed using hMSCs (Cellular Engineering Technologies Inc., Coralville, IA, USA, HMSC.BM-500). Cells at a concentration 5×10⁵ were resuspended in a T75 culture flask containing 10 mL DMEM, 10% FBS, and 1% penicillin–streptomycin. Culture flasks were maintained at 37°C and in a 5% CO2 atmosphere with a change of fresh medium every 2 days till the cell density reached 80%–90% confluence. After 5 days, the medium was removed and cells were washed with 10 mL of phosphate buffer saline (PBS) three times to remove residual impurities from the medium. Adherent cells were detached from the flask by treatment with 0.05% trypsin–EDTA solution and transferred to a centrifuge tube. Centrifugation at 1,500 rpm for 5 minutes resulted in the formation of a cell pellet at the bottom of the tube. The supernatant was removed and the cell pellet was mixed with 1 mL of fresh cell culture medium to form a homogeneous cell suspension, followed by resuspension in three or four T75 flasks and the process was repeated. Cells at passage numbers 2–3 were used for in vitro studies. NMSs were cut into disk shapes with 1.5 cm diameter, sterilized with 75% ethanol overnight, and rinsed three times with PBS before placing in 24-well culture plates (Nunc, Thermo Fisher Scientific). An aliquot of 0.1 mL hMSC cell suspension (1×10⁵ cells/mL) was seeded onto the surface of the prewetted membrane in each well and incubated at 37°C for 4 hours to allow cell adhesion. The membrane was transferred to a new well with the addition of 1 mL cell culture medium (DMEM, 10% FBS, 50 μM l-ascorbic acid phosphate, 0.1 μM dexamethasone, 10 mM glycerol 2-phosphate, and 1% antibiotic-antimycotic) into each well. Cell culture was carried out at 37°C in a humidified 5% CO2 incubator with medium change every 3 days.
Cell proliferation
The 3-(4,5-dimethylthiazol-2-yl)-5-(3-carboxymethoxyphenyl)-2-(4-sulfophenyl)-2H-tetrazolium (MTS) assay using the CellTiter 96 AQueous One solution was used to measure the cell proliferation of hMSCs on pristine and composite CS/SF NMS. Prior to each measurement, the samples were washed with PBS followed by incubation for 3 hours at 37°C in a mixture of 200 μL medium and 40 μL MTS reagent. A colored formazan product is formed as a result of reduction of living cells by MTS reagent. The optical density (OD) of the solution was measured at 492 nm (OD492) using an ELISA reader (Synergy HT, BioTek, Winooski, VT, USA).
Cell viability
Laser scanning confocal microscopy was used for the qualitative evaluation of viable cells, using the live/dead viability/cytotoxicity assay kit (Molecular Probes, Life Technologies, Thermo Fisher Scientific). The kit provides two molecular probes, calcein AM and ethidium homodimer-1 (EthD-1), to simultaneously determine the existence of live (green) and dead (red) cells. The hMSCs/NMS constructs were incubated in 2 μM calcein AM (excitation/emission, 494 nm/517 nm) and 4 μM EthD-1 (excitation/emission, 528 nm/617 nm) staining solution in the dark for 30 minutes and observed using a confocal laser scanning microscope (Zeiss LSM 510 Meta, Carl Zeiss Meditec AG, Jena, Germany).
Alkaline phosphatase (ALP) activity
An ALP kit (SensoLyte pNPP ALP assay kit, ANASPEC, Fremont, CA, USA) was used to measure the intracellular ALP activity of hMSCs. A cell lysis solution containing 500 μL of 0.1% Triton X-100 and 5 mM MgCl2 was used to lyse the cells and the lysate was centrifuged at 13,000 rpm for 10 minutes at 4°C. ALP activity was measured by mixing 50 μL p-nitrophenyl phosphate (5 mM) in 150 mM 2-amino-2-methyl-1-propanol buffer solution with 50 μL of the supernatant solution at room temperature for 30 minutes in the dark. The reaction was stopped by denaturing of ALP by the addition of 50 μL of 0.2 N NaOH and the OD of the colored product was measured with an ELISA reader at 405 nm (OD405). The ALP activity per cell basis was expressed by normalizing with the viable cell number from the MTS assay as the ratio of the ODs (OD405/OD492).
Mineralization of hMSC by SEM/EDS
The NMSs were washed with PBS, followed by glutaraldehyde (4%) fixation at room temperature for 2 hours. After fixation, a triplicate PBS washing was given to NMS for 20 minutes followed by postfixation in 1% osmium tetroxide (OsO4) (in 0.1 M phosphate buffer) at room temperature for 2 hours. NMSs were again washed in PBS and distilled water three times for 20 minutes. Dehydration of the NMS was done by alcohol gradient drying using increasing concentrations of ethanol (50%, 70%, 80%, 90%, 95%, and 100%). Final drying was done with critical point dryer. Completely dehydrated samples were sputter coated with gold, at 30 mA for 60 seconds, followed by visual monitoring in a SEM (Hitachi S-3000N SEM, Japan). Energy dispersive X-ray analysis (EDX) (HORIBA EX-250, Japan) for atomic percentage of elements in mineral deposits was further used to confirm the mineral deposition on hMSCs.
Mineralization by alizarin red staining and calcium quantification
The presence of mineralized nodules in hMSC cell culture was confirmed using alizarin red staining. Alizarin red S (ARS) reacts with calcium cation to form a chelate. Scaffolds were washed three times with PBS and fixed with 2.5% glutaraldehyde solution (in 0.1 M phosphate buffer) for 2 hours. ARS (0.5 g) was dissolved in 25 mL deionized water and the pH adjusted to 4.1–4.3 with 10% ammonium hydroxide. One milliliter of ARS solution was added to each well, followed by incubation for 1 hour at room temperature. DDI water was used to wash off the excess dye adsorbed on the scaffold surface. Presence of mineral deposition was qualitatively evaluated using the intensity of red color on the scaffold surface after taking photomicrographs using an inverted microscope (Olympus IX-71, Olympus Corporation, Tokyo, Japan). Calcium quantification was measured using cetylpyridinium chloride (CPC) treatment. ARS-stained scaffolds were washed with DDI water and followed by treatment with 1 mL of 10% CPC solution for 1 hour to desorb calcium ions. Absorbance of the solution was read at 540 nm in an ELISA reader (OD540) and normalized to the cell number from the MTS assay (OD540/OD492).
Quantitative evaluation of osteogenic gene expression
Standard procedures of RNA isolation and cDNA synthesis was performed prior to gene expression studies. After various culture periods in 24 well plates, NMS were immersed in TRIzol (Invitrogen) to isolate RNA. NMS were ruptured to produce cell suspension and the corresponding solution was transferred to a 1.5 mL microcentrifuge tube. To this, 200 μL of chloroform was added and vortexed for 15–30 seconds. After placing the tube in an ice bath for 5 minutes, centrifugation was done at 11,000 rpm for 15 minutes. Three layers were formed, with RNA in the supernatant layer, which was isolated and allowed to react with isopropanol at −80°C in 1:1 ratio for 30 minutes. The solution was further centrifuged at 11,000 rpm for 15 minutes at 4°C. After removal of the supernatant solution, 1 mL 75% ice cold ethanol was added at 4°C for 10 minutes, followed by centrifugation at 11,000 rpm for 10 minutes. After repeating the above process two more times, supernatant solution was removed and dried at room temperature. Diethylpyrocarbonate-treated water (Invitrogen; 30 μL) was used for the complete dissolution of RNA solution by treating at 55°C for 15 minutes. SuperScript III RNase H (Invitrogen) was used to reverse-transcript 1 μg of total RNA into cDNA. A SYBR Green RT-PCR kit (SYBR Green I supermix, Bio-Rad Laboratories Inc., Hercules, CA, USA) having Mini Option detection system (Bio-Rad CFD-3120) was used for the quantitative PCR (Q-PCR) measurement. Bio-Rad software was used with glyceraldehyde 3-phosphate dehydrogenase (GAPDH) control to analyze the results. The 2−ΔΔct relative quantification method was used for ALP, OPN, and OCN bone marker gene quantification. The selected primer sequence for the above mentioned marker genes and GAPDH control is shown in Table 1.
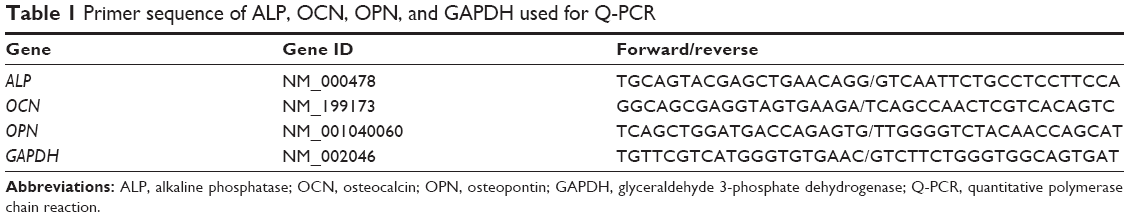 | Table 1 Primer sequence of ALP, OCN, OPN, and GAPDH used for Q-PCR |
Animal study
All animal procedures were conducted with the approval from the animal ethical committee of Chang Gung University. Female nude mice weighing 20–30 g (6–8 weeks) were used for the in vivo implantation. Prior to implantation, CS/SF/30%nHAP NMS were cultured with hMSCs (1×10⁵ cells/scaffold) for 14 days in cell culture medium. Acellular CS/SF/30%nHAP NMS was used as a control. Animals were anesthetized prior to surgery using 7 mg/kg xylazine (Rompun®, Bayer, Leverkusen, Germany) and 140 mg/kg ketamine (Ketalar®, Hoffman-La Roche Ltd., Basel, Switzerland). The back side of the animal was sterilized with 75% alcohol solution. The acellular scaffold and hMSC/scaffold were implanted on the subcutaneous pocket on each side of the back of the animal. Animals were sacrificed after 4 and 8 weeks using overdosed pentobarbital and implants were harvested for histological analysis. Samples examined by histology were immersed in 10% formaldehyde at room temperature and alcohol gradient was used to dehydrate the samples followed by paraffin embedding. Tissues were sectioned into 4 μm thick slices and deparaffined using Trilogy™ pretreatment solution (Cell Marque Co., Rocklin, CA, USA). After treatment with Tris-buffered saline containing 0.1% Tween 20 (TBST) for 5 minutes, sections were subject to hematoxylin and eosin (H&E) and Masson’s trichrome stains. The remaining sections used for immunohistochemistry (IHC) were treated with Ultra V Block (Thermo Scientific) for 5 minutes for blocking of nonspecific binding sites, and incubated in anti-collagen I antibody (ab90395) and anti-osteocalcin antibody (ab13418) from Abcam (Cambridge, MA, USA) for 120 minutes. TBST washing (5 minutes) and incubation in primary antibody amplifier was performed (10 minutes). Another TBST washing was performed prior to incubation in UltraVision ONE HRP Polymer (Thermo Scientific) solution for 15 minutes. A mixture of DAB quanto substrate and DAB quanto chromogen (Thermo Scientific) (at a ratio of 1:0.05) was used to develop the color by incubation for 15 minutes, followed by washing with distilled water for 3 minutes. Counterstaining with hematoxylin was performed by incubation for 5–10 minutes followed by washing and drying. The images were recorded under an inverted optical microscope (Olympus IX-71). Bone formation was analyzed by an animal microcomputed tomography (μ-CT; BioScan Inc., Washington, DC, USA) 4 and 8 weeks after implantation. The helical CT data were acquired using a high-resolution frame as a setup in the system, with tube voltage =55 KeV, pitch =1.0, and projection =180. The axial scanning range was set as 3 cm with the subcutaneous mass at the center field of view. Tissue mineral density was evaluated in Hounsfield unit (HU). The Osirix image software was used to calculate the HU value by outlining the region of interest that was confined to the implanted region in 2D cross-sectional view.
Statistical analysis
All quantitative data are presented as mean ± standard deviation. Significant differences in statistical analysis are determined using one-way ANOVA LSD test. A value of P less than 0.05 was considered statistically significant.
Results and discussion
Characterization of nHAP
A TEM measurement revealed that the prepared HAP nanoparticles had an average particle size below 50 nm (Figure 1A). Spectroscopic evaluation by FTIR confirmed characteristic stretching and bending vibrations related to HAP. The peak at 876 cm−1 is indicative of the carbonate ion substitution whereas the phosphate stretching vibrations were observed at 566, 604, and 1,054 cm−1 (Figure 1B). The stretch bands at 1,470 and 1,417 cm−1 confirms the presence of hydroxyl group. The broad bands observed at 1,650 and 3,440 cm−1 indicate adsorbed water in the materials. Crystallinity of nHAP was confirmed by the presence of prominent peaks at 2θ values 25.7° (002 plane) and 32.2° (211 plane), along with other peaks at 33.0° (112 plane), 34.3° (300 plane), 40.3° (310 plane), 46.6° (222 plane) and 49.6° (213 plane), which confirmed the formation of the apatite crystalline structure from the reflection peaks in comparison with JCPDC 090432 (Figure 1C).31 The average crystal grain size calculated with the Scherrer equation using the diffraction peak at 2θ=25.7° was 34.3 nm, with the XRD line broadening and assuming spherical crystals.7
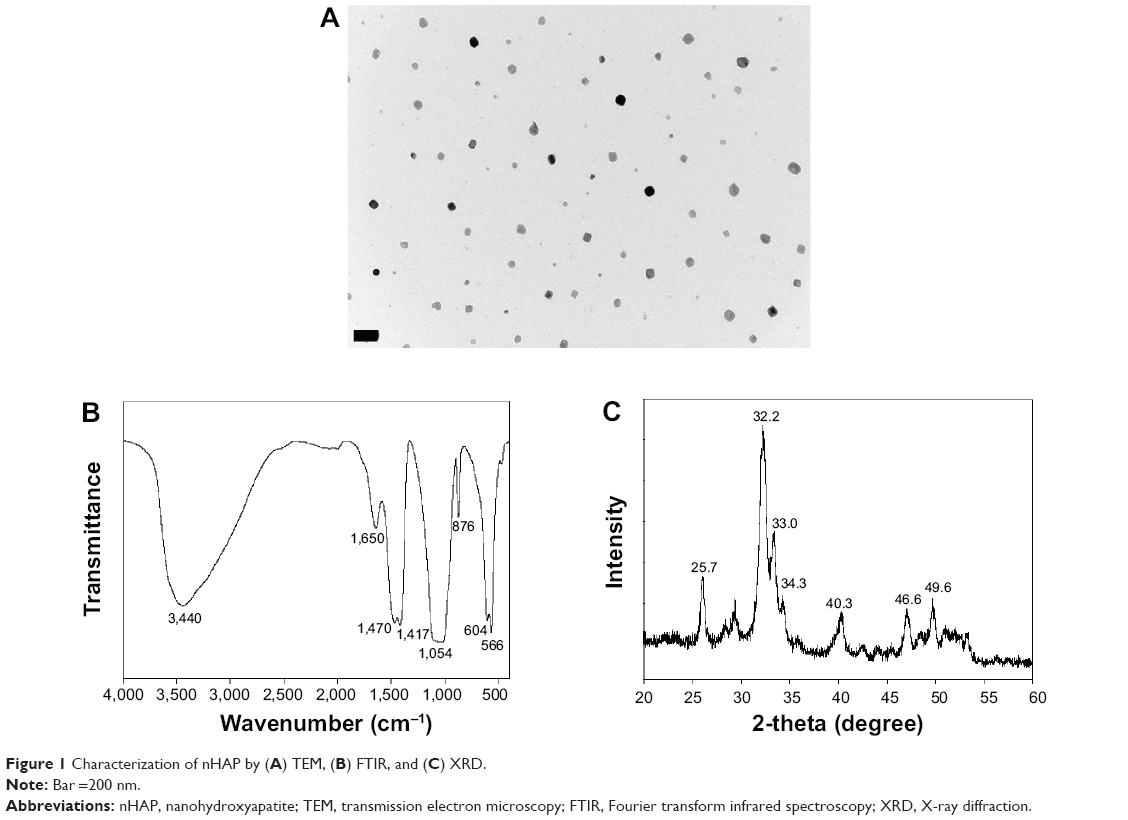 | Figure 1 Characterization of nHAP by (A) TEM, (B) FTIR, and (C) XRD. |
Characterization of CS/SF and CS/SF composite NMS
Pristine nanofibers of CS/SF were prepared from 10% CS/SF solution in 1:1 ratio, at the optimum electrospinning conditions as described.9 SEM images revealed the smooth and bead-free nature of nanofibers with an average fiber diameter of 447±168 nm (Figure 2A). Composite electrospun fibers were also produced using the same processing parameters as the pristine CS/SF NMS fabrication method, by blending 10% and 30%nHAP into the CS/SF solution. CS/SF/10%nHAP nanofibers had the same smooth and uniform morphology as CS/SF nanofibers with an average diameter of 354±103 nm (Figure 2B). At a higher concentration of nHAP incorporation (30%nHAP), unlike CS/SF and CS/SF/10%nHAP nanofibers, slightly different surface morphology with an average fiber diameter of 266±47 nm was obtained (Figure 2C). The existence of a few beads-on-string morphology is attributed to the higher loading percentage of nHAP in CS/SF solution.32 In comparison with in situ blending, the alternate soaking method produced irregular deposition of nHAP on the fiber surface (Figure 2D). Since the intensity of coating is directly proportional to the number of cycles of soaking, an optimum 5 soaking cycles that produced the same amount of nHAP deposition on the fiber surface as CS/SF/30% nHAP was used. The rationale behind the use of mixed solvent system of ammonia/ethanol was to remove residual TFA from NMS to avoid cellular toxicity and to achieve insolubility of SF in water by converting the α-helical protein structure to the β-sheet form.33,34 The deprotonation of the amino groups by treatment in alkaline medium will lead to the complete removal of TFA that form salts with protonated amino groups in CS and SF.
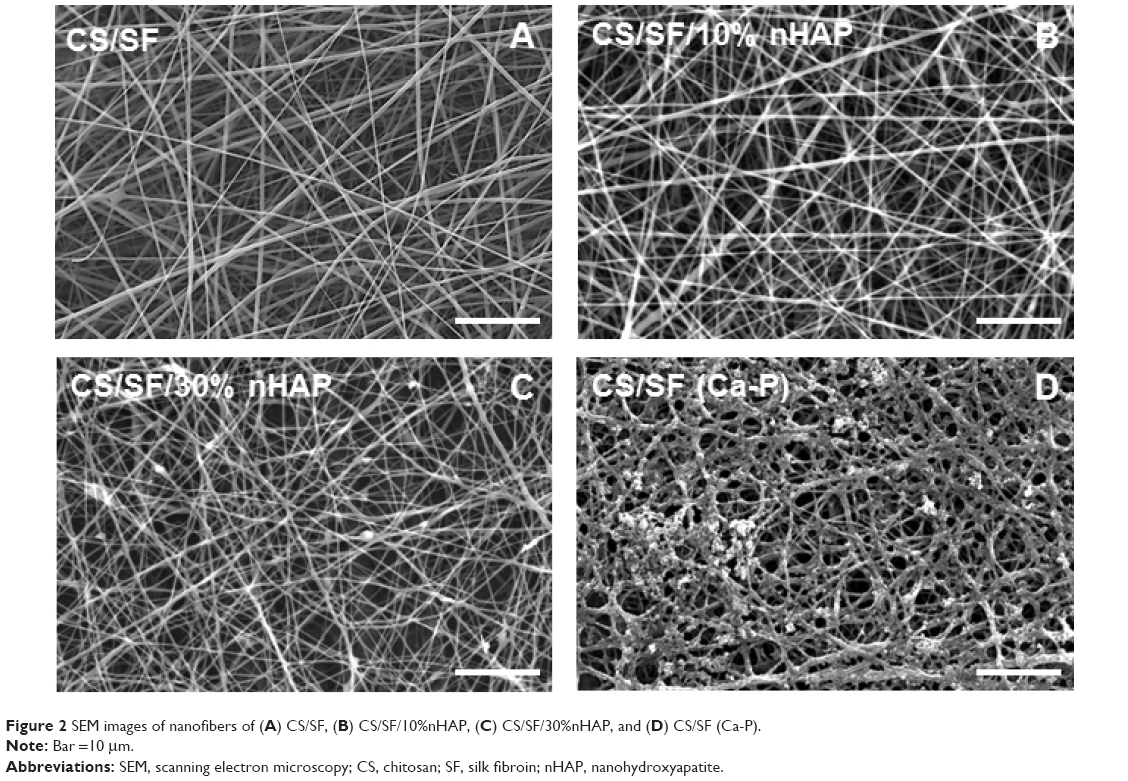 | Figure 2 SEM images of nanofibers of (A) CS/SF, (B) CS/SF/10%nHAP, (C) CS/SF/30%nHAP, and (D) CS/SF (Ca-P). |
FTIR was used to characterize the functional groups present in nHAP, CS/SF, CS/SF/10%nHAP, CS/SF/30%nHAP and CS/SF (Ca-P). The absence of characteristic transmittance peaks of TFA at 720, 796, and 836 cm−1 confirms the complete removal of TFA by ammonia treatment (Figure 3A). The characteristic transmittance peaks observed at 1,626 and 1,537 cm−1 could be attributed to merge of the C=O and NH2 stretching bands of CS around 1,637 and 1,548 cm−1 with SF bands.35 It also confirms that the β-sheet protein conformation of SF rather than the random coil confirmation that would show characteristic transmittance peaks at 1,650 (amide I) and 1,535 cm−1 (amide II).9,28 The FTIR of nHAP was the same as shown earlier in Figure 1B. The blended and soaked composite NMS exhibited both characteristic peaks corresponding to pristine CS/SF and nHAP. The peaks observed at 1,626 and 1,537 cm−1 denote amides I and II of CS/SF fibers whereas prominent phosphate stretching vibrations at 566 cm−1 and merged peaks at 604 and 1,054 cm−1 confirm the presence of nHAP in composite NMS.
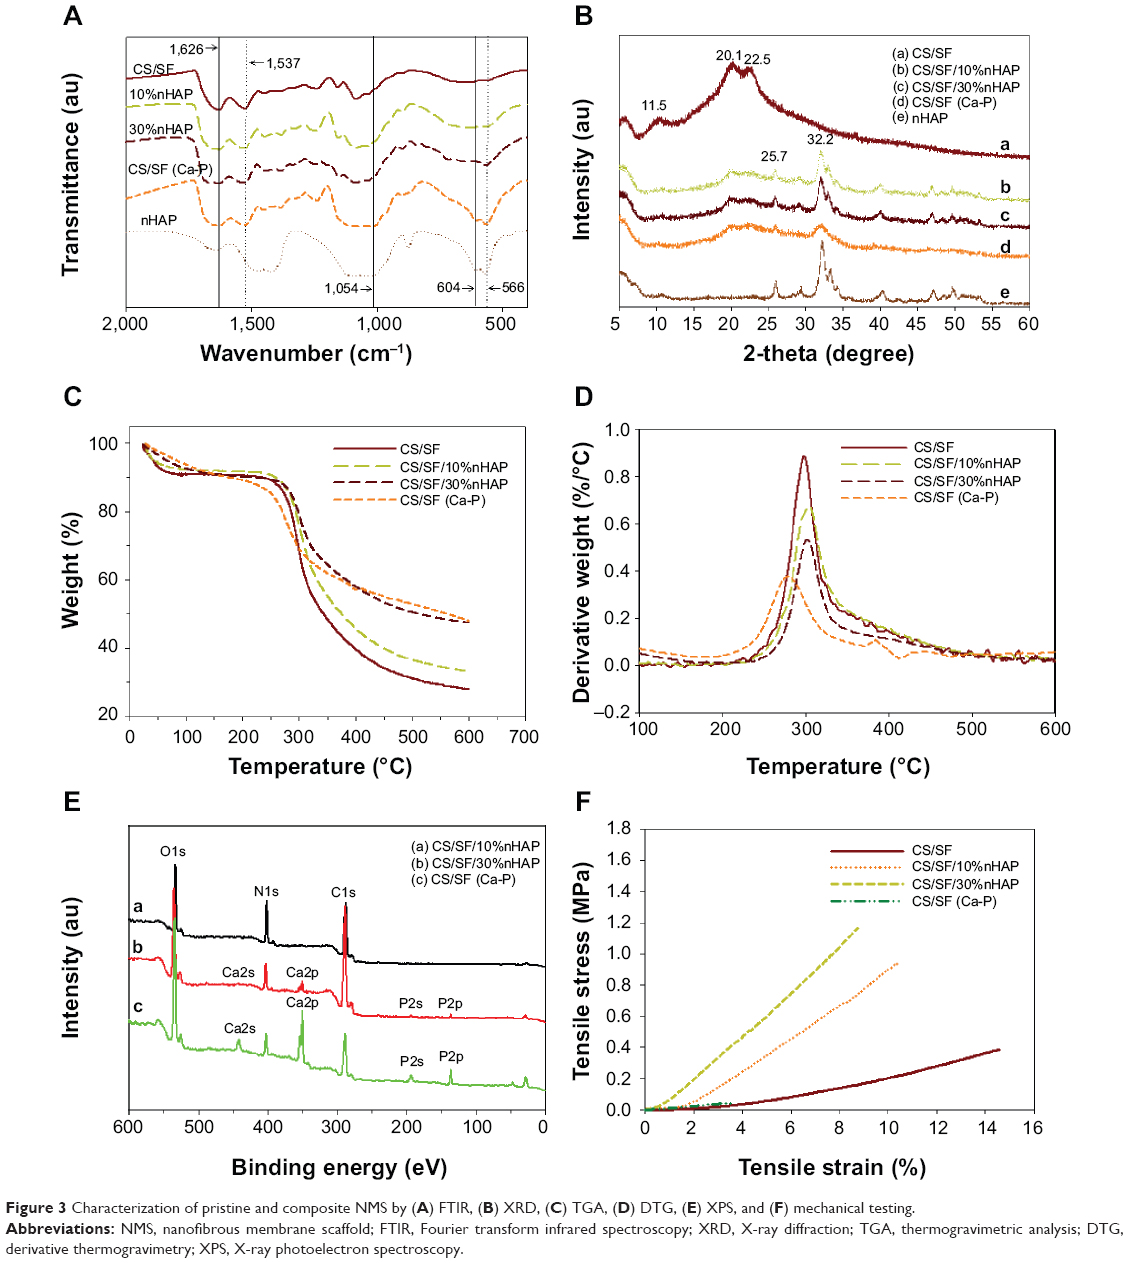 | Figure 3 Characterization of pristine and composite NMS by (A) FTIR, (B) XRD, (C) TGA, (D) DTG, (E) XPS, and (F) mechanical testing. |
The CS/SF NMS with and without various concentrations of blended and soaked nHAP were further characterized for the presence of possible crystalline peaks in both materials (Figure 3B). nHAP showed 2θ values at 25.7 and 32.2 corresponding to (002) and (211) planes. The CS/SF NMS showed merged diffraction peaks from both CS (11.5° and 20.1°) and methanol-treated SF (19.5° and 22.5° for β-sheet conformation).36 Composite CS/SF NMS with nHAP showed the respective typical crystalline peaks of both CS/SF and nHAP. It was also noted that peaks in surface mineralized NMS became slightly broader and weaker as compared with pure nHAP particles, implying low crystallinity and smaller crystal size. Using Scherrer equation, the crystal grain size of embedded nHAP was calculated to be 28.3 nm for CS/SF/10%nHAP and 30.1 nm for CS/SF/30%nHAP, while that of CS/SF (Ca-P) was 25.8 nm.
The thermal properties of pristine and composite CS/SF NMS were analyzed with TGA. As can be seen from Figure 3C, the onset of weight loss is ~250°C for CS/SF NFM and the weight loss reaches 73.5% at 600°C. A similar trend was observed for CS/SF/10%nHAP and CS/SF/30%nHAP but with less weight loss, as material weight percentage that remained after heating up to 600°C displays the effect of ceramic content in polymeric nanofibers. The contents of nHAP in NMS calculated from the residual weight at 600°C were lower than those calculated from the compositions of the polymer solutions used for electrospinning, which were 6.8% (for 10% nHAP) and 21.1% (for 30% nHAP), respectively. Phase separation of nHAP from the spinning solution may lead to a lower calculated nHAP ratio in the composite NMS than the theoretical value and this effect was more pronounced for the blended spinning solution containing a higher nHAP concentration. Nonetheless, the surface mineralized NMS still had similar nHAP content (21.7%) as CS/SF/30% nHAP calculated from the residual weight at 600°C, rendering comparison of cellular response to the location of nHAP in the nanofiber possible. Interestingly, CS/SF (Ca-P) NMS showed early stage decomposition starting around 236°C. The derivative thermogravimetry (DTG) from the first derivative of TGA curves also depicts the unstable nature of soaked CS/SF NMS in comparison to blended composite NMS and pristine NMS (Figure 3D). The peak temperatures for the highest weight loss rate decreased to ~280°C for CS/SF (Ca-P) from ~300°C for other NMS. This could be due to the lack of uniform deposition of nHAP on soaked NMS, compared to the uniformly embedded nHAP in blended NMS. This directly implies the importance of the mode of nHAP incorporation on the thermal stability of NMS.
The XPS analysis was used to identify the extent of exposure nHAP and the stoichiometric ratio of calcium to phosphate in blended and soaked CS/SF NMS. The analysis of the chemical content of CS/SF/10% nHAP, CS/SF/30%nHAP and CS/SF (Ca-P) NMSs by means of XPS is shown in Figure 3E. Hydroxyapatite is the major component of cortical bone with specific Ca to P ratio of 1.67.7 While incorporating nHAP into the CS/SF NMS, it is essential to maintain its Ca/P ratio to provide similar environment for the cells when enhancing osteoconductivity. The elemental compositions are shown in Table 2. There were only trace Ca and P elements detected on CS/SF/10%nHAP nanofiber surface, indicating nHAP was fully embedded within the nanofiber. For the CS/SF/30%nHAP sample, the concentrations of Ca and P were about 1.32% and 0.87% while those of CS/SF (Ca-P) were about 9.62% and 6.33%. The difference is consistent with the blending versus soaking mechanism during the preparation of the composite NMS where more nHAP nanoparticles are expected to be coated on the surface of soaked CS/SF (Ca-P) than in situ blended CS/SF/30%nHAP NMS and is consistent with the SEM images shown in Figure 2. The Ca/P ratio of CS/SF/30%nHAP and CS/SF (Ca-P) NMS are both 1.52, which is close to the value of stoichiometric hydroxyapatite.
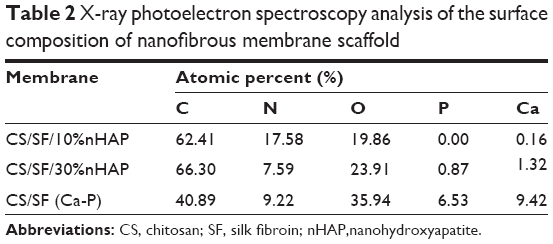 | Table 2 X-ray photoelectron spectroscopy analysis of the surface composition of nanofibrous membrane scaffold Abbreviations: CS, chitosan; SF, silk fibroin; nHAP,nanohydroxyapatite. |
Mechanical stability of the NMS was evaluated by tensile testing and representative stress–strain curves are shown in Figure 3F. All NMS show similar typical stress–strain curves with an initial elastic region and an ultimate failure. The mechanical properties of NMS could be compared from the parameters listed in Table 3. A significantly higher maximum stress was shown by blended composite NMS with 10% and 30% nHAP compared with that of pristine CS/SF NMS (2.9-fold increase). This implies the enhanced mechanical stability of nanocomposite fibers due to the homogenoeus incorporation of nHAP through blending electrospinning. It was cross-confirmed with the lowered maximum strain values of CS/SF/10%nHAP and CS/SF/30%nHAP NMSs. The Young’s modulus of blended composite NMS was the highest for CS/SF/30%nHAP. In conventional mixed HAP-polymer blend systems, HAP particulates have often been reported to be the source of failure, consequently reducing the mechanical strength of the system.25 For composite NMS, increase of Young’s modulus could be attributed to integration of nHAP with CS/SF by adopting the efficient nanocomposite structure of organic/inorganic natural systems (eg, bone), which reinforced the strength of the CS/SF/nHAP NMS. The higher elastic modulus and lower strain at failure in the presence of blended nHAP can be explained by the fact that nHAP renders CS/SF nanofiber more stiff and less plastic during deformation. In contrast, the maximum stress (strain) and the Young’s modulus shown by CS/SF (Ca-P) was significantly lower than pristine and blended composite NMS. Indeed, the alternative soaking surface mineralization method used to prepare CS/SF (Ca-P) NMS may drastically influence the mechanical properties of the NMS with 94% and 88% drop in ultimate maximum stress and Young’s modulus when compared with CS/SF/30%nHAP NMS that has similar amount of nHAP but was prepared by blending. This lowering of mechanical stability of soaked NMS may be due to the nonhomogeneous mineral deposition on CS/SF (Ca-P) NMS surface or the impairment of NMS mechanical properties during the repeated soaking process.
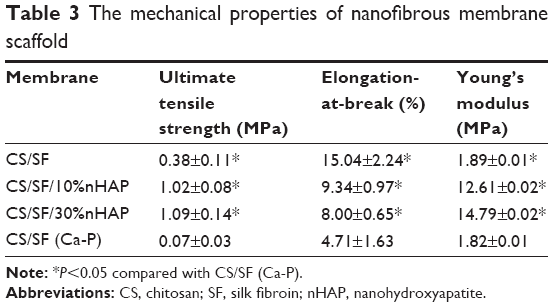 | Table 3 The mechanical properties of nanofibrous membrane scaffold |
Cell proliferation and viability
Cytotoxicity of NMS toward hMSCs was evaluated using the MTS assay (Figure 4A). The total number of viable cells after 4 hours of cell attachment (day 0) was taken as the reference point for comparing later periods of cell proliferation of hMSCs on pristine and composite NMSs. The cell attachments at day 0 among all the NMS were similar, irrespective of the components in the NMS. The number of viable cells increased at longer periods of culture but showed a decrease in cell proliferation rate after 7 days. This could be attributed to the initiation of differentiation cycle of hMSCs to osteoblasts by hindering the cell proliferation rate. The maximum cell number was attained at 14 days and the cells exhibited growth arrest thereafter. However, there was no significant difference in cell numbers between different NMSs at each time point. Our previous report also confirms the cyto-friendly nature of CS/SF NMS in terms of cell proliferation.9 The results are affirmative to conclude that the mode nHAP incorporation and the concentration of embedded nHAP did not alter the cell viability and proliferation. Evaluation of cellular viability was judged through morphology assessment through live–dead staining assay (Figure 4B). Even though there is no difference in cell viability among various CS/SF NMS, pristine CS/SF NMS exhibited relatively higher organization in cell spreading compared to composite NMS. Our previous study reports that CS/SF composition in 1:1 ratio would enhance both proliferation and differentiation simultaneously, due to the presence of CS and SF contents. CS aids faster differentiation while SF promotes proliferation.9 The CS/SF/10%nHAP blended composite NMS exhibited slight variations in cell morphology from a spindle shape to a cuboidal shape after 7 days. That the CS/SF/30%nHAP and CS/SF (Ca-P) show totally different cell morphology toward a cuboidal shape at the same time confirms the enhanced differentiation potential in the presence of 30%nHAP, irrespective of the NMS preparation method. A similar trend was also observed at day 21, with enhanced differentiated cell morphology for higher concentrations of nHAP. The results indicate that the major cell functions like spreading, proliferation, and differentiation directly depend on the substrate material properties. Therefore, pristine CS/SF NMS provides adequate environment for cell growth and production of ECM while composite CS/SF NMS facilitates enhanced differentiation over proliferation. Similar results on the effect of substrate properties in osteogenic differentiation of hMSCs have been reported earlier.37,38 Hence the results suggest that composite CS/SF NMS shows enhanced differentiation of hMSCs than do CS/SF pristine NMS.
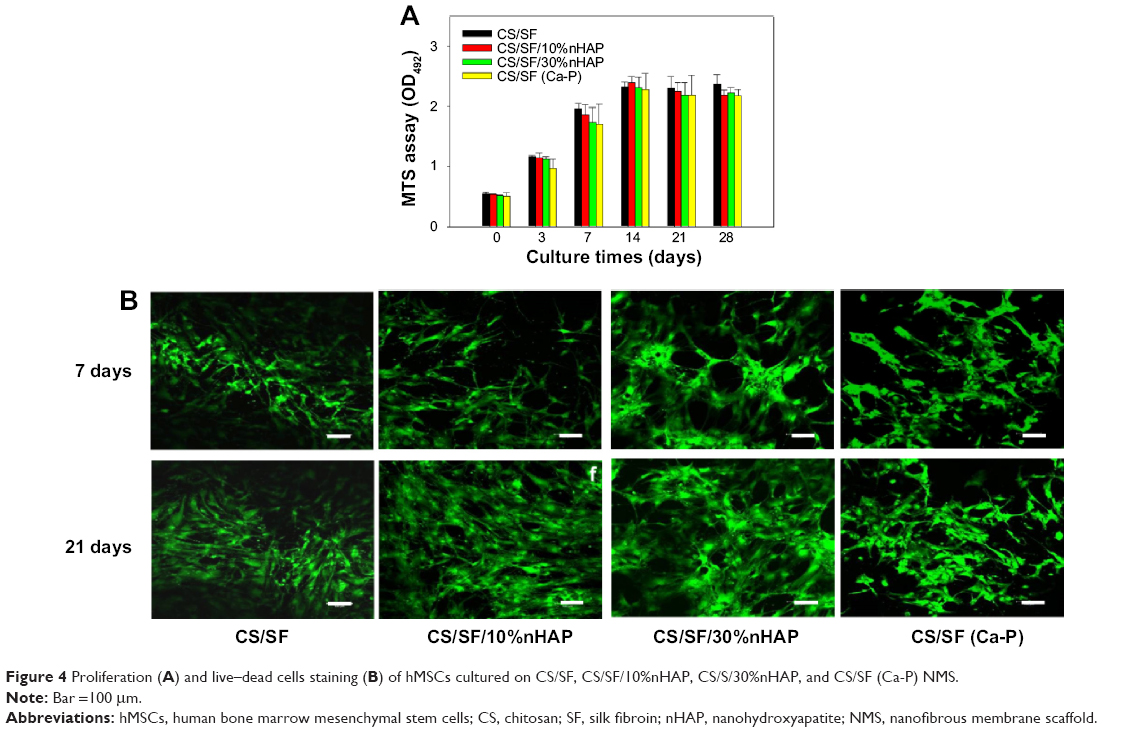 | Figure 4 Proliferation (A) and live–dead cells staining (B) of hMSCs cultured on CS/SF, CS/SF/10%nHAP, CS/S/30%nHAP, and CS/SF (Ca-P) NMS. |
ALP activity
ALP is one of the important factors in the initiation of mineralization process by cell differentiation. Nucleation initiates by accumulation of inorganic phosphates and Ca2+, resulting in calcification.39 ALP increases the phosphate concentration in local environment through the hydrolysis of phosphate esters and thus elevates the mineralization of ECM.38 As ALP enzyme promotes the differentiation of osteoblasts by the downstream cell differentiation factor, it is considered as an early interim osteoblast activity indicator. The normalized ALP activity of hMSCs cultured in CS/SF and CS/SF/nHAP (blended and soaked) NMS are shown in Figure 5A. The ALP activity plateaued at day 7–14 and showed a decrease in activity thereafter. At day 0, there was no significant difference in ALP activity among all NMSs but at day 3 and 7–14, both composite CS/SF and NMS with 30%nHAP showed significantly higher ALP concentration compared to CS/SF and CS/SF/10%nHAP NMS. This early differentiation characteristic of ALP could be correlated with the decrease in proliferation rate after 7 days of culture. Interestingly, there was no significant difference in ALP activity between CS/SF (Ca-P) and CS/SF 30%nHAP NMS. This result can also be explained in terms of MTS and live–dead cell assay. In both results, on or after 7 days the cells show signs of initiation or propagation of cell differentiation to osteogenic lineages, as observed in ALP expression.
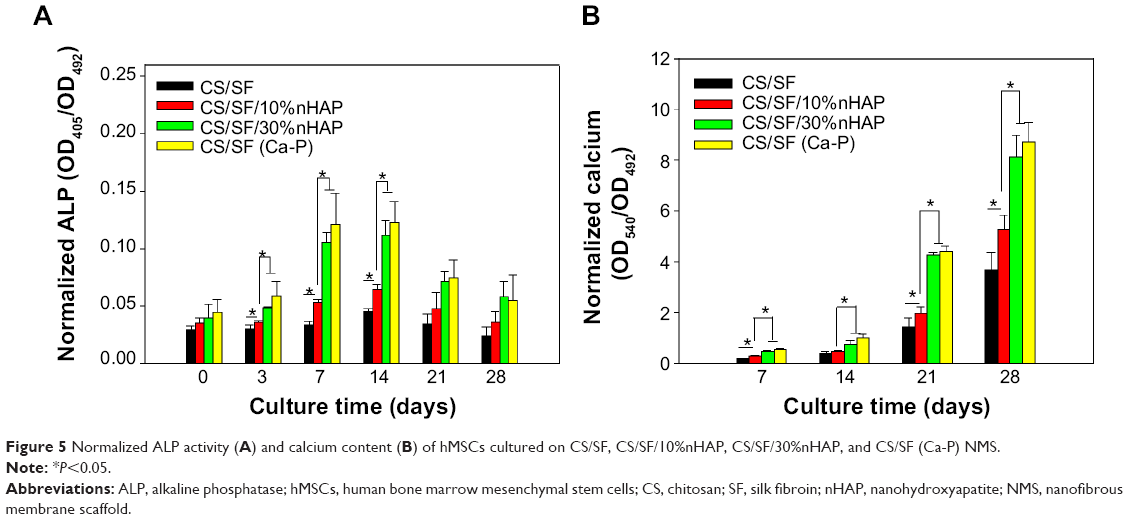 | Figure 5 Normalized ALP activity (A) and calcium content (B) of hMSCs cultured on CS/SF, CS/SF/10%nHAP, CS/SF/30%nHAP, and CS/SF (Ca-P) NMS. |
Mineralization of hMSC by SEM/EDS
Mineralization is the process of calcium phosphate deposition on substrate surfaces.40 Mineralization of hMSCs at the middle of the culture period is the evidence for its capability to secrete inorganic phosphates. This can be examined by observing the mineral deposition on the cell surface through microscopy or other quantitative assays. From SEM images in Figure 6A, it can be found that hMSCs seeded on NMS showed both material and time dependent mineralization. The extent of mineralization was less at day 7 than day 21. Also, mineralization was specific to the materials present in the NMS, irrespective of time. Enhanced mineral deposition was found on the composite NMS compared to pristine CS/SF NMS at both time points. This is due to the accelerated mineralization induced by the osteoconductive nHAP present in the composite NMS.
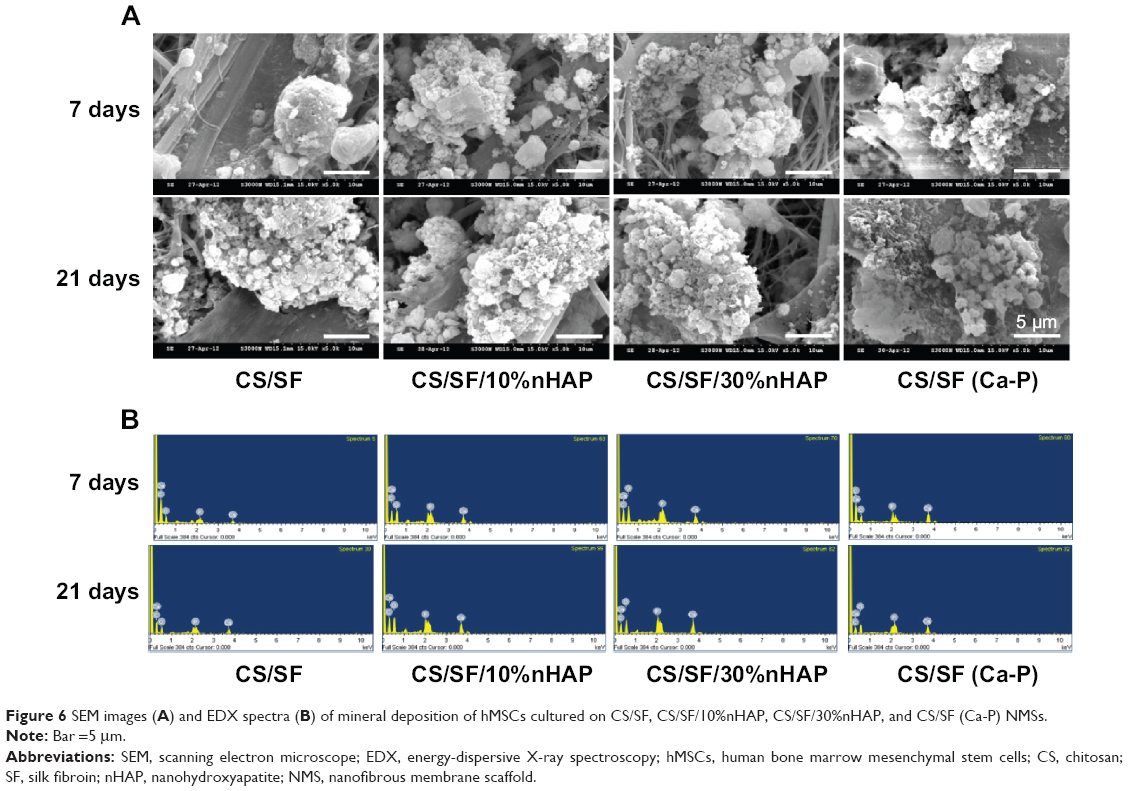 | Figure 6 SEM images (A) and EDX spectra (B) of mineral deposition of hMSCs cultured on CS/SF, CS/SF/10%nHAP, CS/SF/30%nHAP, and CS/SF (Ca-P) NMSs. |
A quantitative assessment of hMSCs osteodifferentiation from the extent of mineralization was carried out by EDX analysis of the mineralized ECM covering the cells. The EDX spectra are shown in Figure 6B and the atomic percentages of elements in minerals deposited by hMSCs at different culture times are shown in Table 4. The extent of mineralization increased from day 7 to day 21 and the contents of Ca and P in NMS with nHAP were consistently higher than those in pristine CS/SF NMS at both times. Furthermore, higher percentages of Ca and P were found for the NMS prepared with 30%nHAP than with 10%nHAP (3.4-fold). The EDX results also showed that only hMSCs seeded in CS/SF (Ca-P) NMS formed a mineralized tissue with a Ca/P ratio of 1.4–1.5. This mineral composition is similar to that of bone, whose mineral primarily consists of Ca and P with a Ca/P ratio from 1.4–1.7. The results of EDX analysis further demonstrate the potential application of composite NMS for bone tissue engineering.
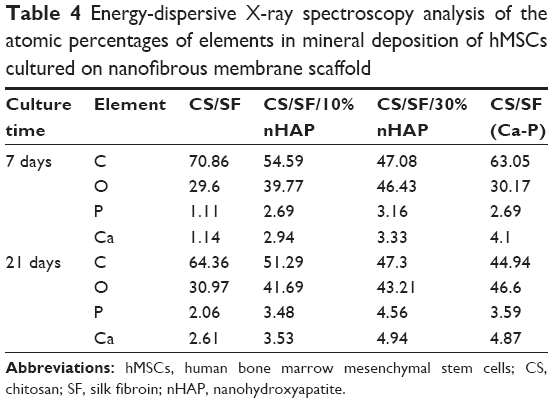 | Table 4 Energy-dispersive X-ray spectroscopy analysis of the atomic percentages of elements in mineral deposition of hMSCs cultured on nanofibrous membrane scaffold |
Alizarin red staining
A cross confirmation to the mineralization of hMSC was further examined through alizarin red stain where the binding of calcium ions in mineralized ECM forms an ARS-calcium complex in a chelation process. Figure 7 shows the optical microscopic images of ARS-stained pristine and composite NMS, confirming the variations in stain intensity for different NMS with time. At day 7, the alizarin red stain showed slight reddish dots on CS/SF NMS whereas the dot intensity was slightly higher in CS/SF/10%nHAP. Furthermore, the stain intensity was much higher on both blended and soaked CS/SF/30%nHAP NMS. In contrast, at day 21, all the NMS showed intense red staining with mild reduction on CS/SF and CS/SF/10%nHAP. This implies the time dependence of cell mineralization to produce more Ca2+ binding sites for ARS. Hence alizarin red staining provides a systematic qualitative tool to examine the hMSC differentiation in terms of time and substrate dependent properties. Apart from microscopic observations, quantitative evaluation of cell mineralization was done using CPC measurements where 10% CPC extracts ARS bound to Ca2+ on cell surface; thereby providing an estimate of the extent of calcium-based mineral deposits by hMSCs (Figure 5B). The normalized calcium content was found to increase with time from day 7 through 28. Although there was a trend of higher calcium content for CS/SF with high nHAP concentration, no significant difference was observed for NMS with 30%nHAP (both blended and soaked) throughout the culture period. This trend among different NFMs is consistent with the ALP activity observed in Figure 5A.
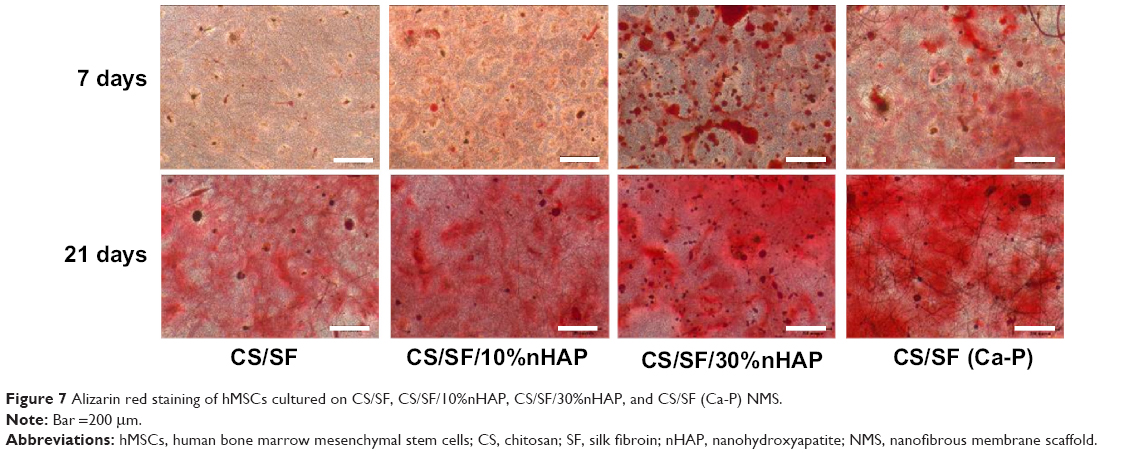 | Figure 7 Alizarin red staining of hMSCs cultured on CS/SF, CS/SF/10%nHAP, CS/SF/30%nHAP, and CS/SF (Ca-P) NMS. |
Gene expression studies by Q-PCR
During the growth and differentiation of hMSCs to osteoblast lineage, three major transformation stages exist. They are cell proliferation, maturation, and mineralization of ECM. All the stages are accompanied with upregulation of certain genes followed by downregulation of other genes.41 Figure 8 shows the mRNA expressions of specific osteogenic differentiation marker genes including ALP, osteopontin (OPN), and osteocalcin (OCN). ALP is an early differentiation marker gene observed at the initial stage of osteogenic differentiation whereas OPN and OCN are expressed at mid to later stages of cell differentiation. Being an early marker, ALP shows an increase in activity from day 3 to 14 and a down regulation thereafter till day 28. The downregulation of ALP at the later stages of differentiation reconfirms the early expression behavior of the same, as observed in ALP activity (Figure 5A). As expected, OPN exhibited a remarkable change in gene expression from day 14 to day 28. Being a late expression marker, OCN was upregulated from day 21. Substrate dependent analysis on gene expression confirms that nHAP concentration has a major role in deciding the functionality of the NMS and hence the up–down regulation of various genes. At day 14, ALP showed significantly higher upregulated expression for CS/SF/30%nHAP and CS/SF (Ca-P) compared to CS/SF and CS/SF/10% HAP (Figure 8A). However, the significant variations in the expression at early and later stages of cell cycles endorse ECM production at the beginning of cell differentiation. At the same time, the middle stage marker OPN demonstrated a well differentiated and significantly higher gene expression for CS/SF/30%nHAP NMS at day 14, 21, and 28 (Figure 8B). Mineralization must be substantially higher on CS/SF NMS with more nHAP and that could be the reason behind the elevated values of OPN expression at these stages. The later stage marker OCN also followed the same scenario expressed by OPN, by showing upregulated expression at day 21 and 28 (Figure 8C). The information on up–down regulations of genes is very informative and helps to understand the cell cycle behavior with respect to substrate properties and time. These results suggest that nHAP concentration plays a crucial role in cell differentiation to osteogenic lineages, irrespective of time.
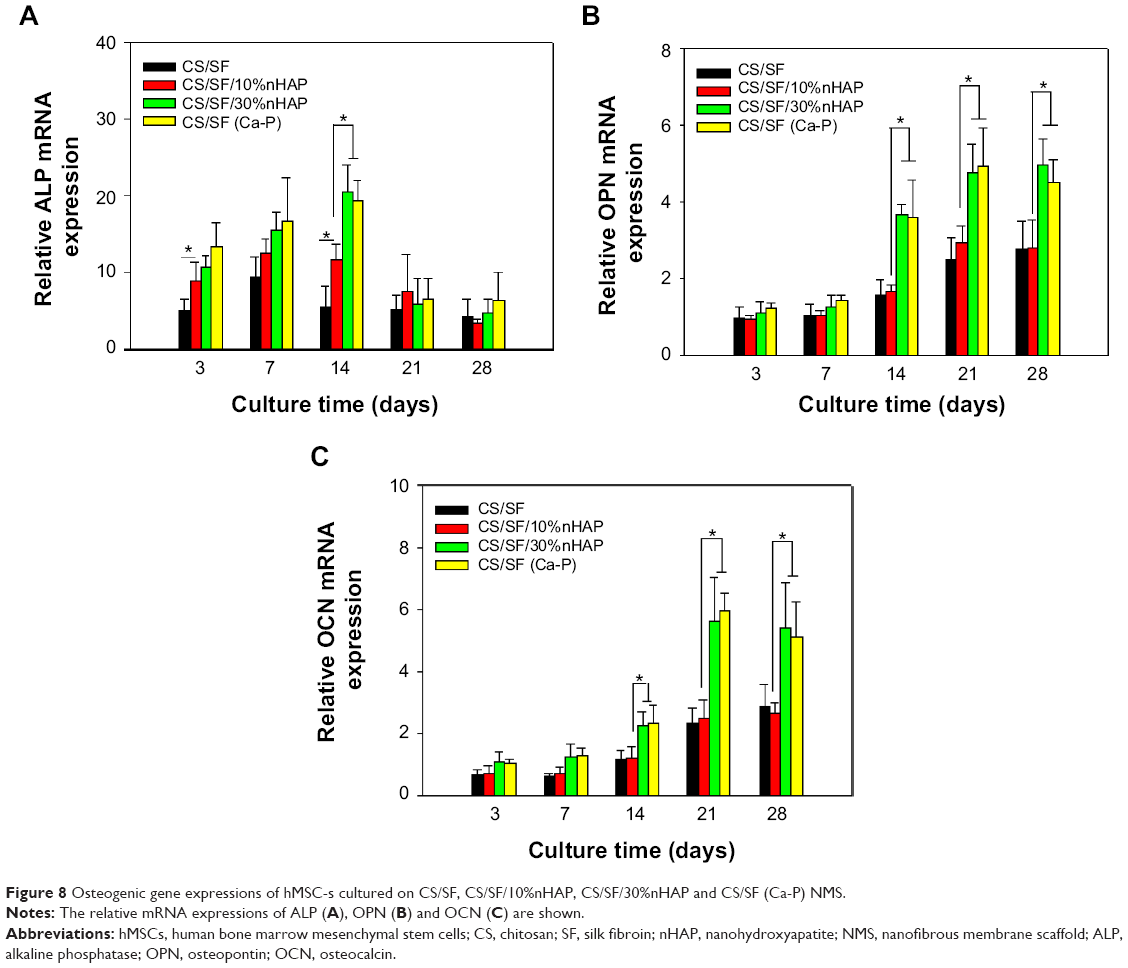 | Figure 8 Osteogenic gene expressions of hMSC-s cultured on CS/SF, CS/SF/10%nHAP, CS/SF/30%nHAP and CS/SF (Ca-P) NMS. |
Animal study
The CS/SF/30%nHAP NMS was seeded with hMSCs and implanted subcutaneously on the back of nude mice. The rationale behind the selection of CS/SF/30%nHAP NMS for implantation was purely based on the inferior mechanical properties of soaked NMS containing 30%nHAP (CS/SF [Ca-P]) compared to blended and pristine NMS (Table 3). Animals were anesthetized and sacrificed to evaluate bone formation properties after 4 and 8 weeks. Figure 9A shows the photograph of CS/SF/30%nHAP NMS prior to implantation. The scaffold maintained physical integrity till week 8 while allowing vascularization to occur on top of the scaffold (Figure 9B). It implies that CS/SF/30%nHAP NMS seeded with hMSCs could form ectopic bone by integrating well with the subcutaneous tissue of nude mice.
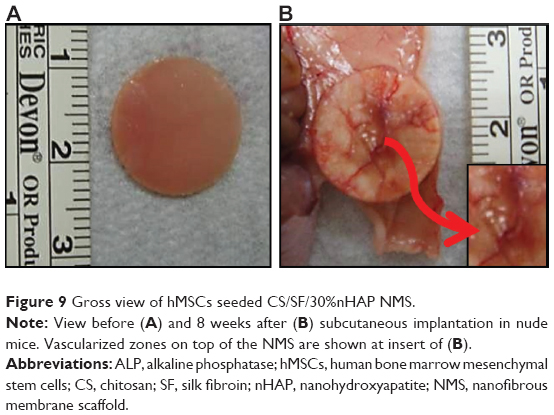 | Figure 9 Gross view of hMSCs seeded CS/SF/30%nHAP NMS. |
The specimen was further harvested and examined by histology and IHC (Figure 10). To confirm tissue development and understand induction of bone formation, the harvested samples were compared with acellular NMS. H&E and Masson’s trichrome stains were used for histology, whereas collagen 1 (COL I) and osteocalcin (OCN) were used for IHC. H&E staining confirmed cell migration and proliferation, showing drastic change in cell number in comparison with acellular control samples. It is the prime clue to show osteoid formation with osteoblasts in the bone matrix, which can be very well observed as dark violet background at both 4 and 8 weeks. The acellular NMS at 4 and 8 weeks also showed slight violet staining due to cell ingrowth into scaffold premises from surrounding tissues. The reddish violet color represents NMS, which is more visible at both time points for the control and the cell-seeded sample at week 4. For longer periods, cell density increased as observed from the 8-week sample, with less reddish violet color of NMS due to in vivo degradation. This phenomenon can be observed in all types of staining, showing the possibility of outside tissue ingrowth over acellular membrane. Moreover, the initiation of vessel formation can also be observed and denoted by yellow arrows in cell-seeded NMS. The longitudinal arrangements of cells in the scaffold premises confirm the formation of connective tissues in the scaffold. Masson’s trichrome stain reveals osteoids as blue stains in sections of cell-seeded NMS as hMSC differentiated into osteoblasts and embedded osteoids in the newly formed tissue matrix. This could be very well observed at the bottom parts of the cell-seeded scaffolds at 4 and 8 weeks with relatively higher blue intensities on the 8 weeks hMSC/NMS sample.
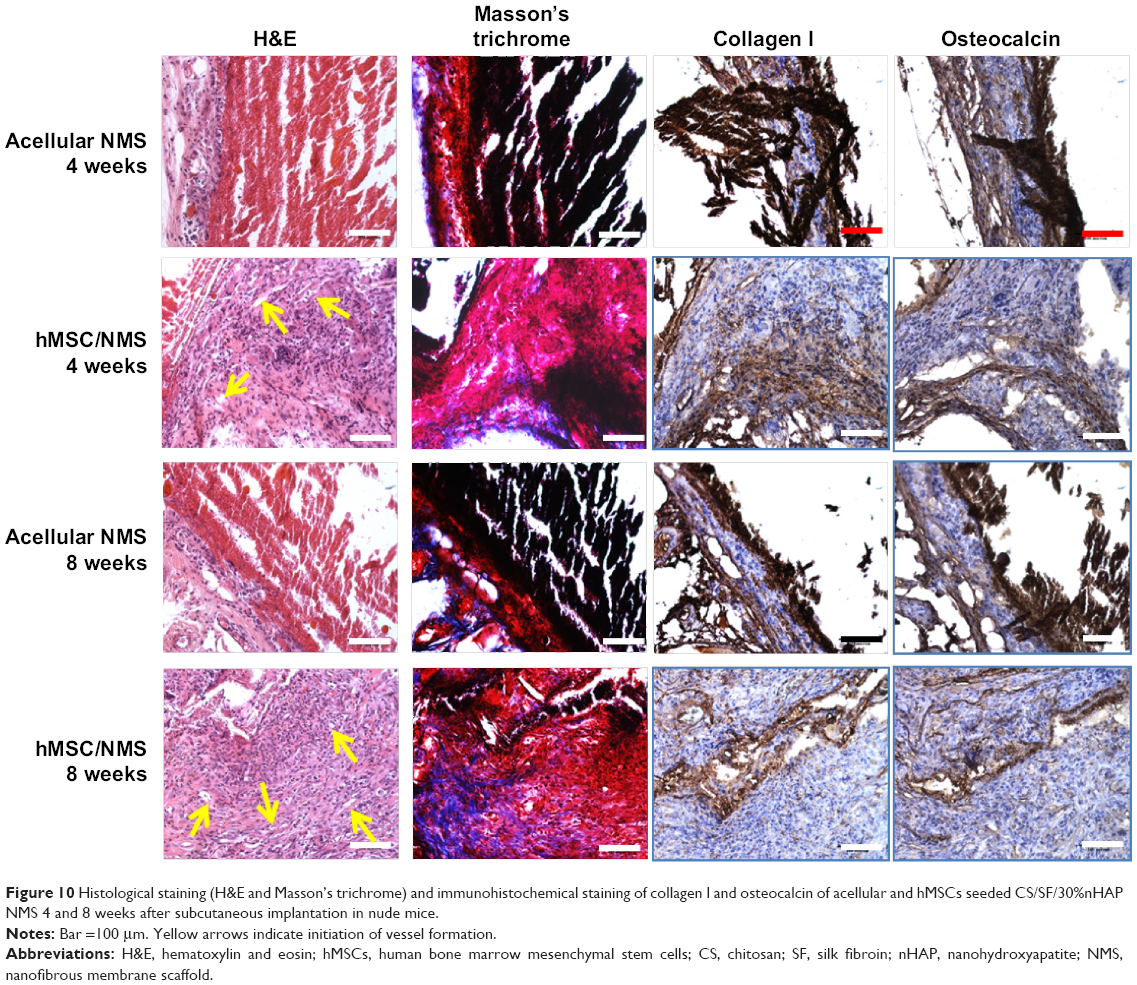 | Figure 10 Histological staining (H&E and Masson’s trichrome) and immunohistochemical staining of collagen I and osteocalcin of acellular and hMSCs seeded CS/SF/30%nHAP NMS 4 and 8 weeks after subcutaneous implantation in nude mice. |
In IHC, the bone formation was further confirmed by COL I and OCN staining. Both COL I and OCN display intense brown stains at both time periods, with totally enhanced spreading at 8 weeks. Being an early differentiation marker, COL I stain intensity was comparatively higher than OCN at 4 weeks. Consequently, 8-week staining intensity was relatively higher for OCN owing to the late expression of the same compared to COL I. The purple color in both test samples are due to the presence of cell nucleus, which is not very intense in control samples. The highly intense brown stains corresponding to the late differentiation protein OCN explain the potential of CS/SF/30%nHAP NMS to form bone tissue. In short, COL I (component of osteoid) and ground substance OCN were identified by sequential section staining, confirming the osteoblast phenotypes on harvested NMS seeded with hMSCs. The above results explain the effect of nHAP blending in differentiation of hMSC to bone. Taken together, the CS/SF/30%nHAP NMS is a potential candidate for bone repair and regeneration process in vivo.
Cell-seeded CS/SF/30%nHAP NMS along with acellular control samples were analyzed by μ-CT at 4 and 8 weeks of implantation (Figure 11). μ-CT is a four stage process involving scanning, reconstruction, visualization, and data collection. As X-ray passes through different types of tissues, they will be deflected and adsorbed at different degrees. 2D representations of a slice of an object are produced based on the density of material, by measuring transmissions of X-rays. These slices were made into 3D pixels, known as voxels. Each voxel was assigned with a CT (gray) value derived from a linear attenuation coefficient, relating to the density of the materials being scanned. From μ-CT, the attenuation values observed for acellular NMS at 4 weeks is 2,340 HU/mm2 whereas for cell-seeded NMS is 2,369 HU/mm2. The higher value for cell-seeded sample is due to higher mineralized content and thereby density is higher. The enhanced density of the cell-seeded NMS can be verified by observing the increased signal strength of the same (white arrows) compared to control samples (red arrows). Considering longer durations of implantation (8 weeks), the attenuation coefficient for cell-seeded NMS was 2,501 HU/mm2 whereas control NMS showed 2,351 HU/mm2. This could be due to the presence of denser mineralized components in the cell seeded CS/SF/30%nHAP NMS compared to control NMS. Though the control samples were without cells, a slight white contrast observed in the same might be due to the presence of nHAP in NMS. Alternatively, possibility of outside tissue in-growth over the acellular NMS surface should be also considered, as observed for IHC staining. Nonetheless, the time-dependent increase of attenuation coefficient for the hMSC/NMS sample from μ-CT analysis confirms the bone regeneration potential of nHAP-containing CS/SF NMS in vivo.
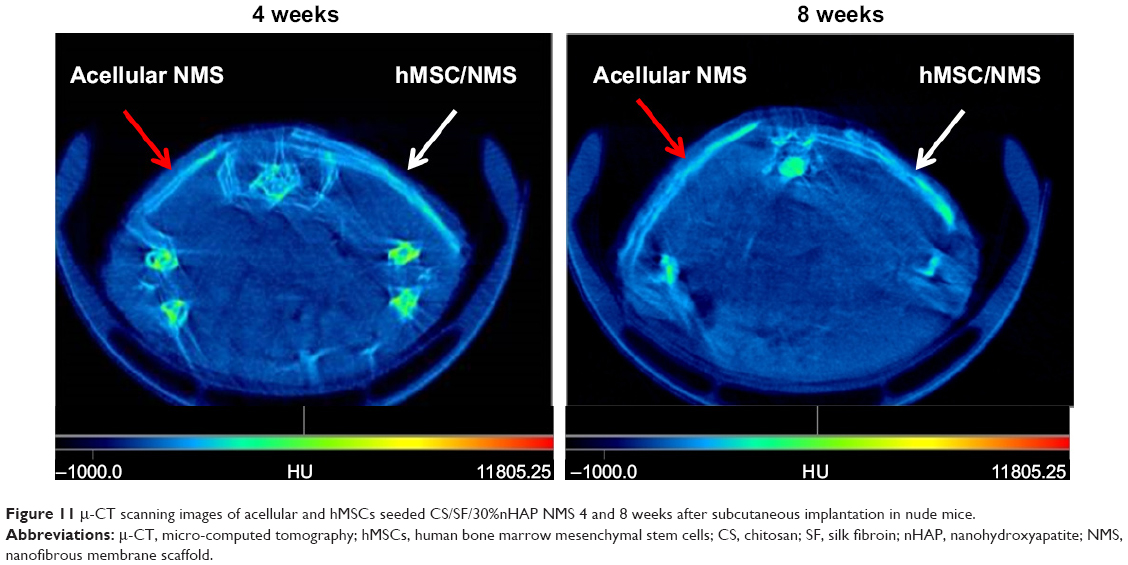 | Figure 11 µ-CT scanning images of acellular and hMSCs seeded CS/SF/30%nHAP NMS 4 and 8 weeks after subcutaneous implantation in nude mice. |
Conclusion
CS/SF/nHAP composite NMSs with 10% or 30% embedded nHAP by preelectrospinning in situ blending or 30% deposited nHAP by postelectrospinning alternate soaking could be prepared. The presence of various amount of nHAP within different location of the CS/SF nanofiber could be confirmed from SEM, FTIR, TGA, and XPS measurements. The proliferation of hMSCs on CS/SF NMS is independent of the presence of nHAP. Nonetheless, the incorporation of nHAP promotes osteogenic differentiation of hMSCs and the extent of differentiation depends on the concentration of nHAP. From in vitro cell culture experiments, the ALP activity, expression level of osteogenic genes, and extent of mineralization of hMSCs follow the order CS/SF/30%nHAP > CS/SF/10%nHAP > CS/SF NMS, indicating nHAP in NMS is beneficial for hMSCs differentiation toward the osteoblastic lineage in a concentration-dependent manner. In contrast, when incorporated at the same concentration in NMS, embedded nHAP or deposited nHAP does not show any significant influence on hMSCs differentiation except that the mineralized ECM of the latter has a Ca/P ratio closer to that of bone. However, the alternative soaking process that produces deposited nHAP by surface mineralization adversely influenced the mechanical properties of NMS. Taken together, the blended CS/SF/30%nHAP NMS was deemed the best scaffold for bone regeneration. An in vivo ectopic bone formation experiment with nude mice also confirmed this scaffold to be an excellent tool for bone tissue engineering from μ-CT and histology analysis.
Acknowledgments
We are thankful for the financial support from National Science Council, Taiwan, ROC (NSC-100-2221-E-182-024 and NSC-101-2221-E-182-029) and Chang Gung Memorial Hospital (CMRPD1B0241 and CMRPD1B0242).
Disclosure
The authors report no conflicts of interest in this work.
References
Chaudhury K, Kumar V, Kandasamy J, RoyChoudhury S. Regenerative nanomedicine: current perspectives and future directions. Int J Nanomedicine. 2014;9(1):4153–4167. | ||
Boccaccini AR, Blaker JJ. Bioactive composite materials for tissue engineering scaffolds. Expert Rev Med Devices. 2005;2(3): 303–317. | ||
Shalumon KT, Binulal NS, Deepthy M, et al. Preparation, characterization and cell attachment studies of electrospun multi-scale poly(caprolactone) fibrous scaffolds for tissue engineering. J Macromol Sci Part A. 2010;48(1):21–30. | ||
Lu T, Li Y, Chen T. Techniques for fabrication and construction of three-dimensional scaffolds for tissue engineering. Int J Nanomedicine. 2013;8(2):337–350. | ||
Haugh MG, Murphy CM, O’Brien FJ. Novel freeze-drying methods to produce a range of collagen-glycosaminoglycan scaffolds with tailored mean pore sizes. Tissue Eng Part C Methods. 2010;16(5):887–894. | ||
Salerno A, Oliviero M, Di Maio E, Iannace S, Netti PA. Design of porous polymeric scaffolds by gas foaming of heterogeneous blends. J Mater Sci Mater Med. 2009;20(10):2043–2051. | ||
Chen JP, Chang YS. Preparation and characterization of composite nanofibers of polycaprolactone and nanohydroxyapatite for osteogenic differentiation of mesenchymal stem cells. Colloids Surf B Biointerfaces. 2011;86(1):169–175. | ||
Wang M. Developing bioactive composite materials for tissue replacement. Biomaterials. 2003;24(13):2133–2151. | ||
Lai GJ, Shalumon KT, Chen SH, Chen JP. Composite chitosan/silk fibroin nanofibers for modulation of osteogenic differentiation and proliferation of human mesenchymal stem cells. Carbohydr Polym. 2014;111:288–297. | ||
Costa-Pinto AR, Correlo VM, Sol PC, et al. Osteogenic differentiation of human bone marrow mesenchymal stem cells seeded on melt based chitosan scaffolds for bone tissue engineering applications. Biomacromolecules. 2009;10(8):2067–2073. | ||
Kuo CK, Ma PX. Ionically crosslinked alginate hydrogels as scaffolds for tissue engineering: Part 1. Structure, gelation rate and mechanical properties. Biomaterials. 2001;22(6):511–521. | ||
Kang HW, Tabata Y, Ikada Y. Fabrication of porous gelatin scaffolds for tissue engineering. Biomaterials. 1999;20(14):1339–1344. | ||
Fakhari A, Berkland C. Applications and emerging trends of hyaluronic acid in tissue engineering, as a dermal filler and in osteoarthritis treatment. Acta Biomater. 2013;9(7):7081–7092. | ||
Bhardwaj N, Kundu SC. Silk fibroin protein and chitosan polyelectrolyte complex porous scaffolds for tissue engineering applications. Carbohydr Polym. 2011;85(2):325–333. | ||
Omenetto FG, Kaplan DL. New opportunities for an ancient material. Science. 2010;329(5991):528–531. | ||
Kuboyama N, Kiba H, Arai K, et al. Silk fibroin-based scaffolds for bone regeneration. J Biomed Mater Res B Appl Biomater. 2013;101B(2): 295–302. | ||
Kasoju N, Bora U. Silk fibroin based biomimetic artificial extracellular matrix for hepatic tissue engineering applications. Biomed Mater. 2012;7(4):045004. | ||
Foss C, Merzari E, Migliaresi C, Motta A. Silk fibroin/hyaluronic acid 3D matrices for cartilage tissue engineering. Biomacromolecules. 2013;14(1):38–47. | ||
Baek HS, Park YH, Ki CS, et al. Enhanced chondrogenic responses of articular chondrocytes onto porous silk fibroin scaffolds treated with microwave-induced argon plasma. Surf Coat Technol. 2008; 202(22–23):5794–5797. | ||
Hutmacher DW. Scaffolds in tissue engineering bone and cartilage. Biomaterials. 2000;21(24):2529–2543. | ||
Wei G, Ma PX. Structure and properties of nano-hydroxyapatite/polymer composite scaffolds for bone tissue engineering. Biomaterials. 2004;25(19):4749–4757. | ||
Wei K, Li Y, Kim KO, et al. Fabrication of nano-hydroxyapatite on electrospun silk fibroin nanofiber and their effects in osteoblastic behavior. J Biomed Mater Res A. 2011;97A(3):272–280. | ||
Ito Y, Hasuda H, Kamitakahara M, et al. A composite of hydroxyapatite with electrospun biodegradable nanofibers as a tissue engineering material. J Biosci Bioeng. 2005;100(1):43–49. | ||
Peng F, Yu X, Wei M. In vitro cell performance on hydroxyapatite particles/poly(L-lactic acid) nanofibrous scaffolds with an excellent particle along nanofiber orientation. Acta Biomater. 2011;7(6): 2585–2592. | ||
Jegal SH, Park JH, Kim JH, et al. Functional composite nanofibers of poly(lactide-co-caprolactone) containing gelatin-apatite bone mimetic precipitate for bone regeneration. Acta Biomater. 2011;7(4): 1609–1617. | ||
Zhang Y, Venugopal JR, El-Turki A, Ramakrishna S, Su B, Lim CT. Electrospun biomimetic nanocomposite nanofibers of hydroxyapatite/chitosan for bone tissue engineering. Biomaterials. 2008;29(32):4314–4322. | ||
Kim H, Che L, Ha Y, Ryu W. Mechanically-reinforced electrospun composite silk fibroin nanofibers containing hydroxyapatite nanoparticles. Mater Sci Eng C Mater Biol Appl. 2014;40:324–335. | ||
Chen JP, Chen SH, Lai GJ. Preparation and characterization of biomimetic silk fibroin/chitosan composite nanofibers by electrospinning for osteoblasts culture. Nanoscale Res Lett. 2012;7(1):170. | ||
Shih WJ, Chen YF, Wang MC, Hon MH. Crystal growth and morphology of the nano-sized hydroxyapatite powders synthesized from CaHPO4·2H2O and CaCO3 by hydrolysis method. J Cryst Growth. 2004; 270(1–2):211–218. | ||
Ngiam M, Liao S, Patil AJ, et al. Fabrication of mineralized polymeric nanofibrous composites for bone graft materials. Tissue Eng Part A. 2009; 15(3):535–546. | ||
Chen JP, Tsai MJ, Liao HT. Incorporation of biphasic calcium phosphate microparticles in injectable thermoresponsive hydrogel modulates bone cell proliferation and differentiation. Colloids Surf B Biointerfaces. 2013;110(1):120–129. | ||
Schiffman, JD, Schauer, CL. A review: electrospinning of biopolymer nanofibers and their applications. Polym Rev. 2008;48:317–352. | ||
Hasegawa M, Isogai A, Onabe F, Usuda M. Dissolving states of cellulose and chitosan in trifluoroacetic acid. J Appl Polym Sci. 1992;45(10): 1857–1863. | ||
Matsuda A, Kagata G, Kino R, Tanaka J. Preparation of chitosan nanofiber tube by electrospinning. J Nanosci Nanotechnol. 2007;7(3): 852–855. | ||
She Z, Jin C, Huang Z, Zhang B, Feng Q, Xu Y. Silk fibroin/chitosan scaffold: preparation, characterization, and culture with HepG2 cell. J Mater Sci Mater Med. 2008;19(12):3545–3553. | ||
Kim SH, Nam YS, Lee TS, Park WH. Silk fibroin nanofiber. electrospinning, properties, and structure. Polym J. 2003;35:185–190. | ||
Lee JH, Rim NG, Jung HS, Shin H. Control of osteogenic differentiation and mineralization of human mesenchymal stem cells on composite nanofibers containing poly[lactic-co-(glycolic acid)] and hydroxyapatite. Macromol Biosci. 2010;10(2):173–182. | ||
Ko EK, Jeong SI, Rim NG, Lee YM, Shin H, Lee BK. In vitro osteogenic differentiation of human mesenchymal stem cells and in vivo bone formation in composite nanofiber meshes. Tissue Eng Part A. 2008;14(12):2105–2119. | ||
Ogata K, Imazato S, Ehara A, et al. Comparison of osteoblast responses to hydroxyapatite and hydroxyapatite/soluble calcium phosphate composites. J Biomed Mater Res Part A. 2005;72A(2):127–135. | ||
Toskas G, Cherif C, Hund RD, et al. Chitosan(PEO)/silica hybrid nanofibers as a potential biomaterial for bone regeneration. Carbohydr Polym. 2013;94(2):713–722. | ||
Ge S, Zhao N, Wang L, et al. Bone repair by periodontal ligament stem cell-seeded nanohydroxyapatite-chitosan scaffold. Int J Nanomedicine. 2012;7(12):5405–5414. |
 © 2015 The Author(s). This work is published and licensed by Dove Medical Press Limited. The
full terms of this license are available at https://www.dovepress.com/terms
and incorporate the Creative Commons Attribution
- Non Commercial (unported, 3.0) License.
By accessing the work you hereby accept the Terms. Non-commercial uses of the work are permitted
without any further permission from Dove Medical Press Limited, provided the work is properly
attributed. For permission for commercial use of this work, please see paragraphs 4.2 and 5 of our Terms.
© 2015 The Author(s). This work is published and licensed by Dove Medical Press Limited. The
full terms of this license are available at https://www.dovepress.com/terms
and incorporate the Creative Commons Attribution
- Non Commercial (unported, 3.0) License.
By accessing the work you hereby accept the Terms. Non-commercial uses of the work are permitted
without any further permission from Dove Medical Press Limited, provided the work is properly
attributed. For permission for commercial use of this work, please see paragraphs 4.2 and 5 of our Terms.