")
Back to Journals » Risk Management and Healthcare Policy » Volume 16
Resource Allocation Efficiency of Urban Medical and Health Financial Expenditure Under the Background of Employees’ Health
Received 14 March 2023
Accepted for publication 3 June 2023
Published 14 June 2023 Volume 2023:16 Pages 1059—1074
DOI https://doi.org/10.2147/RMHP.S412514
Checked for plagiarism Yes
Review by Single anonymous peer review
Peer reviewer comments 2
Editor who approved publication: Dr Jongwha Chang
Chunbo Gong, Huaixing Kang
ShanDong University of Traditional Chinese Medicine, JiNan, 250355, People’s Republic of China
Correspondence: Huaixing Kang, Email [email protected]
Introduction: The study proposes a method based on difference-in-differences (DID) to improve the resource allocation efficiency of medical and health financial expenditure to better guarantee the health level of enterprise employees. The DEA method is utilized to measure the comprehensive technology, pure technology, and scale as the resource allocation efficiency values of urban medical and health financial expenditure.
Methods: The proposed method includes the use of DEA to measure the resource allocation efficiency values of urban medical and health financial expenditure. The benchmark regression model and DID model are used to analyze the impact effect, robustness, and parallel trend of the policy.
Results: The study shows that the proposed method effectively evaluates and analyzes the impact of medical comprehensive reform on the resource allocation efficiency of urban medical and health financial expenditure. The comprehensive medical reform can improve the comprehensive efficiency and scale efficiency of urban medical and health financial expenditure, leading to improved resource allocation efficiency of urban employees’ medical and health financial expenditure. The results also indicate a significant positive effect on the time trend, which can have a long-term impact and effectiveness.
Discussion: The proposed method can provide useful insights into the resource allocation efficiency of medical and health financial expenditure, which can help improve the health level of enterprise employees. The study suggests that comprehensive medical reform can be an effective way to improve resource allocation efficiency and guarantee the health of employees in urban areas. Further research can be conducted to evaluate the impact of medical reform on other aspects of health care, such as quality and accessibility.
Keywords: data envelopment analysis, difference-in-differences, regression model, employees’ health, resource allocation efficiency
Introduction
Medical and health care is the foundation of a country, so it is very important to do a good job in allocating resources for medical and health financial expenditures. In the national fiscal expenditure, employees’ medical and health financial expenditure occupies a place.1,2 According to the data of the Social Security Department of the Ministry of Finance of China, in 2016, China’s national financial expenditure on medical and health care was 4.1 times that before the launch of the comprehensive medical reform in 2008, with a total expenditure of 1315.4 billion yuan, accounting for 7.0% of the fiscal expenditure, with a significant increase. As can be seen, the medical and health financial expenditure has a great significance in the national financial expenditure. Due to the unequal growth of these services in urban and rural areas, the allocation of financial resources for medical and healthcare services is characterised by an unfair imbalance.3 Therefore, it is very necessary to reasonably allocate medical and health financial expenditure resources. Zeng Zhi et al4 proposed a method of horizontal integration and financing reform for healthcare. By utilizing the inductive approach to analyze national and local policy documents along with administrative data, researchers concluded that implementing financial governance and incentive mechanisms could facilitate healthcare reform and foster the equitable allocation of financial resources for medical and healthcare expenditures. Hu Lin et al5 conducted empirical research to examine the influence of healthcare system innovation in China on the rational utilization of antibiotics. Their findings suggest that healthcare system innovation in China is beneficial in promoting the appropriate use of antibiotics in county-level hospitals. Additionally, the authors highlight the potential of a systematic approach to medical reform, which includes an efficient governance structure, a dynamic financial compensation mechanism, and specialized drug management, as a promising avenue for future reforms in public hospitals. Guijie Wang et al6 empirically studied the important development of the medical insurance reform centre in Weihai City, Shandong Province, and summarized the series of experiences of medical reform by using a questionnaire survey, field interview, excel data analysis and other methods, concluding that medical reform is encouraging to improving the allocation of medical and health financial expenditure resources. Feng Jie et al7 used the Cochan-Aritage trend test and the linear trend test to analyze the absolute values of health resource allocation and health service supply to evaluate the evolution of primary healthcare through time. By using this technique, they were able to track developments in primary care and assess their significance. Health reform proponents argued that although primary care advanced swiftly, the rest of the health care system lagged behind. Li Jing Wei et al8 conducted an empirical study on health and medical inequality in China’s medical reform by combining the time-varying DID method and concentration index, and believed that what should be paid more attention to in medical reform to expand income and reduce inequality, which provided policy enlightenment for policymakers. Increasing the input of medical resources, building a hierarchical medical system and combining medical and nursing care may make a difference. By analyzing the number of patients in large general hospitals, Hu Xiaojing et al9 believed that there were problems of low utilization of doctors’ resources and unbalanced medical and health financial expenditure after China’s medical reform, and suggested that Chinese policy makers and hospital administrators should pay attention to it and take timely measures. Moallef Soroush et al10 analyzed the population of drug users in Canada under the background of comprehensive medical reform and believed that multi-level intervention measures were needed to make up for the shortage of healthcare quality, to reduce nursing avoidance.
The medical and health reform policies have a certain impact on the resource allocation efficiency of medical and health financial expenditure, but there is a lack of an effective healthy consumption evaluation method.11 Therefore, to better guarantee the health level of enterprise employees, an analysis method of resource allocation efficiency of urban medical and health financial expenditure based on difference-in-differences is proposed by combining the DEA algorithm and DID model. To tackle this issue, numerous studies have been undertaken to advance the rational allocation of financial resources for medical and healthcare expenditures. Despite diligent efforts, there remains a notable absence of a robust evaluation method to effectively measure the efficiency of allocating medical and health financial resources. In this particular context, the objective of the proposed study is to establish a methodology for assessing the efficiency of resource allocation in urban medical and health financial expenditures. This will be achieved by integrating the DEA (Data Envelopment Analysis) algorithm with the difference-in-differences (DID) model. The proposed method will provide useful insights into the allocation efficiency of medical and health financial expenditure, which can help improve the health level of enterprise employees. Objectives of the study will include determining how best to optimize medical and health finance resources and evaluating how sweeping healthcare reform would affect resource allocation.
Methods
Introduction of the DEA Model
DEA model is a systematic analysis method, which is used to measure the production efficiency of the decision-making department. The principle of efficiency evaluation is to use linear programming to calculate the production frontier of all decision-making units (DMU) and judge the respective efficiency according to the relative position of the DMU and the production frontier, considering there is efficiency in DMU on the production frontier.12 In brief, the principle of the DEA model is shown in Figure 1.13 In Figure 1, U1~U4 are four decision-making units; X1 and X2 are two resources put into production activities; Y is the corresponding output. Make a broken line from U2 to U4. Firstly, the vertical ray is made from U2 to U2M, and the horizontal ray is made from U1 to U1N. Then M, U2, U3, U1, and N are the production frontier. For the DMU located on this production frontier, U1~U3 are DEA effective, while U4 is non-DEA effective. This indicates that, for U1~U3, the input amount of X1 and X2 invested in output Y should remain stable In addition, a reduction in the amount of one resource requires an increase in the amount of the other. For B, since U4 is ineffective, U4 uses too many resources, and the input of B can produce no less than the output of U4. However, to make U4 evolve into DEA effective, the resources X1 and X2 invested in producing Y must be reduced.
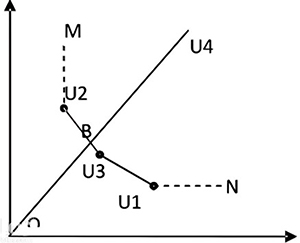 |
Figure 1 Evaluation principle of DEA model. |
Introduction of DID Algorithm
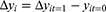
A statistical methodology known as the Difference-in-Differences (DiD) technique is used in econometrics and other social sciences to assess the impact of a particular intervention or project (such as a policy or project). This method is frequently used to compare the long-term outcomes of a treatment group with those of a control group that did not receive the intervention. The Difference-in-Differences (DiD) methodology is based on calculating the difference between post-intervention and pre-intervention measures within the treatment group and then subtracting the difference between post-intervention and pre-intervention measures within the control group. This results in an estimate of the causal effect of the treatment. The fundamental assumption of the Difference-in-Differences (DiD) methodology is the parallel trends assumption. This assumption posits that, in the absence of treatment, the average treatment group and the control group would exhibit a similar trend over time. This assumption cannot be directly tested and is often one of the main issues when using the DiD methodology. Its basic principle is as follows: Suppose there is a two-period panel data, as shown in Equation (1):14

Where, Tiε{0,1} is a time dummy variable; Ti=0 and Ti=1 represent the first and second phase of policy implementation respectively; Giε{0,1} is individual dummy variable; Gi=0 and Gi=1 represents the control group and experimental group respectively; DIDit=Ti*Gi is the policy dummy variable, that is, the difference-in-differences variable, where t=0,1. When t=0 there is no difference between the experimental group and the control group because DIDit is 0. When t=1, the results of the experimental group and control group are different. The reason is that the experimental group Gi=1 then its policy dummy variable DIDit=1, and the control group Gi=0, then the policy dummy variable DIDit=0; β is the difference-in-differences coefficient, which can measure the effect of policy implementation. εit is the random disturbance term, which represents the unobservable characteristics of time and individuals.
The DID algorithm is used to make the first first-order difference to Equation (1), as shown in Equation (2).To eliminate the heterogeneity of individuals that do not change with time, Equation (1) can be transformed into Equation (3):15

According to Equation (3), the first-order difference between the experimental group and the control group can be obtained as follows:


The second difference is made between Equations (4) and (5), as shown in Equation (6):16,17

According to Equation (6), the real-time net income of policy is the coefficient of the difference-in-differences term, which is the coefficient before in Equation (1).
Assuming that there is a control variable in the difference-in-differences process, Equation (1) can be expressed as:18,19

Then, before and after the implementation of the policy, the observable results of the control group and the experimental group can be expressed as:
Before policy implementation (T=0), experimental group (G=1):

Before policy implementation (T=0),control group (G=0):

After policy implementation (T=1), experimental group (G=1):

After policy implementation (T=1),control group (G=0):

In brief, the basic principle of DID algorithm can be represented in Figure 2.20
 |
Figure 2 DID algorithm principle. |
The Difference-in-Differences (DID) algorithm is indeed a commonly used method for evaluating the effects of policies or projects. It is particularly useful when you want to compare the outcomes of a treatment group (exposed to a policy or project) with a control group (not exposed to the policy or project) while accounting for time and grouping effects. In the context of evaluating the resource allocation efficiency of urban medical and health financial expenditure, the DID algorithm can help assess the impact of specific policies or projects on the efficiency of resource allocation. The parallel trends assumption in Difference-in-Differences (DiD) analysis is crucial for unbiased estimation of the causal effect. This assumption holds that, in the absence of treatment, the treatment and control groups would have followed the same trend over time. To validate the parallel trends assumption, one common method is to inspect pre-treatment trends visually. This involves plotting the outcome variable over time for the treatment and control groups separately. If the trends look parallel in the pre-treatment period, this provides some evidence for the parallel trends assumption.
However, visual inspection is not always sufficient or conclusive. Therefore, a more rigorous method involves using a version of the DiD model that includes period-specific treatment effects or an interaction term between the treatment group indicator and a time trend. This model allows for the treatment effect to vary over time. The non-significance of the coefficients on the interaction factors is seen as evidence for the correctness of the parallel trends assumption. This indicates that, without intervention, there is a comparable tendency over time across the treatment and control groups. Specifically for hospitals or healthcare research, data sources could include hospital administrative data, electronic health records, insurance claims data, patient surveys, and more. The choice of data source would depend on the research question and the availability of data.
Resource Allocation Efficiency of Urban Medical and Health Financial Expenditure Based on Difference-in-Differences
The analysis of resource allocation efficiency in urban employees’ medical and health financial expenditure follows these fundamental steps: Firstly, the DEA model is employed to compute the value of resource allocation efficiency for medical and health financial expenditure. Subsequently, utilizing the benchmark regression model, the DID model is utilized to assess the resource allocation efficiency of urban medical and health financial expenditure from three perspectives: the effect of policy impact, robustness, and parallel trend analysis.
Firstly, in line with the aforementioned approach, the DEA method is employed to determine both the value of healthy consumption and the resource allocation efficiency of urban employees’ medical and health financial expenditure.
Before conducting DEA, it is crucial to meticulously choose suitable input and output indicators to effectively assess the resource allocation efficiency of urban medical and health financial expenditure. Considering the factors that influence the resource allocation efficiency of urban medical and health financial expenditure, two indicators have been selected. The first-level indicator is medical and health government investment, while the second-level indicator is medical and health financial expenditure (measured in 100 million yuan). These indicators will be used as input indices for the analysis. The primary indicators for assessing the output index of medical and healthcare include the condition of medical and health institutions, facilities, personnel, and the health status of employees. These indicators are measured through factors such as the number of health institutions (in hundreds), the capacity of beds in health institutions (in thousands), the quantity of personnel in health institutions (in thousands), and the population mortality rate (per thousand).21,22
Secondly, the efficiency of urban medical and health financial expenditure is calculated. The resource allocation efficiency value of urban medical financial expenditure is closely related to the comprehensive technical efficiency, pure technical efficiency and scale efficiency values. Therefore, comprehensive technical efficiency, pure technical efficiency and scale efficiency values are selected as the explained variables.
The benchmark regression model is then used to evaluate the effectiveness of resource allocation for urban medical and health spending. This is paired with the health consumption of the workforce. The benchmark regression model of urban medical and health financial expenditure resource allocation efficiency may be summarised as follows, according to the resource allocation efficiency value of medical and health financial expenditure determined by the DEA model:


Where, crsteit vrsteit and scaleit are comprehensive technical efficiency, pure technical efficiency and scale efficiency respectively; DIDit is the policy dummy variable; β is the difference-in-differences coefficient; εit is the random disturbance term.
By introducing relevant control variables, Equations (12) ~ (14) can be rewritten as:


Where, Zit is the control variable, which mainly includes control variables such as urbanization, economic development level and population density logarithm.23
Finally, DID model is adopted to analyze the impact effect, robustness and parallel trend of the policy, which realizes the analysis of urban medical and health financial expenditure resource allocation efficiency, and the evaluation of employee’s health consumption.
Empirical Research
Data Source and Pre-Processing
Explained Variable
The explained variable of this experiment is the resource allocation efficiency of urban employee’s medical and health financial expenditure, including three efficiency values of comprehensive technical efficiency, pure technical efficiency and scale efficiency, all of which are calculated by DEA.
Explaining Variable
The explaining variables of this experiment include the experimental group and the control group. According to the guidelines of the pilot reform of urban hospitals, the time dummy variable Ti is before and after the implementation of the policy in 2012, Ti =0 means the time before the implementation of the policy in 2012, and Ti =1 indicates the time after the test of the policy in 2012. In addition, the first 7 urban hospitals are selected as the experimental group, that is, Gi =1; There are 34 non-pilot urban hospitals selected as the control group, that is, Gi=0. The details are shown in Table 1.24,25
 |
Table 1 List of Cities in Experimental and Control Groups |
Considering that there is large difference in the sample volume between the experimental group and the control group, the samples of municipalities directly under the central government and the samples of prefecture-level cities in non-pilot cities are excluded to avoid the error of analysis results.
Control Variable
The control variables of this experiment are urbanization, natural population growth rate, population density logarithm, industrial structure and economic development level, and the data are from relevant data of selected city statistics, CSMAR database and China City Statistical Yearbook.26,27 Among them, urbanization is obtained by calculating the proportion of the non-agricultural population in the total population. Urbanization was included as a control variable because it has been found to have a significant impact on healthcare utilization and resource allocation in urban areas. The proportion of the non-agricultural population in the total population is often used as a measure of urbanization. The composition of the industry may be determined by dividing GDP by the secondary sector’s added value. The employee’s health consumption is evaluated. The logarithm of population density is obtained by logarithmic processing of population density. Population density logarithm was included because population density can affect the availability and accessibility of health care services. The logarithmic transformation is often used to account for non-linear relationships between variables. Logarithmically transforming GDP per person yields a measure of economic development. Industrial structure and economic development level were included because they can impact the overall level of economic development and the availability of resources for health care. The industrial structure is often measured by looking at the share of GDP attributable to secondary industries, whereas economic development is typically quantified by looking at the logarithm of per capita GDP. The natural population growth rate is calculated from the birth rate and the death rate. The sample sizes and their descriptive statistics are shown in Table 2.28 The natural population growth rate was included because population growth can affect the demand for healthcare services and the allocation of resources. The natural population growth rate is calculated from the birth rate and the death rate. By controlling for these variables, the study is better able to isolate the effect of medical comprehensive reform on the resource allocation efficiency of urban medical and health financial expenditure. The inclusion of these control variables also helps to ensure the robustness and validity of the study’s findings.
 |
Table 2 Description and Descriptive Statistics of Each Sample Volume |
Statistical Techniques and the Data Sources
To test the parallel trend of hospitals, the Difference-in-Differences (DID) method was employed. This method is a statistical technique that compares the change in an outcome variable before and after a policy intervention between a treatment group and a control group, with the assumption that both groups would have followed parallel trends in the absence of the policy intervention.
In this study, the policy intervention was the implementation of the comprehensive health care reform plan, and the treatment group was the hospitals located in the cities where the reform plan was implemented, while the control group was the hospitals located in the cities where the reform plan was not implemented. The outcome variable was the resource allocation efficiency values of urban medical and health financial expenditure (comprehensive technical efficiency value, pure technical efficiency value, and scale efficiency value).
To test the parallel trend assumption, the pre-intervention trends of the outcome variable in the treatment and control groups were compared. Specifically, the trend of the outcome variable in the treatment group was compared with the trend of the outcome variable in the control group in the pre-intervention period (before the implementation of the reform plan). If the trends were similar and parallel, then the parallel trend assumption was considered valid. The data sources used in this study were relevant data from selected city statistics, the CSMAR database, and China City Statistical Yearbook. The statistical software package Stata was used to conduct the statistical analysis.
In summary, the DID method was used to test the parallel trend of hospitals, and the pre-intervention trends of the outcome variable in the treatment and control groups were compared. The data sources used in this study included relevant data from selected city statistics, the CSMAR database, and China City Statistical Yearbook, and the statistical software package Stata was used to conduct the analysis.
Empirical Results
Impact Effect Analysis
Table 3 presents the results of the regression analysis using the difference-in-differences (DID) algorithm for different explained variables and regression models. Models (1) and (3) use comprehensive technical efficiency as the dependent variable, while models (2) and (4) use scale efficiency. Models (1) and (2) use ordinary least squares (OLS) regression, while models (3) and (4) use fixed effect regression.
 |
Table 3 Effects of Comprehensive Medical Reform on the Efficiency of Urban Medical and Health Financial Expenditure |
The results show that under the OLS model, the difference-in-differences variables of models (1) and (2) are positive and significant at the 10% significance level, suggesting that comprehensive medical care can improve the comprehensive technical efficiency and scale efficiency of urban medical and health financial expenditure. Model (3) indicates that comprehensive medical reform can improve comprehensive technical efficiency, with a positive and significant coefficient under the fixed effect model. Finally, with a positive and statistically significant difference-in-differences variable at the 5% level, model (4) demonstrates that the execution of comprehensive reform has greatly improved the scale efficiency of urban employees’ medical and health financial expenditures. Overall, the results suggest that after the implementation of comprehensive reform, the comprehensive technical efficiency and scale efficiency of urban medical and health financial expenditure have both improved positively. Specifically, the comprehensive technical efficiency has been improved by around 8.98%, while the scale efficiency has been improved by approximately 10.19%.
Robustness Analysis
To research the influence of control variables on the resource allocation efficiency of urban medical and health financial expenditure, based on the fixed efficiency model, employee’s health consumption is evaluated, control variables are added, and the results of difference-in-differences regression are shown in Table 4. Where, models (1) and (2), models (3) and (4) are fixed effect models and fixed effect models with variance correction after adding control variables, respectively.
 |
Table 4 Robustness Results with Control Variables Added |
Based on the provided table, it is evident that the difference-in-differences variables in models (1) and (2) show a positive and statistically significant impact at the 1% significance level. This indicates that the comprehensive medical reform has led to significant improvements in both the comprehensive technical efficiency and scale efficiency of urban medical and health financial expenditure. Furthermore, based on the results from the model (3), the difference-in-differences variable shows a positive and statistically significant impact at the 10% significance level. This suggests that the comprehensive medical reform has resulted in a significant improvement in the comprehensive technical efficiency of urban medical and health financial expenditure. In addition, according to the results obtained from model (4), the difference-in-differences variable displays a positive and statistically significant effect at the 1% significance level. This indicates that the comprehensive medical reform has led to a substantial improvement in the scale efficiency of urban medical and health financial expenditure. Based on the above results, no matter whether control variables are added or variance correction is made, the comprehensive medical reform policy can improve the comprehensive technical efficiency and scale efficiency of urban medical and health financial expenditure, and improve the resource allocation efficiency of urban medical and health financial expenditure. After adding the control variables, the significance of the comprehensive medical reform policy on the comprehensive technical efficiency and scale efficiency is enhanced, the comprehensive technical efficiency is significantly increased by 13.26%, and the scale efficiency is significantly increased by 18.04%, which further verifies that the comprehensive medical reform policy has a positive and significant impact on the efficiency of urban medical and health financial expenditure. It can improve the resource allocation efficiency of urban medical and health financial expenditure.
To further verify the robustness of the comprehensive medical reform policy, the implementation years of the comprehensive medical reform policy are assumed to be 2009, 2008 and 2007, and the samples are set as 2005–2011, 2005–2010 and 2005–2009, respectively. Then, the OLS model and fixed effects model with control variables are adopted for regression, and the results are shown in Table 5 and Table 6. As can be seen, when the comprehensive medical reform policy is implemented in any year and the health consumption is evaluated, and whether control variables are added or not, there is no significant positive impact between the policy and comprehensive technical efficiency and scale efficiency. Therefore, the estimated results of the impact of comprehensive medical reform on the efficiency of employee’s medical and health financial expenditure in pilot cities have certain robustness and reliability.
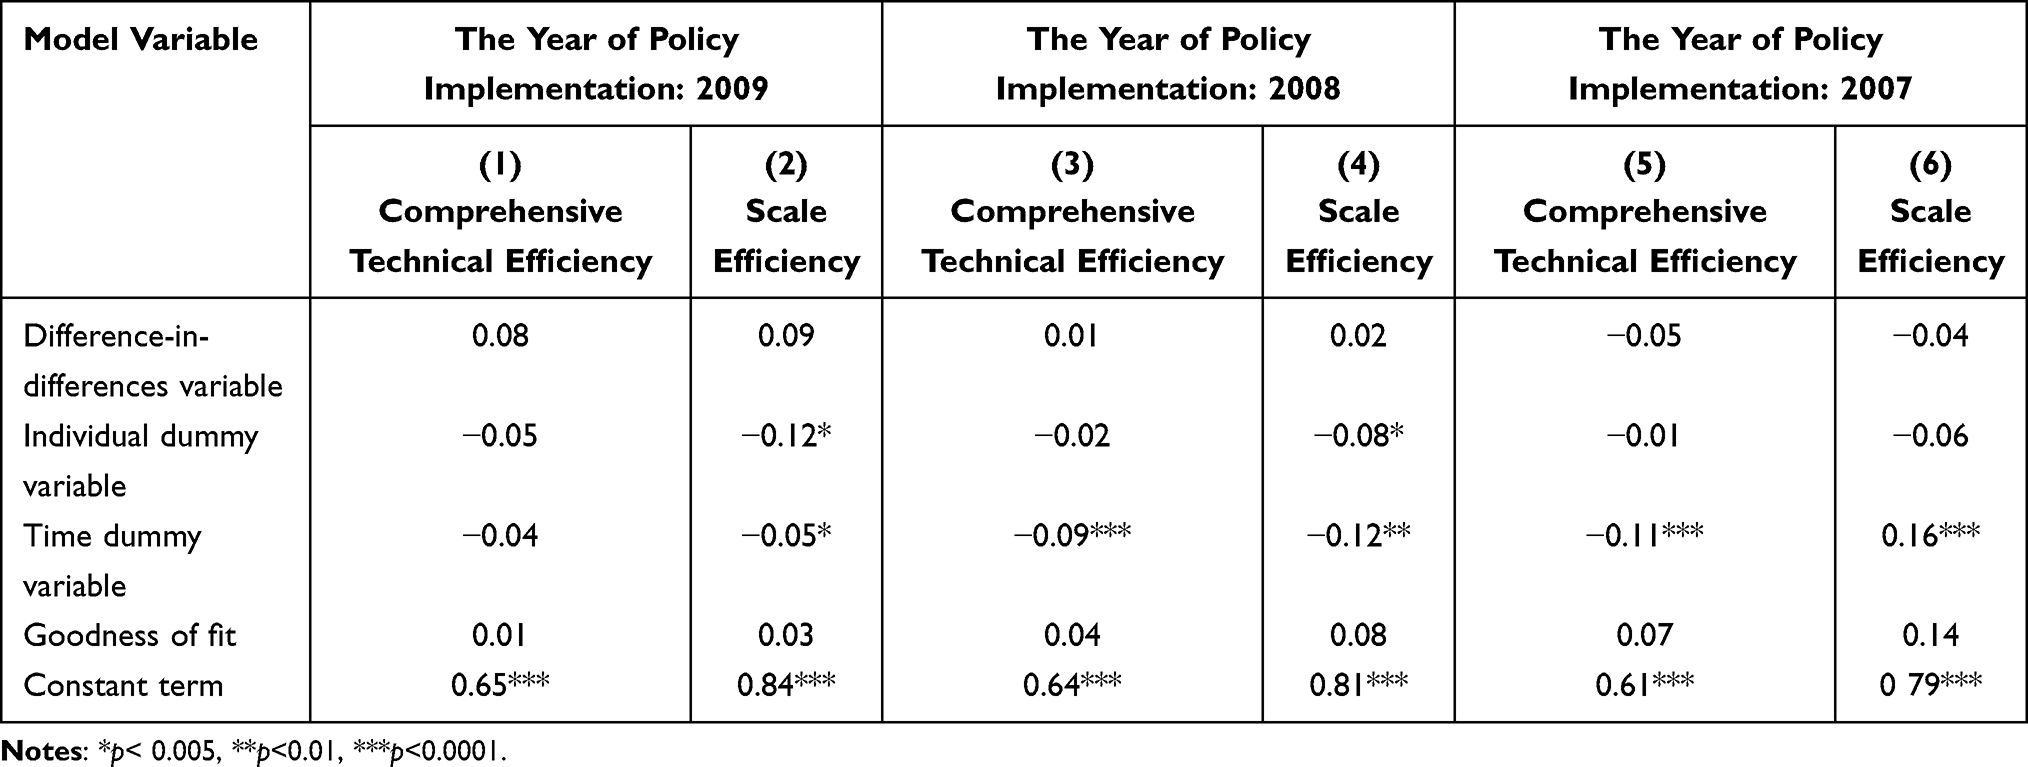 |
Table 5 OLS Model Detection Results |
 |
Table 6 Detection Results of Fixed Effects Model with Control Variables Added |
The data from two years (2016–2017) after the policy implementation is added and used as samples to conduct difference-in-differences regression on 7 pilot cities and 34 non-pilot cities. The results are shown in Table 7. Where model (1) and model (2) are respectively the difference-in-differences regression results of fixed effects model with comprehensive technical efficiency and scale efficiency as explained variables; Model (3) and model (4) are respectively the difference-in-differences regression results of fixed effects model after variance adjustment and with comprehensive technical efficiency and scale efficiency as explained variables. According to model (1) in the Table, it can be seen that the comprehensive technical efficiency of the pilot cities increased by about 9.78%, indicating that the comprehensive medical reform policy can improve the comprehensive technical efficiency. According to the findings from Model (2), the difference-in-differences variable demonstrates a positive and statistically significant impact at the 1% significance level. Additionally, the scale efficiency of pilot cities has been observed to increase by approximately 12.26%, indicating that the comprehensive medical reform policy can improve the scale efficiency. The difference-in-differences variable of Model (4) is positively significant at the significance level of 10%, indicating that the comprehensive medical reform policy can significantly improve the scale efficiency of urban employee’s medical and health financial expenditure. Based on the above results, it can be seen that under the comprehensive medical reform policy, although the significance of the policy gradually decreases with time, it can still play a certain significant role and has certain effectiveness.
 |
Table 7 Difference-in-Differences Regression Results |
Parallel Trend Analysis
The dynamic DID method is used to test the parallel trend. First of all, let variable current=1 in the year of implementation of the comprehensive health care reform policy (2012), and the variables in other years be 0. Then, the variables in the year before the implementation of the policy are expressed as before=1, and the variables in other years are 0; The variables of the 2 years before the implementation of the policy are expressed as before=2, and the variables in other years are 0; The variables of the 3 years before the implementation of the policy are expressed as before=3, and the variables in other years are 0; The variables of one year after the implementation of the policy are expressed as after=1, the variables of two years after the implementation is expressed as after=2, and the variables of other years are 0. If the before coefficients are not significant, and at least one item of the current and after coefficients are significant, it means that the parallel trend test has been passed.
Adopting the above methods to test the parallel trend of hospitals in 7 pilot cities and 34 non-pilot cities, the results are shown in Figure 3. In the analysis, the dashed line represents the parallel trend diagram of the comprehensive technical efficiency of urban medical and health financial expenditure. This diagram is obtained by applying the fixed effect model with control variables added and after variance correction. On the other hand, the solid line represents the parallel trend diagram of the scale efficiency of urban medical and health financial expenditure. This diagram is also obtained by applying the fixed effect model with control variables added and after variance correction. It can be seen from the figure that there is no statistically significant difference in the comprehensive efficiency and scale efficiency of employee’s medical and health financial expenditure between hospitals in pilot cities and hospitals in non-pilot cities in the first three years (2009–2011) before the implementation of comprehensive medical reform policy, while the comprehensive efficiency and scale efficiency are significantly improved in the third year after the implementation of comprehensive medical reform policy. However, three years later, it returned to the level before the implementation of the policy, indicating that the duration of the policy effect is short, so the sustainability of the comprehensive medical reform policy needs to be improved.
 |
Figure 3 Parallel trend diagram of comprehensive technical efficiency and scale efficiency of urban medical and health financial expenditure. |
Flow Diagram
The proposed analysis method for evaluating the resource allocation efficiency of urban medical and health financial expenditure based on difference-in-differences can be summarized by the following flow diagram (see Figure 4):
- Select efficiency values: The indicators selected to assess the efficiency of resource allocation for urban medical and health financial expenditure include comprehensive technical efficiency, pure technical efficiency, and scale efficiency values.
- Calculate efficiency values: Utilize the DEA (Data Envelopment Analysis) algorithm to compute the efficiency values based on the selected indicators.
- Gather relevant data: Collect necessary data for the analysis, including variables such as urbanization, natural population growth rate, population density logarithm, industrial structure, and economic development level. These factors are important for assessing the impact of resource allocation efficiency.
- Analyze with regression and DID models: Employ regression analysis and Difference-in-Differences (DID) models to examine the impact effect, robustness, and parallel trend of the policy. These models allow for a comparison of the outcomes between a treatment group (subject to the policy) and a control group (not subject to the policy) over time.
- Analyze results: Evaluate the results obtained from the regression and DID models to determine the impact of the comprehensive healthcare reform plan on the resource allocation efficiency of urban medical and health financial expenditure. This analysis will reveal the effectiveness of the reform plan.
- Evaluate method effectiveness: Assess the effectiveness of the proposed analysis method by examining the significance of the positive effect on the time trend. This indicates the long-term effectiveness of the comprehensive healthcare reform plan in improving resource allocation efficiency.
- Draw conclusions: Conclude that the comprehensive medical reform method exhibits particular effectiveness in enhancing the resource allocation efficiency of urban medical and health financial expenditure, based on the evaluation of the analysis results.
 |
Figure 4 Proposed analysis method-Flow Chart. |
Summary Table of the Major Findings in All Levels of Efficiency
Table 8 summarizes the major findings of the analysis in terms of the three different efficiency levels. The implementation of the comprehensive health care reform plan had a positive impact on the comprehensive technical and scale efficiency of urban medical and health financial expenditure but did not significantly improve pure technical efficiency. These findings suggest that the reform plan was effective in improving the overall resource allocation efficiency of urban medical and health financial expenditure, but there is still room for improvement in terms of technical efficiency.
 |
Table 8 Major Findings |
Discussion
The study proposed a method based on difference-in-differences (DID) to examine the resource allocation efficiency of medical and health financial expenditure to better guarantee enterprise employees’ health level. The authors employed the Data Envelopment Analysis (DEA) method to quantify the resource allocation efficiency values of urban medical and health financial expenditure, specifically measuring the comprehensive technology, pure technology, and scale efficiency. The study results demonstrate that the proposed method effectively evaluates and analyzes the impact of comprehensive medical reform on the resource allocation efficiency of urban medical and health financial expenditure. The comprehensive medical reform was found to improve the comprehensive efficiency and scale efficiency of urban medical and health financial expenditure, leading to enhanced resource allocation efficiency for urban employees’ medical and health financial expenditure. Previous study finding is a significant positive effect on the time trend, indicating that comprehensive medical reform has a long-term impact and effectiveness. This suggests that sustained efforts towards medical reform can continue to improve the resource allocation efficiency of medical and health financial expenditure over time, benefiting the health of enterprise employees in urban areas. The study’s findings have several implications for policymakers and healthcare practitioners. By adopting the proposed method, policymakers can gain valuable insights into medical and health financial expenditure resource allocation efficiency. This can inform evidence-based decision-making processes and help identify areas where improvements can be made to allocate resources better and guarantee enterprise employees’ health. The study also highlights the effectiveness of comprehensive medical reform to improve resource allocation efficiency. Policymakers can consider implementing comprehensive medical reforms that address various aspects of healthcare delivery, including technology, pure efficiency, and scale efficiency. By doing so, they can create a more efficient healthcare system that optimally utilizes available resources and provides better healthcare outcomes for employees in urban areas. While the study primarily focused on resource allocation efficiency, future research can be conducted to evaluate the impact of medical reform on other important aspects of healthcare, such as quality and accessibility. By considering additional dimensions of healthcare performance, policymakers can gain a more comprehensive understanding of the effects of medical reform and make informed decisions to improve the overall healthcare system further.
Moreover, the proposed method based on difference-in-differences and DEA provides a valuable approach to evaluating the resource allocation efficiency of medical and health financial expenditure. The study’s findings suggest that comprehensive medical reform can effectively enhance resource allocation efficiency, improving urban employees’ health outcomes. By continuing to invest in medical reform and considering additional dimensions of healthcare performance, policymakers can further optimize resource allocation and ensure the well-being of enterprise employees in urban areas.
In recent years, significant initiatives have focused on achieving Universal Health Coverage (UHC) in low and middle-income countries (LMICs).29 These initiatives aim to provide equitable access to essential healthcare services and financial protection to all individuals and communities, regardless of socioeconomic status. The experiences and lessons learned from these UHC initiatives in LMICs can offer valuable insights and generic messages applicable globally. In conclusion, recent UHC initiatives in LMICs provide valuable lessons and generic messages for the global health community. Promoting generic medicines as a cost-effective solution to improve access to essential medications can benefit healthcare systems worldwide. Additionally, prioritizing community engagement in health can enhance healthcare services’ effectiveness, equity, and sustainability. By sharing experiences and best practices from LMICs, policymakers and healthcare practitioners can collaborate to build more inclusive, affordable, and people-centred healthcare systems globally.30
Conclusion
To sum up, the proposed analysis method of resource allocation efficiency of urban medical and health financial expenditure based on difference-in-differences selects comprehensive technical efficiency value, pure technical efficiency value and scale efficiency value as the resource allocation efficiency value of urban medical and health financial expenditure, and uses DEA algorithm to calculate. Then, based on the regression model and DID model, it analyzes the impact effect, robustness and parallel trend of the policy, which realizes the analysis of the resource allocation efficiency of urban employee’s medical and health financial expenditure. Analysis results show that after the implementation of a comprehensive health care reform plan and the evaluation of health consumers, the comprehensive efficiency and scale efficiency of urban medical and health financial expenditure are effectively improved, thus the resource allocation efficiency of urban medical and health financial expenditure is improved. As can be seen, the proposed method has a significant positive effect on the time trend, which can play a role in a long time range. Therefore, the comprehensive medical reform method has a certain effectiveness.
Ethical Statement
This research was approved by the Research Committee of Shandong University, Jinan, China in accordance with the inter-national ethical standards, Helsinki Declaration 1964 and its amendments.
Informed Consent
Informed consent was obtained from all individual adult participants included in the study.
Disclosure
The authors declare that they have no conflicts of interest in this work.
References
1. Li Q, Wei J, Jiang F, et al. Equity and efficiency of health care resource allocation in Jiangsu Province, China. Int J Equity Health. 2020;19:1–13. doi:10.1186/s12939-020-01320-2
2. Chu A, Kwon S, Cowley P. Health financing reforms for moving towards universal health coverage in the western pacific region. Health Systems Reform. 2019;5(1):32–47. doi:10.1080/23288604.2018.1544029
3. Tang S, Meng Q, Chen L, Bekedam H, Evans T, Whitehead M. Tackling the challenges to health equity in China. Lancet. 2008;372(9648):1493–1501. doi:10.1016/S0140-6736(08)61364-1
4. Zeng Z, Tao W, Ding S, et al. Horizontal Integration and Financing Reform of Rural Primary Care in China: a Model for Low-Resource and Remote Settings. Int J Environ Res Public Health. 2022;19(14):8356. doi:10.3390/ijerph19148356
5. Hu L, Fu M, Wushouer H, et al. The impact of Sanming healthcare reform on antibiotic appropriate use in County hospitals in China. Front Public Health. 2022;10:56.
6. Wang G, Han M, Chen L, Song S, Shi D. The First City in Shandong Province to Build a” National Comprehensive Reform Pilot Zone for Traditional Chinese Medicine”, An Empirical Study on the Development of Traditional Chinese Medicine with Medical Insurance Reform as the Center in Weihai. Int J Soc Sci Educ Res. 2022;5(7):496–501.
7. Feng J, Gong Y, Li H, et al. Development trend of primary healthcare after health reform in China: a longitudinal observational study. BMJ open. 2022;12(6):e052239. doi:10.1136/bmjopen-2021-052239
8. J-w L, Jin F. An Empirical Study on the Inequality in Health and Healthcare in China’s Medical Reform. J Environ Public Health. 2022;2022. doi:10.1155/2022/5789118
9. Hu X, Wang P. Has China’s healthcare reform reduced the number of patients in large general hospitals? Int J Environ Res Public Health. 2022;19(9):5428. doi:10.3390/ijerph19095428
10. Moallef S, Dale L, Homayra F, et al. Suboptimal nonmedical qualities of primary care linked with care avoidance among people who use drugs in a Canadian setting amid an integrated health care reform. J Subst Abuse Treat. 2022;139:108784. doi:10.1016/j.jsat.2022.108784
11. Paterlini M. Warnings over doctor shortages amid Italian health reforms. Lancet. 2022;399(10341):2093. doi:10.1016/S0140-6736(22)01009-1
12. Knopf A. DEA issues a revised manual for OTPs incorporating new concepts. Alcoholism Drug Abuse Weekly. 2022;34(29):1–4.
13. Knopf A. First methadone van approved under new DEA rules. Alcoholism Drug Abuse Weekly. 2022;34(29):5–6.
14. Chu J, Li X, Yuan Z. Emergency medical resource allocation among hospitals with non-regressive production technology: a DEA-based approach. Comput Ind Eng. 2022;171:108491. doi:10.1016/j.cie.2022.108491
15. Yan Z, Zhou W, Wang Y, Chen X. Comprehensive Analysis of Grain Production Based on Three-Stage Super-SBM DEA and Machine Learning in Hexi Corridor, China. Sustainability. 2022;14(14):8881. doi:10.3390/su14148881
16. Shero JA, Al Otaiba S, Schatschneider C, Hart SA. Data envelopment analysis (DEA) in the educational sciences. J Exp Educ. 2022;90(4):1021–1040. doi:10.1080/00220973.2021.1906198
17. Yang J, Li X, Mei J, Chen L. Application of Three-Stage DEA Model Combined with BP Neural Network in Microfinancial Efficiency Evaluation. Comput Intell Neurosci. 2022;2022:64.
18. Clarke CS, Melnychuk M, Ramsay AI, et al. Cost-utility analysis of major system change in specialist cancer surgery in London, England, using linked patient-level electronic health records and difference-in-differences analysis. Appl Health Econ Health Policy. 2022;20(6):905–917. doi:10.1007/s40258-022-00745-w
19. Schochet PZ. Statistical power for estimating treatment effects using difference-in-differences and comparative interrupted time series estimators with variation in treatment timing. J Educ Behav Statistics. 2022;47(4):367–405. doi:10.3102/10769986211070625
20. Liu H, Wang C, Zhang M, Wang S. Evaluating the effects of air pollution control policies in China using a difference-in-differences approach. Sci Total Environ. 2022;845:157333. doi:10.1016/j.scitotenv.2022.157333
21. Sternberg A, Fauser D, Banaschak H, Zollmann P, Streibelt M, Bethge M. Utilization Of Cardiac Rehabilitation During the SARS-CoV-2 Pandemic In Germany: a Difference-In-differences Analysis. J Cardiopulm Rehabil Prev. 2022;42(4):287–289. doi:10.1097/HCR.0000000000000704
22. Lee W, Carlson J, Basu A, Veenstra D. SA22 The Impact of Older Adult-Specific Clinical Trials on Prescription Patterns Among Older Adults: a Difference-in-Differences Analysis. Value Health. 2022;25(7):S608. doi:10.1016/j.jval.2022.04.1688
23. Fardousi N, Nunes da Silva E, Kovacs R, et al. Performance bonuses and the quality of primary health care delivered by family health teams in Brazil: a difference-in-differences analysis. PLoS Med. 2022;19(7):e1004033. doi:10.1371/journal.pmed.1004033
24. Tan R, Liu P, Zhou K, He Q. Evaluating the effectiveness of development-limiting boundary control policy: spatial difference-in-difference analysis. Land Use Policy. 2022;120:106229. doi:10.1016/j.landusepol.2022.106229
25. Zhu H, Chen Z, Zhang S, Zhao W. The role of government innovation support in the process of urban green sustainable development: a spatial difference-in-difference analysis based on China’s innovative city pilot policy. Int J Environ Res Public Health. 2022;19(13):7860. doi:10.3390/ijerph19137860
26. Ye Z, Jiang Y. the impact of a pilot integrated care model on the quality and costs of inpatient care among Chinese elderly: a difference-in-difference analysis of repeated cross-sectional data. Cost Effectiveness Resource Allocation. 2022;20(1):28. doi:10.1186/s12962-022-00361-4
27. Cunha AM, Lobão J. The effects of tourism on housing prices: applying a difference-in-differences methodology to the Portuguese market. Int J Housing Markets Analysis. 2022;15(4):762–779. doi:10.1108/IJHMA-04-2021-0047
28. Chan MK, Kwok SS. The PCDID approach: difference-in-differences when trends are potentially unparallel and stochastic. J Bus Econ Stat. 2022;40(3):1216–1233. doi:10.1080/07350015.2021.1914636
29. Lahariya C. ‘Ayushman Bharat’program and universal health coverage in India. Indian Pediatr. 2018;55(6):495–506. doi:10.1007/s13312-018-1341-1
30. Lahariya C. Health & wellness centers to strengthen primary health care in India: concept, progress and ways forward. Indian J Pediatrics. 2020;87(11):916–929. doi:10.1007/s12098-020-03359-z
 © 2023 The Author(s). This work is published and licensed by Dove Medical Press Limited. The full terms of this license are available at https://www.dovepress.com/terms.php and incorporate the Creative Commons Attribution - Non Commercial (unported, v3.0) License.
By accessing the work you hereby accept the Terms. Non-commercial uses of the work are permitted without any further permission from Dove Medical Press Limited, provided the work is properly attributed. For permission for commercial use of this work, please see paragraphs 4.2 and 5 of our Terms.
© 2023 The Author(s). This work is published and licensed by Dove Medical Press Limited. The full terms of this license are available at https://www.dovepress.com/terms.php and incorporate the Creative Commons Attribution - Non Commercial (unported, v3.0) License.
By accessing the work you hereby accept the Terms. Non-commercial uses of the work are permitted without any further permission from Dove Medical Press Limited, provided the work is properly attributed. For permission for commercial use of this work, please see paragraphs 4.2 and 5 of our Terms.