Back to Journals » Advances in Medical Education and Practice » Volume 6
Residency program characteristics that are associated with pass rate of the American Board of Pediatrics certifying exam
Authors Atsawarungruangkit A
Received 6 June 2015
Accepted for publication 9 July 2015
Published 14 August 2015 Volume 2015:6 Pages 517—524
DOI https://doi.org/10.2147/AMEP.S90022
Checked for plagiarism Yes
Review by Single anonymous peer review
Peer reviewer comments 3
Editor who approved publication: Dr Md Anwarul Azim Majumder
Amporn Atsawarungruangkit
Department of Family Medicine, Rajavithi Hospital, Bangkok, Thailand
Background: The US is home to almost 200 pediatrics residency programs; despite this, there is little information about the relationship between program characteristics and performance in the American Board of Pediatrics (ABP) certifying exam.
Objective: To evaluate the relationship between pass rate of the ABP certifying exam with the characteristics of categorical pediatrics residency programs.
Methods: This retrospective, cross-sectional study used publicly available data from the ABP website and the Fellowship and Residency Electronic Interactive Database. All programs that reported pass rates were included. The analysis, comprising univariate and multivariate linear regression, involved determining how 69 factors (eg, general information, number of faculty and trainees, work schedule, educational environment) related to the pass rate.
Results: Of 199 programs, 194 reported pass rates. The univariate analysis revealed 20 program characteristics with P-values <0.10. However, in the multivariate analysis, pass rate was significantly associated with only three program characteristics: ratio of full-time equivalent paid faculty to positions, percentage of US medical graduates, and average hours per week of regularly scheduled lectures or conferences.
Conclusion: Unlike in previous studies, location and program size were not significantly associated with the pass rate in this multivariate analysis. The finding regarding the ratio of full-time equivalent paid faculty to positions highlighted the benefits of a well-supervised training environment, while that regarding the percentage of US medical graduates indicated the necessity of high competition in residency programs. Finally, longer hours per week of regularly scheduled lectures or conferences were associated with better academic outcomes, both statistically and intuitively.
Keywords: ABP, pediatrics residency, multivariate analysis, FREIDA
Introduction
In the US, pediatrics residency programs are the third largest medical specialty in terms of the number of residency positions; in 2015 alone, there were 3,936 applicants for 2,668 pediatrics residency program positions.1 Before being able to practice as a pediatrician, a physician must pass the American Board of Pediatrics (ABP) certifying exam. In the US, between 2012 and 2014, the average pass rate for first-time takers of the ABP certifying exam was 86.74%.2 While this rate is relatively high, those who fail the exam can only retake it a year later. Additionally, the Accreditation Council for Graduate Medical Education (ACGME) requires pediatrics residency programs to achieve a 70% pass rate for first-time takers. Thus, failing the board certifying exam has a considerable negative impact on the track records for residency programs.3
The majority of observational studies in various medical specialties have shown that board certification is associated with quality of care.4–7 Thus, finding ways to improve the pass rate of the board certifying exam could boost the reputations of residency programs as well as improve patient outcomes at training centers. Unfortunately, there is limited information on what program characteristics best influence the pass rate of the ABP certifying exam. Previous investigations on this topic showed that program location and size, United States Medical Licensing Examination (USMLE) Step 1 scores, city population, and whether the program was a dual internal medicine–pediatrics program were significantly related to the pass rate.8–11 Performance on in-training examinations was not significantly related.12 Similar results were found in a study of factors affecting the pass rates of the American Board of Family Medicine certifying exam, in which the significantly related factors were program location and size, accreditation cycle length, opportunities for international experiences, and training in alternative medicine.13
The current study aimed to evaluate the relationships between the pass rate of the ABP certifying exam and the characteristics of 3-year categorical pediatrics residency programs. A better understanding of these relationships will benefit various parties, including program directors, who will be able to improve the educational quality of pediatrics residency training; residency candidates, who will be able to make a better career decisions; and patients, who will obtain a higher quality of care from better trained pediatricians.
Methods
Using a retrospective, cross-sectional design, this study evaluated the relationships between the pass rate of the ABP certifying exam and most of the program characteristics available in the Fellowship and Residency Electronic Interactive Database (FREIDA®). This study covered all 3-year categorical pediatrics residency programs in the US, including the US territory of Puerto Rico. The program characteristics of these categorical pediatrics residency programs were extracted from FREIDA® on May 9, 2015, using a computerized automation program; there were 69 such characteristics in total. The 2012–2014 pass rates of the ABP certifying exam, which were the most recent rates at the time of study, were obtained from the ABP website.2 The only exclusion criterion for residency programs was not reporting the pass rate.
Of the 69 characteristics, six dealt with location and general information, six with the number of faculty and trainees, six with work schedule, three with the educational environment, 17 with educational benefits, seven with educational features, five with resident evaluation, four with program evaluation, 13 with employment policies and benefits, and two with compensation and leave. The majority of these variables were dichotomous, while the rest were either continuous or categorical.
Regarding location, the pediatrics residency programs were grouped by the ten regions reported in FREIDA® (Table 1). Program size was calculated using the average number of residency positions from postgraduate years 1–3. Two types of exam scores are commonly used as requirements for interviews: the USMLE and the Comprehensive Osteopathic Medical Licensing Examination of the United States. However, because the majority of residency programs used only USMLE scores as a requirement for inviting candidates for interviews, only USMLE score requirements were included as a characteristic in the analysis for this study. I did not consider the number of faculty members in each program, because a more meaningful measure, the ratio of full-time equivalent paid faculty to positions (faculty-to-position ratio), was available. Other non meaningful or hard-to-quantify characteristics (eg, visa status of international medical graduates, major medical benefits, sick days, call schedules, and average score requirement) were similarly excluded.
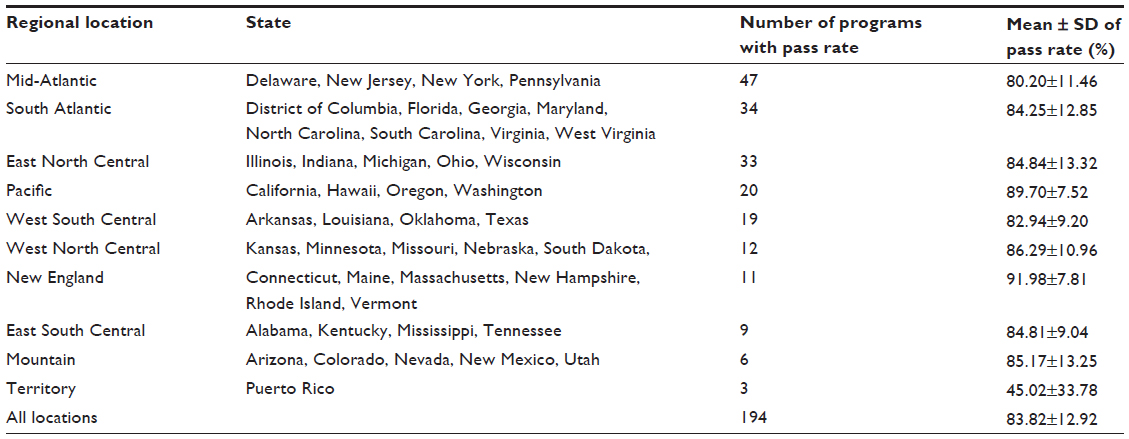 | Table 1 Regional locations of pediatrics residency programs |
All statistical analyses were conducted with STATA version 13.0 (StataCorp, College Station, TX, USA). All categorical variables were dichotomized for the purposes of statistical analyses.
The main assumption of this study was that the data would form a normal distribution at the population level. As such, data were presented in terms of mean ± SD for continuous variables, and number (%) for dichotomous variables. In the univariate analysis, the relationships between pass rate and all program characteristics were identified by univariate linear regression. Only characteristics with P-values <0.10 in the univariate analysis were entered into the multivariate linear regression analysis, which was intended to identify the significant independent predictors of the ABP exam pass rate. In the multivariate analysis, the significance level a was set at 0.05. Being a retrospective and nonhuman study, this study was exempted from institutional review board (Rajavithi Hospital, Bangkok, Thailand) approval.
Results
According to a FREIDA® search, at the time of study, there were 199, 3-year categorical pediatrics residency programs throughout the US. Five of these programs were excluded because they did not report the ABP exam pass rate; thus, 194 programs were included in the analysis. The baseline characteristics of all programs are summarized and presented in Table 2. As shown in Tables 1 and 3, the average pass rate of the ABP certifying exam for the entire US was 83.82±12.92. By region, New England programs had the highest average pass rate (91.98±7.81; P=0.031), while programs in Puerto Rico had the lowest average (45.02±33.78; P<0.001).
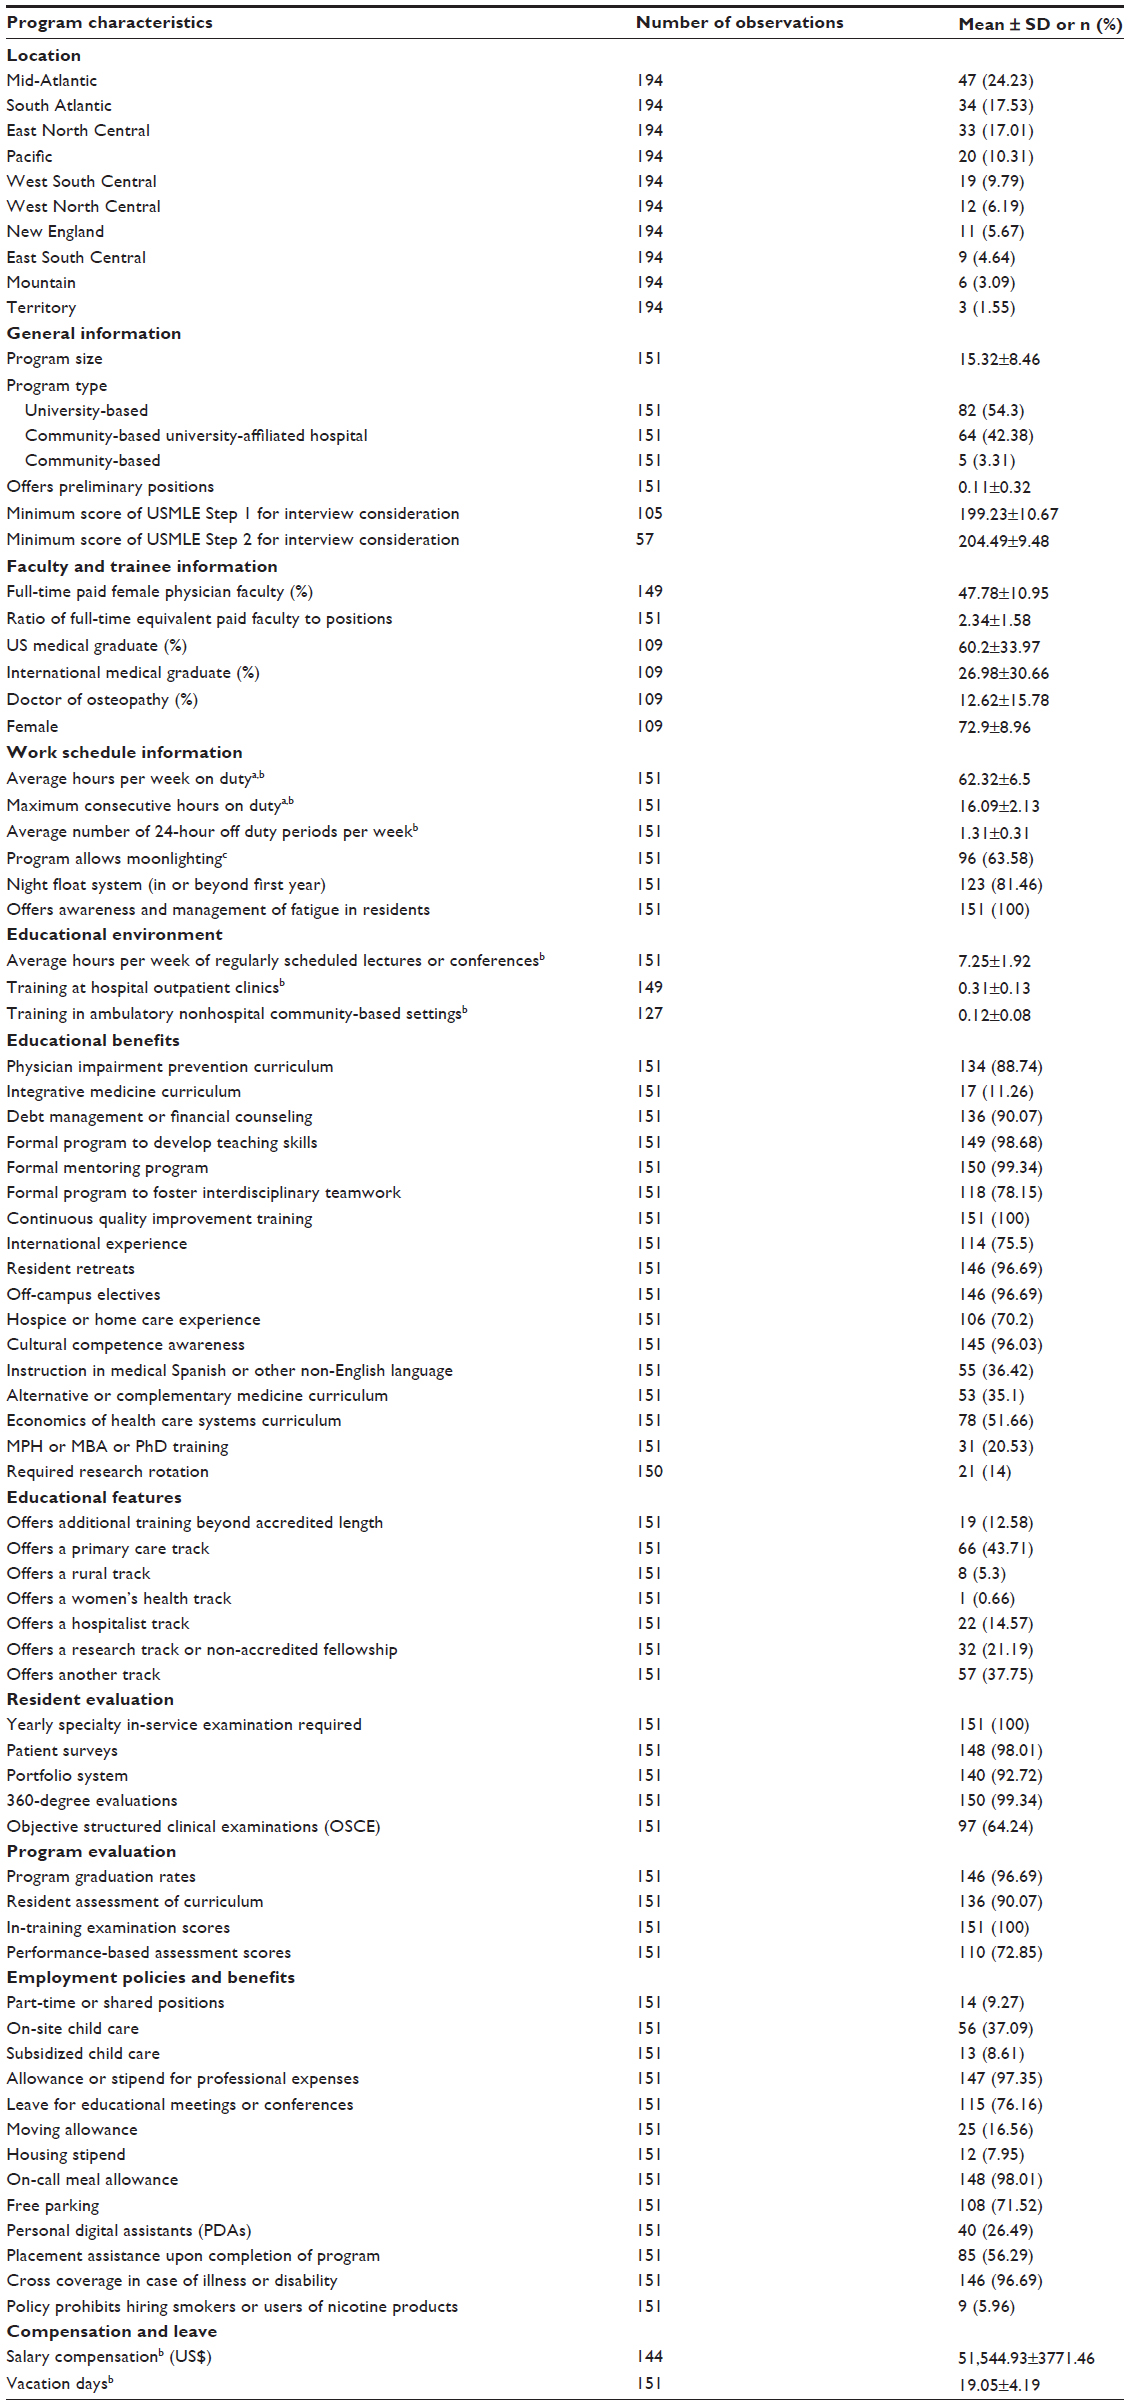 | Table 2 Baseline characteristics of pediatrics residency programs |
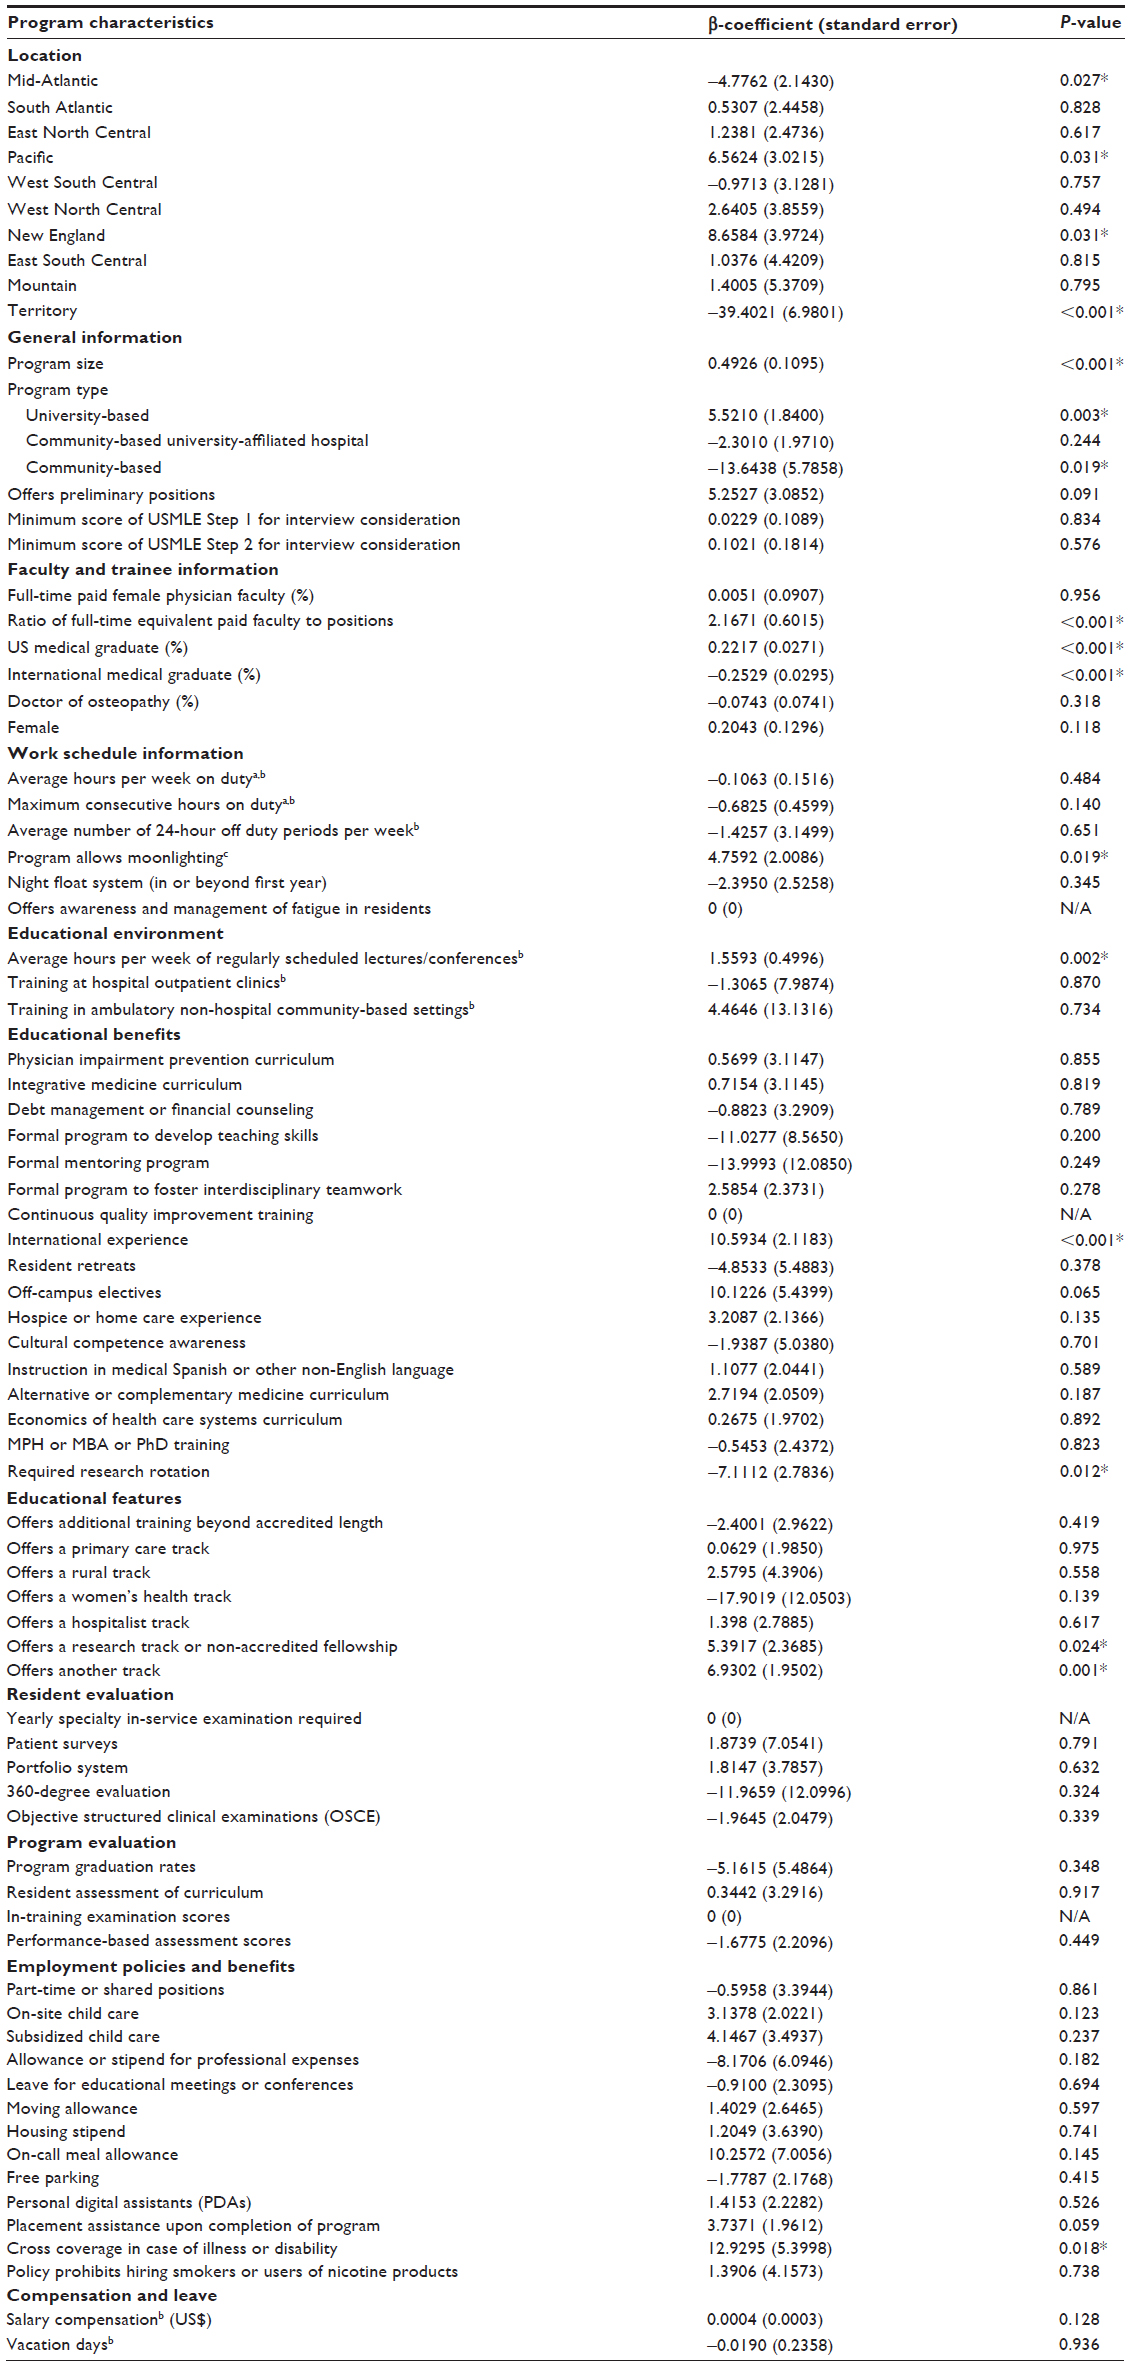 | Table 3 Results of the univariate linear regression analysis between the pass rate and pediatrics program characteristics |
The univariate linear regression was performed to identify program characteristics with P<0.10. As shown in Table 3, there were 20 variables with P<0.10, including location (Mid-Atlantic [β=−4.7762, P=0.027], Pacific [β=6.5624, P=0.031], New England [β=8.6584, P=0.031], and US territory [β=−39.4021, P<0.001]); program size (β=0.4926, P<0.001); program type (university-based [β=5.5210, P=0.003] and community-based [β=−13.6438, P=0.019]); faculty-to-position ratio (β=2.1671, P<0.001); percentage of US medical graduates ([%USMD], β=0.2217, P<0.001); percentage of international medical graduates (β=–0.2529, P<0.001); work schedule allowing moonlighting (β=4.7592, P=0.019); average hours per week (hr/wk) of regularly scheduled lectures or conferences ([average hr/wk of lectures] β=1.5393, P=0.002); offering international experience (β=10.5934, P<0.001); required research rotation (β=–7.1112, P=0.012); offering a research track or non-accredited fellowship (β=5.3917, P=0.024); offering another track (β=6.9302, P=0.001); and cross coverage in case of illness or disability (β=12.9295, P=0.018).
Table 4 shows the multivariate analysis. Of the 20 variables included, only three were significant independent predictors: faculty-to-position ratio (β=1.3919, P=0.008); %USMD (β=0.2054, P<0.001); and average hr/wk of lectures (β=1.1987, P=0.008). Altogether, these three predictors explained 44.83% of the variance in pass rate.
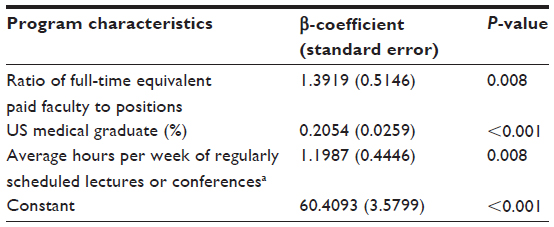 | Table 4 Multivariate linear regression of the ABP pass rate and significantly associated program characteristics |
Discussion
In most past studies, program size was significantly associated with the board pass rates of many specialties, pediatrics included;11,13–15 this was similarly found in the univariate analysis of the current study. However, the multivariate analysis revealed that faculty-to-position ratio, and not program size, was a significant independent predictor. Given that the inverse of faculty-to-position ratio is the number of resident positions per faculty member, meaning that it relates to program size, it is possible that program size is just a confounding factor. Furthermore, until now, there has been no information on how faculty-to-position ratio relates to the pass rate of the ABP certifying exam, although this same relationship was recently found for internal medicine residencies.16 Thus, as long as residency programs have a sufficient faculty-to-position ratio, their sizes should not matter. Conversely, increasing the size of program without increasing the number of faculties may have a negative effect on pass rate.
The finding that %USMD was a significant predictor of ABP exam pass rate is unsurprising. In the past, a study on board pass rates in general surgery found that highly competitive residency programs are more likely to attract similarly competitive residents.17 Moreover, competitive medical specialties usually have higher matching rates among US senior medical students from Doctor of Medicine programs,1 which implies that such programs should have higher percentages of these students. Therefore, it follows that programs with a high %USMD will have more competitive residents with a stronger drive to pass the board exams, thus increasing the pass rate.
The last significant predictor in the multivariate model was average hr/wk of lectures. As shown in Table 2, the average hr/wk of lectures had a mean of 7.25 hr/wk and an SD of 1.92. Although one might infer from the SD that the differences among the programs were rather small, 1.92 hr/wk is still equivalent to 99.84 hours per year or 299.52 hours every 3 years. In other words, increasing 1 hr/wk of lecturing time is equivalent to 52 hours per year. This accords with the findings of a study of emergency medicine residents who were at-risk of failing, based on their in-training examination performances. The study found that individualized educational plans (eg, self-study audio review lectures) could improve these residents’ board pass rates.18 Thus, both statistically and intuitively, pass rates can be improved by increasing the amount of lectures or academic activities.
The vast majority of program characteristics were not independent predictors, including location, which was previously reported as significant predictor.11 These discrepancies could have arisen from different statistical methods, variable types of characteristics and pass rate, population samples, or assumptions. It is worth noting that the data from FREIDA® reported only the usage of in-training examination scores for evaluating the performance of residents, not the average scores in the program. For this reason, the current study could not measure the association between in-training examination scores and the pass rates. Specifically, I used multivariate linear regression, and treated board pass rate of residency programs as a continuous variable; other studies might have dichotomized the pass rate, used t-tests, or determined the correlations between individual pass rates and associated factors.
This study has several limitations. First, the data from FREIDA® and the ABP website were not immune to human errors by data reporters or gatherers. Second, no programs that opted out of reporting program characteristics to FREIDA® could be studied; whether programs opt out of reporting might be a predictor of pass rate. Third, I included only data on program characteristics collected at a single point in time, which does not allow me to infer whether these relationships change at different times. These limitations can be resolved by conducting further analyses with a larger dataset and with a longitudinal design. Furthermore, despite the limitations inherent to self-reported data, I believe the findings of this study can still be applied to most pediatrics residency programs in the US.
The results can also be used to improve pediatrics residency programs. First, programs should not focus on increasing program size, but rather on improving the level of supervision by balancing the faculty-to-position ratio. Second, programs should pay more attention to regular academic activities, such as lectures or conferences, as this would help pediatrics residents achieve better academic performance, thereby improving patients’ outcome.
Conclusion
Passing the ABP certifying exam relies on the competitiveness of individual residents and the quality of the training environment. In practice, these two factors are closely related. The fact that faculty-to-position ratio was a significant predictor highlights the benefits of a well-supervised training environment, whereas a higher %USMD indicates the necessity of greater competition in residency programs. Finally, a longer time spent on regular academic activities is associated with better academic outcomes, both statistically and intuitively.
Acknowledgment
This study would not have been completed without the help of Dr Kawee Numpacharoen, who helped write the computerized automation program for data extraction.
Disclosure
The author reports no conflicts of interest in this work.
References
National Resident Matching Program. Advance Data Tables: 2015 Main Residency Match. USA: National Resident Matching Program; 2015. Available from: http://www.nrmp.org/wp-content/uploads/2015/03/ADT2015_final.pdf. Accessed May 2, 2015. | |
American Board of Pediatrics. 2012–2014 Pediatric Training Program Pass Rates. USA: American Board of Pediatrics; 2014. Available from: http://www.abp.org/sites/abp/files/pdf/gp_training_program_pass_rates.pdf. Accessed May 10, 2015. | |
Accreditation Council for Graduate Medical Education. ACGME Program Requirements for Graduate Medical Education in Pediatrics. USA: Accreditation Council for Graduate Medical Education; 2012. Available from: http://www.acgme.org/acgmeweb/Portals/0/PFAssets/2013-PR-FAQ-PIF/320_pediatrics_07012013.pdf. Accessed May 10, 2015. | |
Chen J, Rathore SS, Wang Y, Radford MJ, Krumholz HM. Physician board certification and the care and outcomes of elderly patients with acute myocardial infarction. J Gen Intern Med. 2006;21(3):238–244. | |
Sharp LK, Bashook PG, Lipsky MS, Horowitz SD, Miller SH. Specialty board certification and clinical outcomes: the missing link. Acad Med. 2002;77(6):534–542. | |
Silber JH, Kennedy SK, Even-Shoshan O, et al. Anesthesiologist board certification and patient outcomes. Anesthesiology. 2002;96(5):1044–1052. | |
Sutherland K, Leatherman S. Does certification improve medical standards? BMJ. 2006;333(7565):439–441. | |
Falcone JL. City population size is associated with examinee outcomes on the American Board of Pediatrics Certifying Examination. Clin Pediatr (Phila). 2014;53(8):751–757. | |
McCaskill QE, Kirk JJ, Barata DM, Wludyka PS, Zenni EA, Chiu TT. USMLE step 1 scores as a significant predictor of future board passage in pediatrics. Ambul Pediatr. 2007;7(2):192– 195. | |
Falcone JL. Residencies with dual internal medicine and pediatrics programs outperform others on the American Board of Pediatrics certifying examination. Clin Pediatr (Phila). 2014;53(9):854–857. | |
Falcone JL. Compliance on the American Board of Pediatrics certifying examination and the importance of location and size on pass rates. Clin Pediatr (Phila). 2012;51(5):483–489. | |
Althouse LA, McGuinness GA. The in-training examination: an analysis of its predictive value on performance on the general pediatrics certification examination. J Pediatr. 2008;153(3):425–428. | |
Mims LD, Mainous AG 3rd, Chirina S, Carek PJ. Are specific residency program characteristics associated with the pass rate of graduates on the ABFM certification examination? Fam Med. 2014;46(5):360–368. | |
Falcone JL. Size might matter more than we thought: the importance of residency program size to pass rates on the American Board of Pediatrics Certifying Examination. Clin Pediatr (Phila). 2015;54(1):79–83. | |
Falcone JL, Middleton DB. Pass rates on the American Board of Family Medicine Certification Exam by residency location and size. J Am Board Fam Med. 2013;26(4):453–459. | |
Norcini JJ, Grosso LJ, Shea JA, Webster GD. The relationship between features of residency training and ABIM certifying examination performance. J Gen Intern Med. 1987;2(5):330–336. | |
Stain SC, Hiatt JR, Ata A, et al. Characteristics of highly ranked applicants to general surgery residency programs. JAMA Surg. 2013;148(5):413–417. | |
Visconti A, Gaeta T, Cabezon M, Briggs W, Pyle M. Focused Board Intervention (FBI): A Remediation Program for Written Board Preparation and the Medical Knowledge Core Competency. J Grad Med Educ. 2013;5(3):464–467. |
 © 2015 The Author(s). This work is published and licensed by Dove Medical Press Limited. The
full terms of this license are available at https://www.dovepress.com/terms
and incorporate the Creative Commons Attribution
- Non Commercial (unported, 3.0) License.
By accessing the work you hereby accept the Terms. Non-commercial uses of the work are permitted
without any further permission from Dove Medical Press Limited, provided the work is properly
attributed. For permission for commercial use of this work, please see paragraphs 4.2 and 5 of our Terms.
© 2015 The Author(s). This work is published and licensed by Dove Medical Press Limited. The
full terms of this license are available at https://www.dovepress.com/terms
and incorporate the Creative Commons Attribution
- Non Commercial (unported, 3.0) License.
By accessing the work you hereby accept the Terms. Non-commercial uses of the work are permitted
without any further permission from Dove Medical Press Limited, provided the work is properly
attributed. For permission for commercial use of this work, please see paragraphs 4.2 and 5 of our Terms.