Back to Journals » Clinical Epidemiology » Volume 11
Reporting net survival in populations: a sensitivity analysis in lung cancer demonstrates the differential implications of reporting relative survival and cause-specific survival
Authors Tan KS, Eguchi T, Adusumilli PS
Received 2 April 2019
Accepted for publication 25 July 2019
Published 2 September 2019 Volume 2019:11 Pages 781—792
DOI https://doi.org/10.2147/CLEP.S210894
Checked for plagiarism Yes
Review by Single anonymous peer review
Peer reviewer comments 2
Editor who approved publication: Professor Henrik Toft Sørensen
Kay See Tan,1 Takashi Eguchi,2 Prasad S Adusumilli2
1Department of Epidemiology and Biostatistics, Memorial Sloan Kettering Cancer Center, New York, NY 10017, USA; 2Department of Surgery, Memorial Sloan Kettering Cancer Center, New York, NY 10065, USA
Correspondence: Kay See Tan
Department of Epidemiology and Biostatistics, Memorial Sloan Kettering Cancer Center, 485 Lexington Avenue, New York, NY 10017, USA
Tel +1 646 888 8257
Email [email protected]
Background: Net survival is commonly quantified as relative survival (observed survival among lung cancer patients versus expected survival among the general population) and cause-specific survival (lung cancer–specific survival among lung cancer patients). These approaches have drastically different assumptions; hence, failure to distinguish between them results in significant implications for study findings. We quantified the differences between relative and cause-specific survival when reporting net survival of patients with non-small cell lung cancer (NSCLC).
Methods: Cases of NSCLC diagnosed between 2004 and 2014 were extracted from the Surveillance, Epidemiology, and End Results database. The net survival of each stage-by-age stratum was expressed as cause-specific survival (Kaplan-Meier approach) and relative survival (Ederer II approach); percentage-point (pp) differences between the survival estimates were quantified up to 10 years postdiagnosis.
Results: Analyses included 263,894 cases. Cause-specific survival estimates were higher than relative survival estimates across all strata. Although the differences were negligible at 1 year postdiagnosis, they increased with increasing years of follow-up, up to 9.3 pp at 10 years (eg, aged 60–74 with stage I disease: 53.0% vs 43.7%). Differences in survival estimates between the methods also increased by increasing age groups (eg, at 10 years postdiagnosis: 5.1 pp for ages 18–44, 8.8 pp for ages 45–59, and 9.3 pp for ages 60–74) but decreased drastically for those aged ≥75 (3.1 pp).
Conclusion: Relative survival and cause-specific survival are not interchangeable. The type of survival estimate used in cancer studies should be specified, particularly for long-term survival.
Keywords: biostatistics, cancer epidemiology, epidemiological methods, mortality, lung cancer
Introduction
Communication of long-term survival probabilities to patients diagnosed with lung cancer is crucial and challenging. Unfortunately, the seemingly simple concept of survival is complicated by the use of different terminologies and survival measures to address different questions.1,2 Additionally, reporting of survival estimates is often incomplete or incorrect. For example, the “Lung Cancer Fact Sheet,” published by the American Lung Association,3 states that 5-year survival is 5% for late-stage lung cancer. However, it is unclear whether this survival estimate was based on the relative or cause-specific approach. Furthermore, in a review examining variations in cancer survival across Europe,4 relative survival was reported as a proxy for cause-specific survival without assessment of resulting bias.
We differentiate between survival measures (net vs crude survival) and estimation frameworks (relative vs cause-specific approaches to estimate survival measures). When the object of interest is cancer deaths from lung cancer, net and crude survival are distinguished by the manner in which deaths from noncancer causes are considered. Net survival eliminates the impact from deaths from other causes and presents survival in a hypothetical world where lung cancer is the only cause of death. In contrast, crude survival accommodates deaths from other causes and presents cancer survival in the real world, where the patient may die of other causes.1,2
The focus of this paper is net survival. Historically, net survival was developed to address whether patients have been cured (ie, the expected survival of cancer patients has returned to the level of the general population).5 Net survival is independent of death from noncancer causes, an important feature to appropriately track cancer survival across time and compare cancer burden between populations and countries with different life expectancies.
In population-based cancer studies, net survival can be estimated using different approaches, broadly categorized as relative survival and cancer-specific survival. In principle, both approaches estimate the same concept of net survival. However, these two constructs have drastically different assumptions: cancer-specific survival centers on deaths attributable to cancer, whereas relative survival does not differentiate between causes of death and instead considers all-cause deaths that are in excess of the mortality that would be expected in the general population without cancer.6 With different estimators to determine net survival, confusion arises in the comparability of the estimates from each approach. It is crucial to fully understand the underlying constructs of each method and the subtleties of each resulting estimate.
Relative survival is the ratio of the overall survival among patients diagnosed with cancer and the expected survival in a matched general population (the excess mortality attributable to cancer):
“Matched general population” refers to a subset of the population with comparable characteristics (eg, sex and age) to the population of patients with lung cancer. Data for the derivation of observed survival and expected survival are generally extracted from cancer registries and state death files or national mortality registries. The main advantage of the relative survival approach is that it does not require information on cause of death, which is often difficult to obtain for every patient. However, the accuracy of the relative survival approach depends on how closely the composition of the general population matches the composition of the population of patients with lung cancer.
Cause-specific survival focuses on cancer-specific deaths and uses only the population of patients with lung cancer. Data for the calculation of cause-specific survival can be derived from institution-level cancer registries or population-based cancer registries. Unlike relative survival, cause-specific survival does not require population-level data; hence, it is not necessary to obtain mortality rates on the general population. However, credible cause-specific survival estimation assumes accurate cause-of-death classification.
As the methods are calculated differently, they provide different estimates of net survival probabilities. Howlander et al7 studied this topic in a range of cancer sites using a population-based cancer registry from the Surveillance, Epidemiology, and End Results (SEER) program.8 However, in their study, all subtypes of lung and bronchus diagnoses were presented as an aggregate group. In this study, we perform a comprehensive investigation specific to non-small cell lung cancer (NSCLC; by stage-and-age strata) and provide insights unique to the context of lung cancer. Through a series of sensitivity analyses, we herein quantify the extent of differences in net survival probability estimates when both relative and cause-specific survival methods are applied to the same registry data.
Methods
Study population
Cases of NSCLC were extracted from the SEER database issued in April 2017.8 SEER is a geographically-defined population-based cancer registry covering 34.6% of the US population. Patients diagnosed with NSCLC (no prior cancers and no second primaries) between 2004 and 2014 were selected for analysis. Histologic diagnoses were based on the morphologic codes from the International Classification of Diseases for Oncology (ICD-O-3).9 Histologic types of NSCLC (ICD-O-3 topography code: C34) included squamous cell carcinoma (8051–2, 8070–6, 8078, 8083–4, 8090, 8094, 8120, 8123), adenocarcinoma (8015, 8050, 8140–1, 8143–5, 8147, 8190, 8201, 8211, 8250–5, 8260, 8290, 8310, 8320, 8323, 8333, 8401, 8440, 8470–1, 8480–1, 8490, 8503, 8507, 8550, 8570–2, 8574, 8576), large cell carcinoma (8012–4, 8021, 8034, 8082), adenosquamous carcinoma (8560), and other/not otherwise specified NSCLC (8022, 8030, 8031, 8032, 8033, 8035, 8046, 8200, 8230, 8430, 8441, 8551, 8562, 8575). For each patient, year of diagnosis, stage (based on the sixth edition of the AJCC Cancer Staging Manual,10 applicable to diagnoses made in 2004 or later), histologic type, age, sex, surgery (yes/no), cause of death, and survival duration (from diagnosis to death or last follow-up) were recorded. The final cohort comprised patients with NSCLC who were aged ≥18 years at the time of diagnosis.
Statistical analysis
Patients were categorized into 16 strata on the basis of stage (I, II, III, and IV) and age (18–44, 45–59, 60–74, and ≥75 years) at diagnosis. The survival measure of interest was net survival, expressed as relative survival and cause-specific survival within each stratum. Both methods were applied to the same cohort to calculate survival estimates up to 10 years postdiagnosis. Cause-specific survival was calculated using the Kaplan-Meier approach from the time of diagnosis to the time of lung cancer–specific death (patients were censored otherwise). Deaths due to cancer were identified by the SEER cause-specific death classification variable.7,8 Relative survival was calculated by dividing all-cause survival among the lung cancer patients by the expected survival of the matched general population using the Ederer II approach.11 Expected survival was derived from life tables that matched the study population to the general population by sex, age, and calendar year of diagnosis. As a secondary assessment, the analyses were repeated in the subcohort of patients who underwent surgery. In all analyses, the differences between relative and cause-specific survival estimates at specific time points were quantified as percentage-points (pp).
A publicly available algorithm was adapted to estimate relative survival using SAS 9.4 (SAS Institute, Cary, NC, USA), incorporating the Ederer II approach.12,13 All other analyses were conducted using R 3.5.1 (R Core Team, Vienna, Austria), using the SEERaBomb package14 for data processing from the SEER database and the demography package15 to extract life tables of the general population from the National Center for Health Statistics (NCHS).16
Results
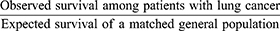
Table 1 reports the number of patients in each stage-and-age stratum. Analyses included 263,894 patients with stage I (20%), stage II (5%), stage III (26%), or stage IV (49%) NSCLC, of whom 77% were aged ≥60 years and 46% were women. Figure S1A–D presents the crude probabilities of death from cancer and noncancer causes; Figure S2A–D presents these data for the subset of patients who underwent surgery.
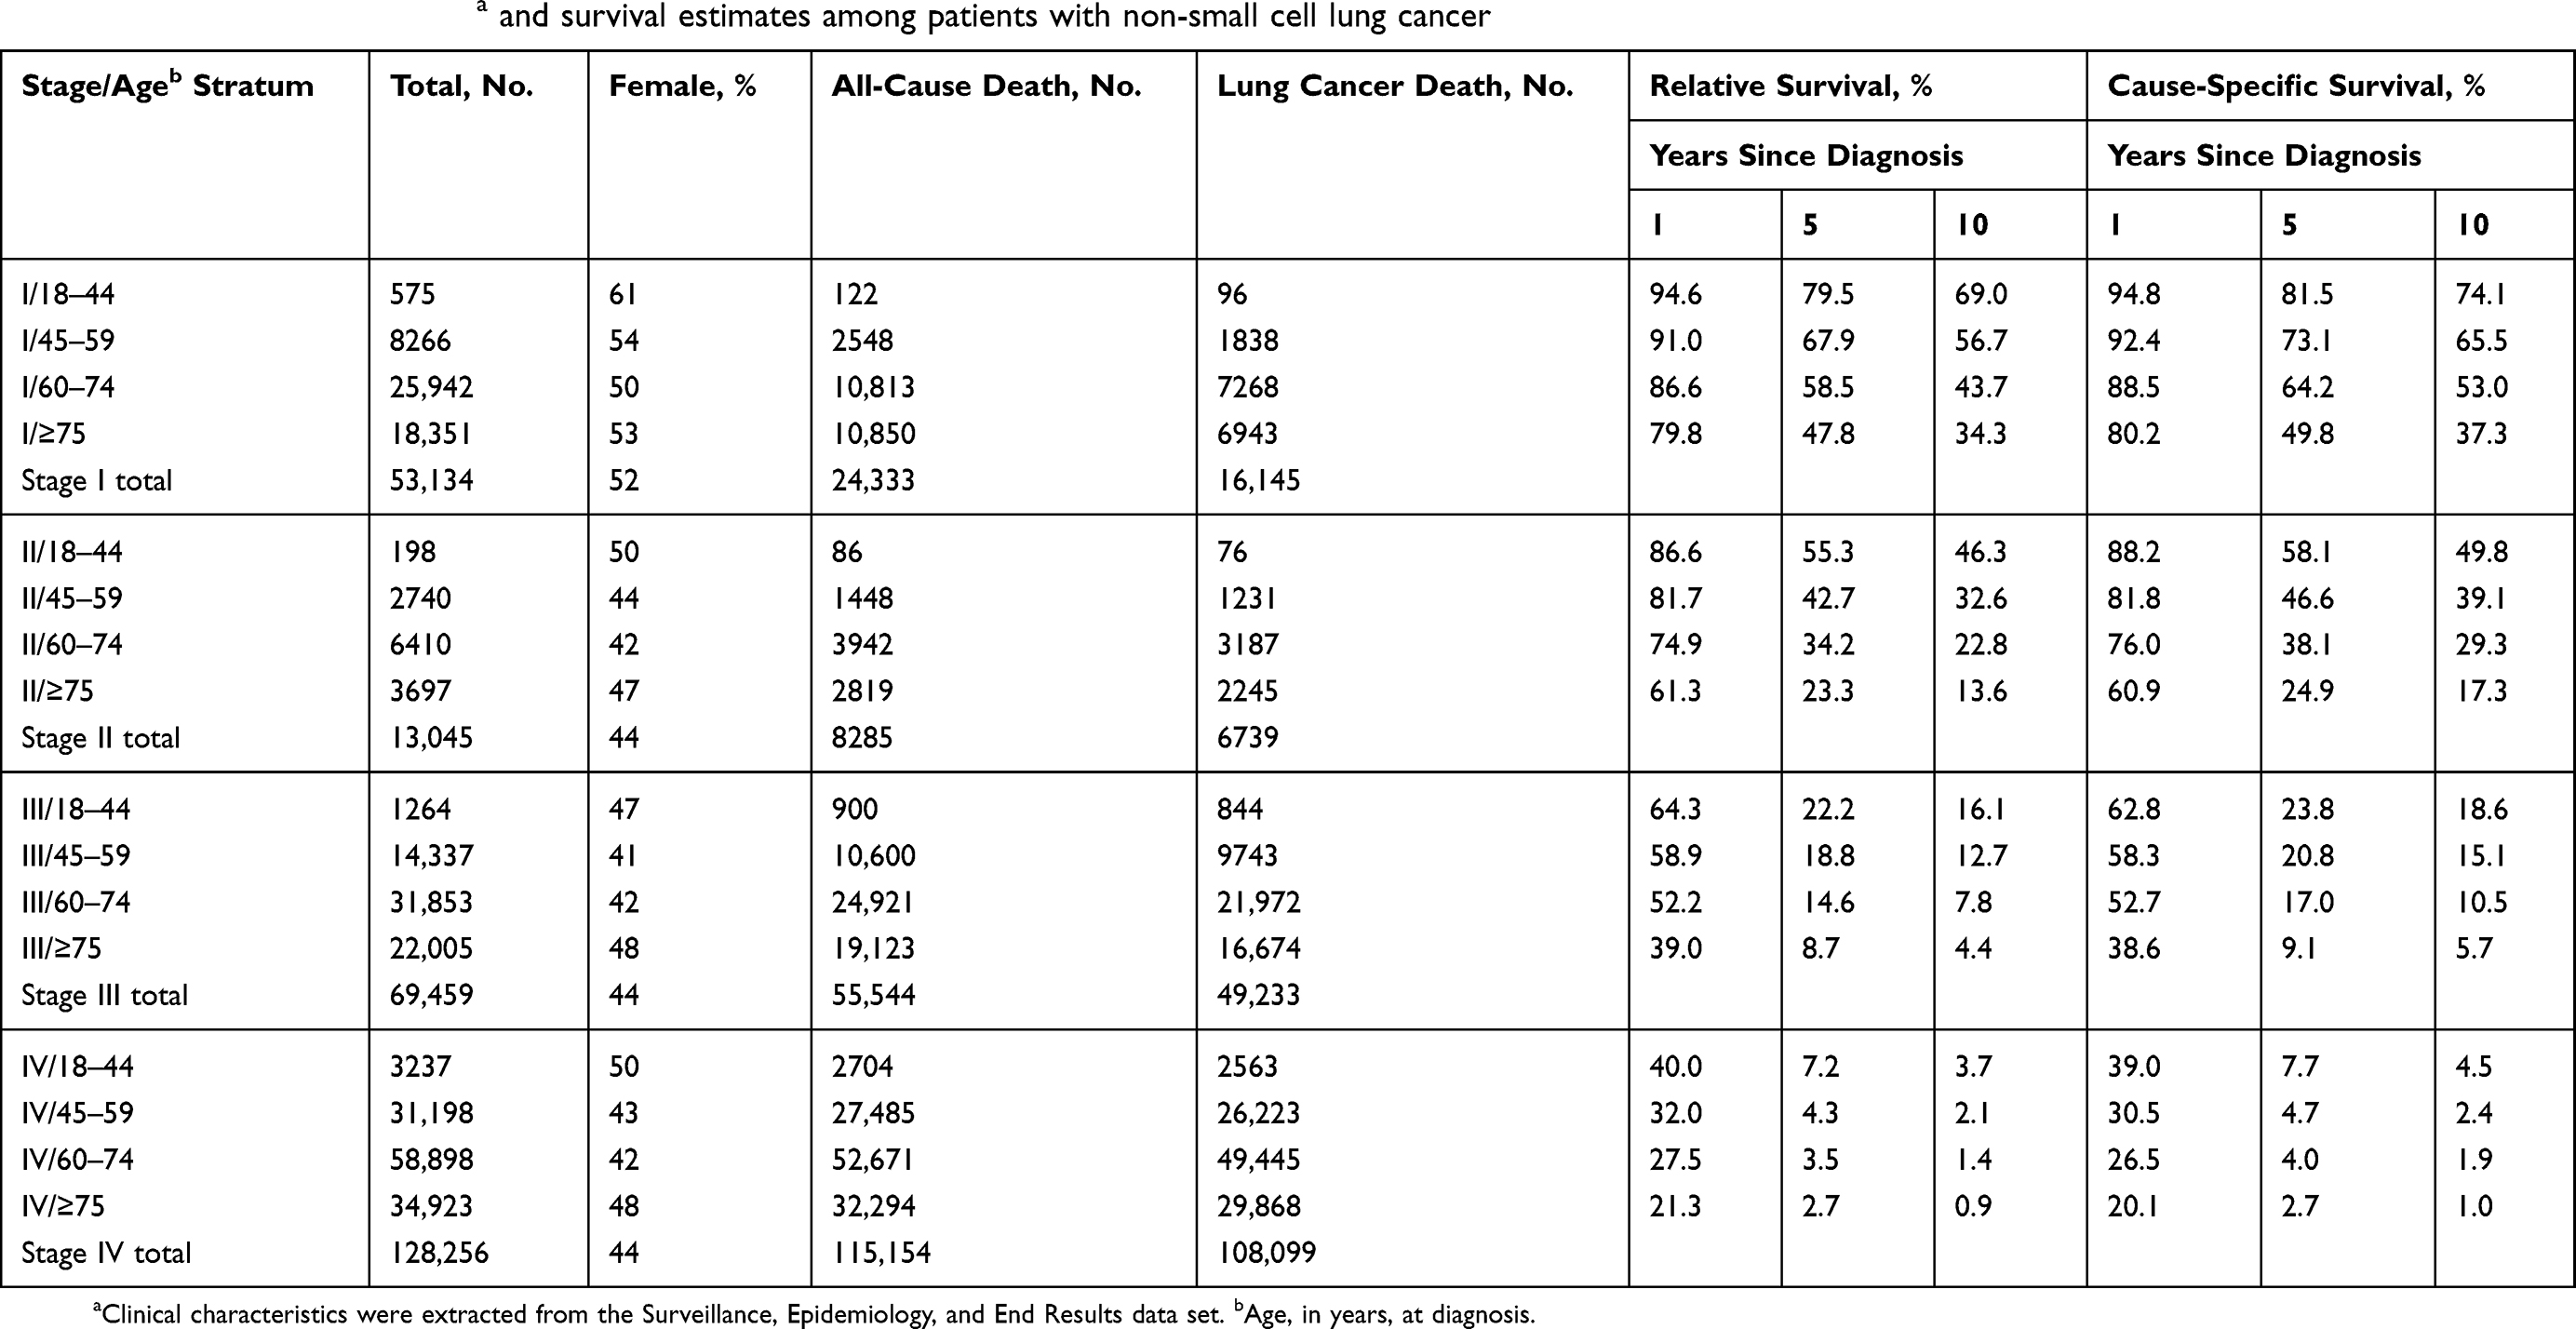 |
Table 1 Summary of clinical dataa and survival estimates among patients with non-small cell lung cancer |
Relative survival versus cause-specific survival
Among stage I patients, estimates of cause-specific survival were higher than estimates of relative survival in all age-by-stage strata, across all years of follow-up (Figure 1A). Differences between cause-specific and relative survival estimates were minimal in the short term (ie, 1 year postdiagnosis) but increased in magnitude with increasing years of follow-up (Table 1). For example, among those aged 60–74 years, cause-specific survival was 1.9 pp higher than relative survival at 1 year postdiagnosis (88.5% vs 86.6%). However, the difference increased to 5.7 pp at 5 years postdiagnosis (64.2% vs 58.5%) and 9.3 pp at 10 years postdiagnosis (53.0% vs 43.7%). Examining across increasing age groups, the differences between relative and cause-specific survival estimates increased with advancing age, except in the case of patients aged ≥75 years. For example, at 10 years postdiagnosis, cause-specific survival was 5.1 pp higher than relative survival among those aged 18–44 (74.1% vs 69.0%), 8.8 pp higher among those aged 45–59 (65.5% vs 56.7%), and 9.3 pp higher among those aged 60–74 (53.0% vs 43.7%), whereas the difference was 3.0 pp among patients aged ≥75 (37.3% vs 34.3%).
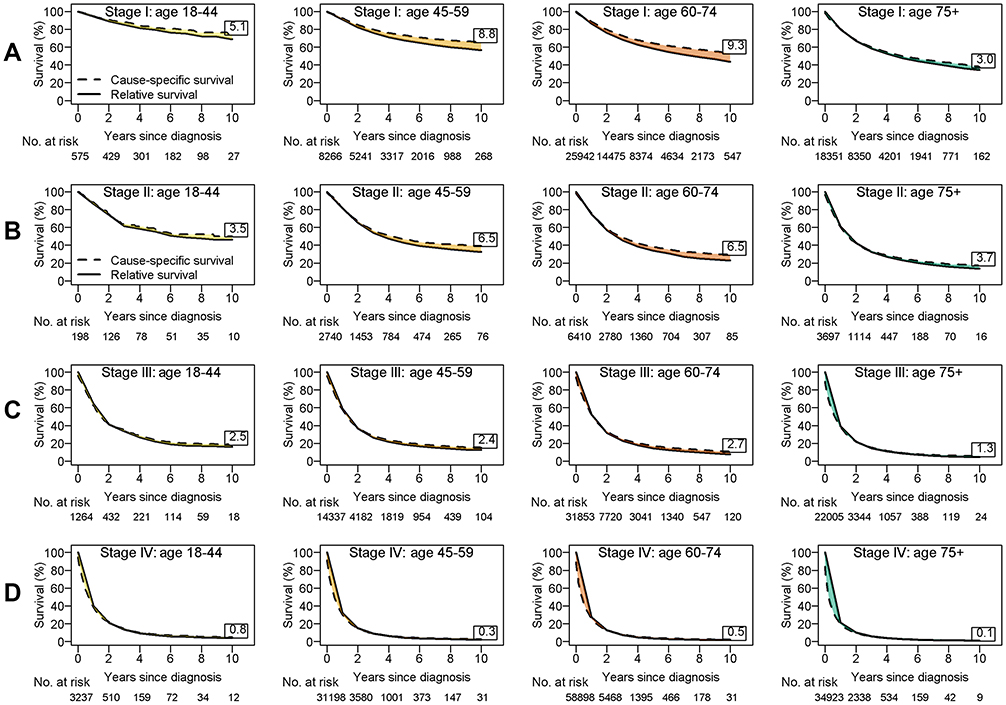 |
Figure 1 Relative and cause-specific survival estimates by age group for patients with stage I (A), stage II (B), stage III (C), and stage IV (D) non-small cell lung cancer. The value in each box reports the percentage-point difference at 10 years since diagnosis (the 10-year cause-specific survival estimate minus the 10-year relative survival estimate). |
Overall, survival estimates were lower as stage increased (ie, stage II disease had worse survival estimates than stage I). Results for patients with stage II NSCLC mirrored those for patients with stage I disease: estimates of cause-specific survival were always higher than estimates of relative survival (Figure 1B). The differences between cause-specific and relative survival estimates were less drastic among patients with stage II disease than among those with stage I disease. For example, among those aged 60–74 with stage II disease, cause-specific survival was 1.1 pp higher than relative survival at 1 year postdiagnosis (76.0% vs 74.9%) and 6.5 pp higher at 10 years postdiagnosis (29.3% vs 22.8%). These differences were less pronounced than those found in the corresponding patients with stage I disease (1.9 pp and 9.3 pp). The differences between cause-specific and relative survival estimates were <3 pp among all patients with stage III disease and <1 pp among all patients with stage IV disease (Figure 1C and D).
Subcohort analysis among surgical patients
Among the total cohort, 62,627 patients (24%) received surgery; most surgical patients had early-stage disease (69% of stage I and 64% of stage II disease groups, compared with 17% of stage III and 4% of stage IV disease groups). Overall, patients who underwent surgery had better survival than the overall cohort for corresponding strata. As observed in the total cohort, estimates of cause-specific survival for patients who underwent surgery were always higher than estimates of relative survival (Table 2, Figure 2A–D). Among the stage I and II disease groups, the differences between cause-specific and relative survival estimates were similar to those in the overall cohort (in general, they were of a slightly smaller magnitude). As observed in the primary analyses, the difference between the two methods was negligible at 1 year postdiagnosis but increased as years of follow-up increased. For example, among those aged 60–74 with stage II disease, cause-specific survival was 0.9 pp higher than relative survival at 1 year postdiagnosis (85.1% vs 84.2%), 3.3 pp higher at 5 years postdiagnosis (48.1% vs 44.8%), and 6.5 pp higher at 10 years postdiagnosis (38.6% vs 32.1%).
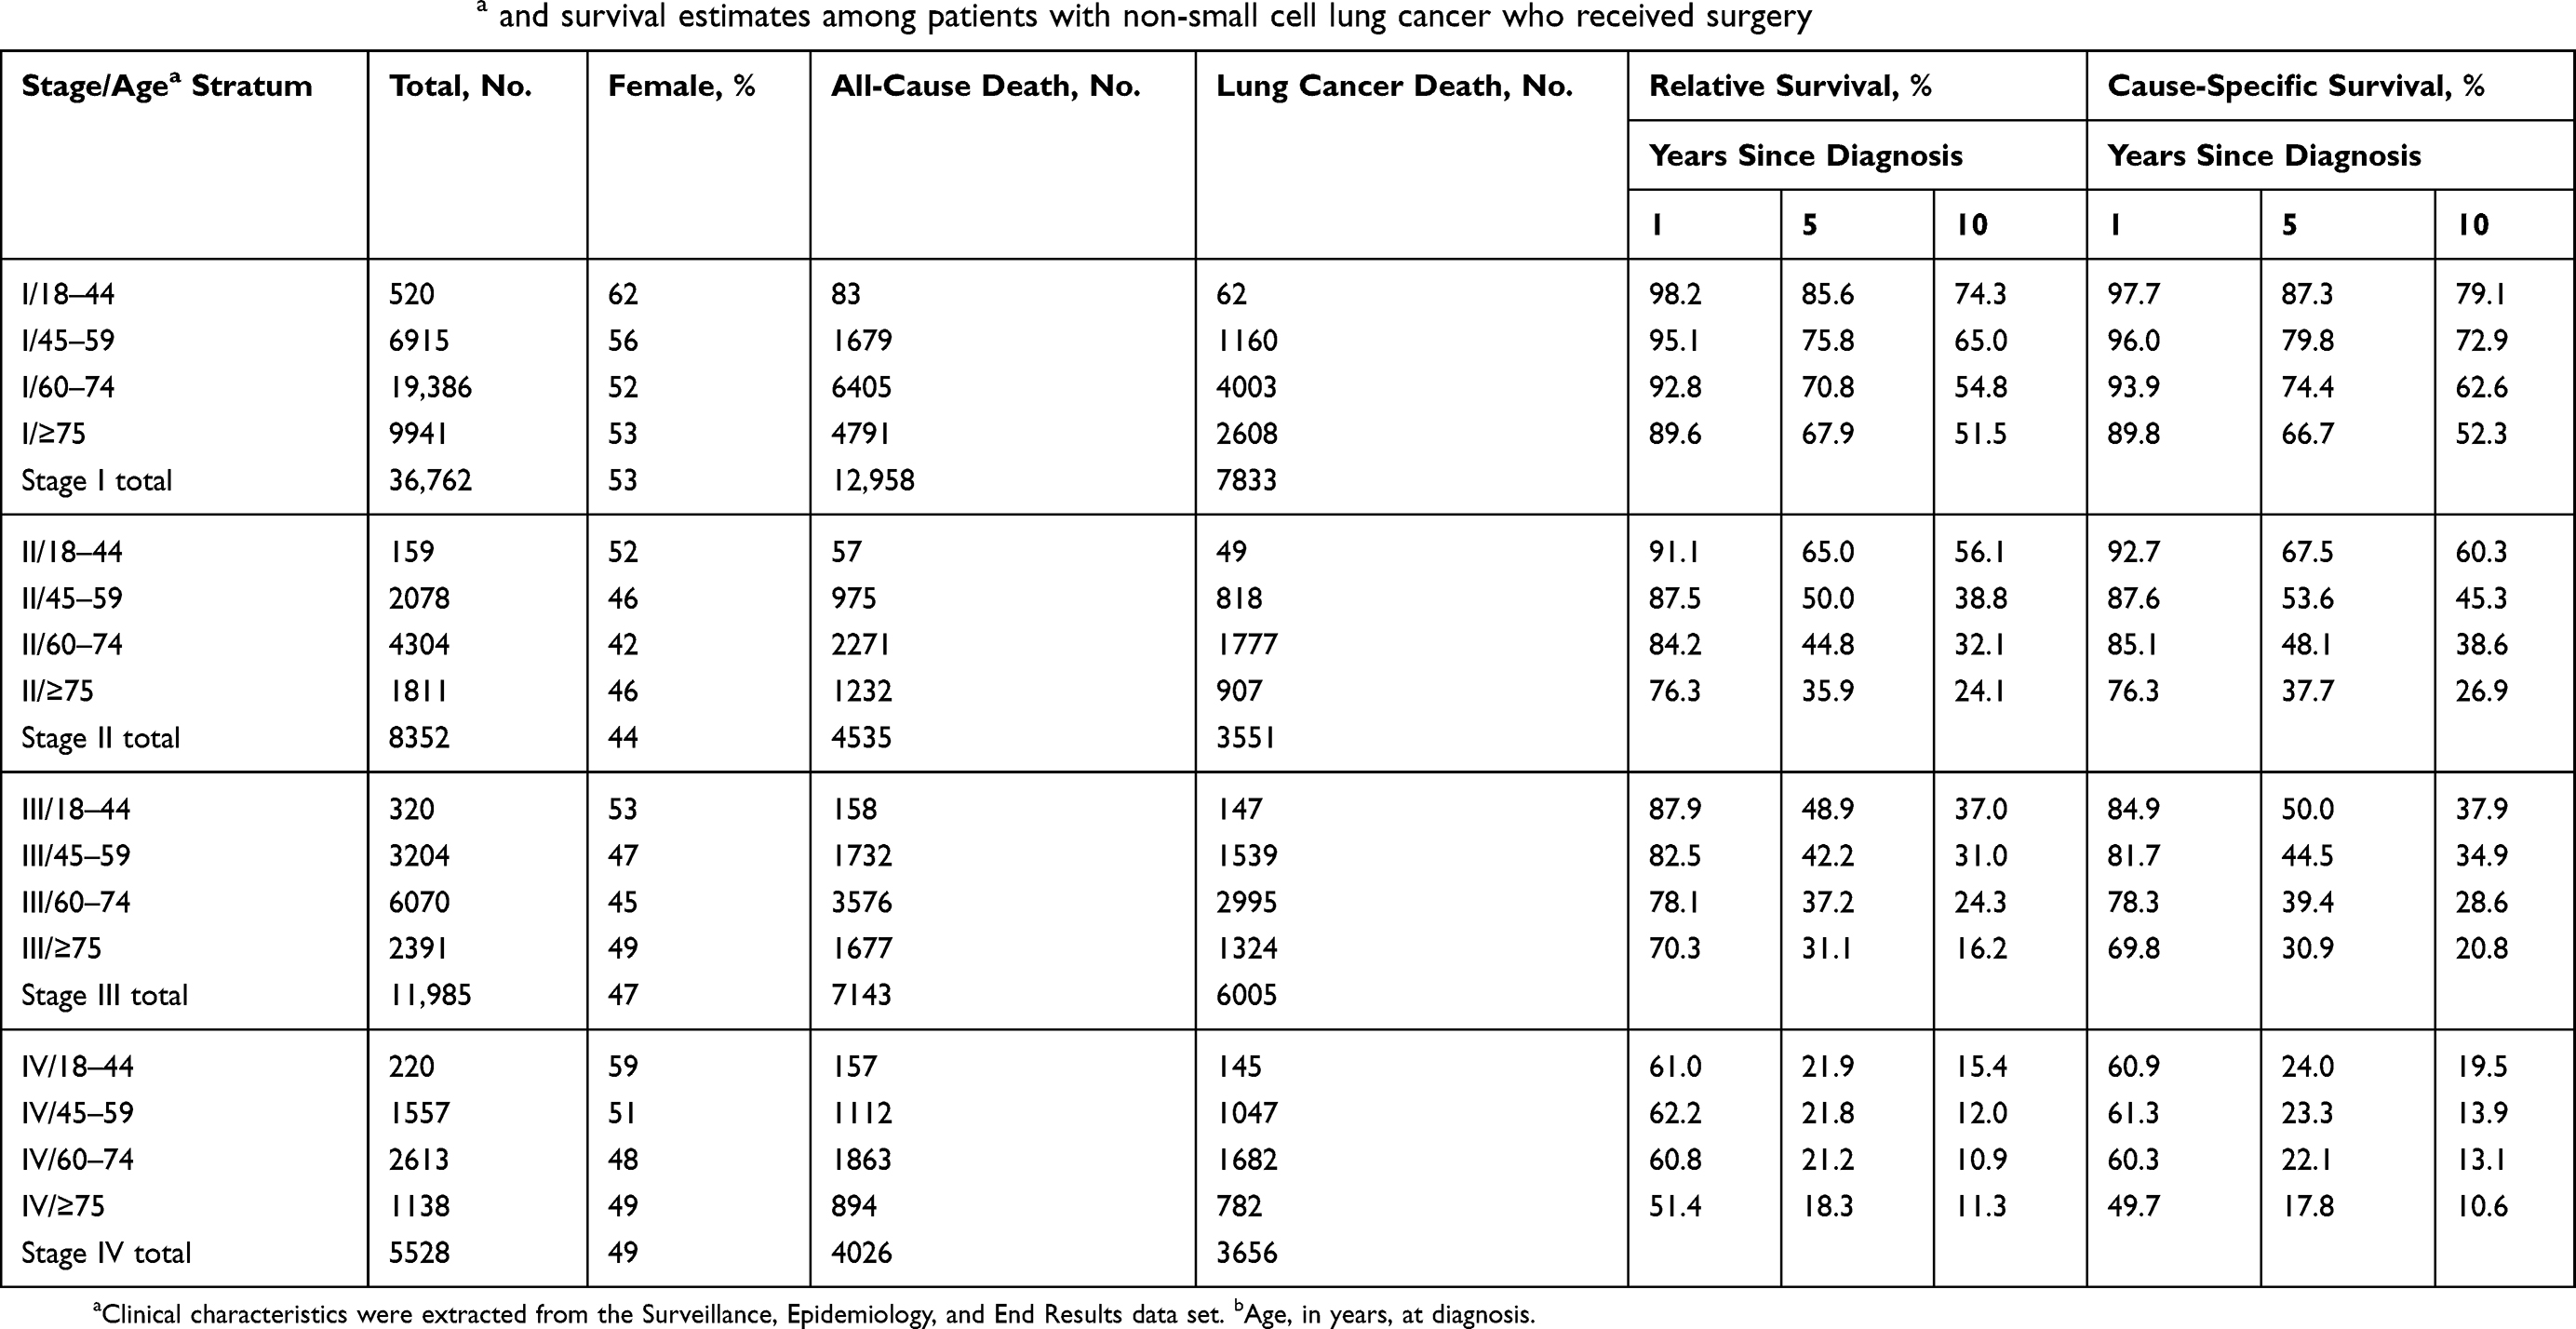 |
Table 2 Summary of clinical dataa and survival estimates among patients with non-small cell lung cancer who received surgery |
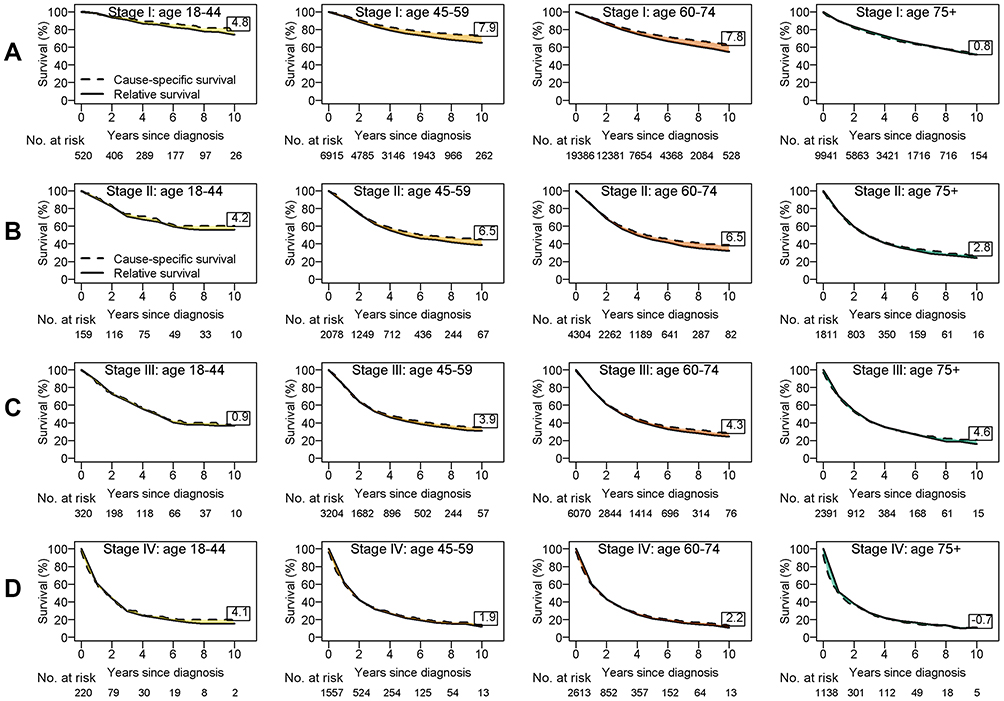 |
Figure 2 Relative and cause-specific survival estimates by age group for patients who underwent surgery with stage I (A), stage II (B), stage III (C), and stage IV (D) non-small cell lung cancer. The value in each box reports the percentage-point difference at 10 years since diagnosis (the 10-year cause-specific survival estimate minus the 10-year relative survival estimate). |
Discussion
This study compares two competing conventional estimators of net survival. Applying both relative and cause-specific survival methods to the same data, we quantified the differences in net survival estimates between the methods in the context of NSCLC. Results demonstrates that in most situations, relative survival and cause-specific survival provided similar estimates of net survival. Negligible differences between the two frameworks in certain scenarios implies that both approaches can be reliably used to estimate net survival in subgroups where cancer survival is poorer (eg, among late-stage disease or older patients) and the interest is in short-term survival. However, our study also highlights situations with major discrepancies between the two methods and cautions against using the two terminologies interchangeably, especially when focused on long-term follow-up, as both frameworks are vulnerable to errors.
For cause-specific survival, accurate cause-of-death coding in cancer registries is crucial. The degree of bias in cause-specific survival estimates depends on the degree of misclassification of cancer-specific cause of death on death certificates. Results from lung cancer screening trials estimated up to 15% under-reporting of lung cancer deaths due to misclassification.17–19 In this set of analyses, it is reasonable to assume that the potential for bias due to misclassification is greater among older patients (among whom the overall incidence of death is much greater than among younger patients) and lower among those with late-stage disease (among whom a greater proportion of deaths can be assigned to lung-cancer causes, with greater confidence).
In addition to misattribution of the cause of death, cause of death may have been recorded as “unknown” (ie, death cannot be ascribed to lung cancer or to other causes with certainty). Gamel and Vogel20 proposed partitioning these deaths by the ratio of lung cancer–specific deaths to deaths attributable to other causes. We conducted sensitivity analyses on the basis of this approach (results not shown); owing to the small number of deaths attributable to unknown causes in this context, the conclusions were similar.
The primary source of error for relative survival is noncomparability between the study population and the general population used to estimate underlying mortality.2 Comparability implies that if the patient did not have cancer, then the patient's survival experience (or background mortality) is assumed to match the general population. This assumption is undoubtedly violated in the current context of lung cancer, where patients are more likely to be smokers than the general population. Smoking is a major risk factor for developing lung cancer and consequently dying from lung cancer.21 More importantly, smoking increases the risk of comorbidities such as chronic respiratory disease, cardiovascular disease and other smoking-related cancers.22–24 Lung cancer patients are therefore more likely to die from other smoking-related comorbidities, so their true background mortality may not be comparable to the general population. In reality, the potential biases resulting from noncomparability could likely explain the differences between relative and cause-specific survival estimates observed here: since the life tables used in this study do not account for tobacco-use or smoking-related comorbidities, the expected survival may have been overestimated, resulting in underestimation of the relative survival. This potential explanation is further highlighted in the subgroup analysis among surgical patients, where we observed greatly diminished or negligible differences between relative and cause-specific survival estimates. Patients who are eligible for surgery tend to have lower rates of comorbidities, therefore their background mortality is more comparable to the general population. Few studies have quantified the impact of tobacco-use on relative survival estimates.25 Using the Finnish Cancer Registry, Hinchliffe et al26 showed that the bias in relative survival due to the noncomparability of smoking patterns was negligible. However, reporting of tobacco-use is often unreliable. Thorough investigation of the impact of noncomparability requires using smoking-adjusted life tables, as attempted by several researchers,27,28 but such adaptations of life tables are difficult to implement because the necessary population-level smoking data linked to mortality data are rarely available. Because the SEER registry does not capture data on tobacco-use or smoking-related comorbidities, we cannot fully address this issue in our current analysis. Future studies should confirm that the differences in estimates between the two frameworks can indeed be reduced by using smoking-adjusted life tables or by stratifying analyses by smoking-related comorbidities.
In theory, relative survival requires a comparison group free of the cancer under study. In practice, expected survival is typically calculated from general-population life tables, which include people previously diagnosed with cancer. With the inclusion of people previously diagnosed with cancer, the expected survival in the general population would be underestimated and hence lead to overestimation of relative survival. Studies have examined this issue in the general populations of Finland29 and Canada.30 These studies concluded that adjustment for cancer mortality is warranted if relative survival is estimated for all cancer sites combined but that the proportion of deaths attributable to specific cancers, particularly lung cancer, is too small to affect the relative survival estimates. Although we did not extract lung cancer mortality from the comparison cohort by excluding individuals with lung cancer, we believe that the magnitude of the bias in relative survival estimation is negligible for lung cancer.31
We assessed two classical methods to estimate net survival; however, other methods with different properties exist and have been examined,32–34 including a proposed method by Perme et al.35 In addition, the net survival estimates we present in this study are in the context of a hypothetical world where cancer is the only cause of death.1,36 However, specific questions of interest may require consideration of other causes of death. Hence, instead of net survival, it is more appropriate to present crude survival in those cases. Formal comparisons between these two survival measures can be found elsewhere.2
Last, the use of the SEER registry allowed us to evaluate long-term survival among patients with lung cancer. However, such a large, multi-institutional database is subject to the typical limitations associated with any retrospective registry-based data involving a group of heterogenous patients not treated uniformly. Important covariates such as significant comorbidities, tumor locations, radiographic results, and treatment of subsequent cancer recurrences were not captured in the SEER registry. Hence, the lack of adjustment for factors associated with prognosis is a limitation we cannot overcome in this study.
Conclusion
Relative survival and cause-specific survival are complementary but not interchangeable. In general, both frameworks provide similar estimates of net survival. However, differences between the two estimates may still be considerable in certain situations, particularly when the focus is on early-stage disease and long-term survival probability estimation. Hence, it is crucial to detail the type of survival estimates presented or communicated. With a deliberate focus on obtaining a well-matched comparison cohort and accurate cause-of-death coding, population-based studies should present results from both approaches and identify differences in study findings, along with the limitations specific to each method.
Data availability
This paper utilized publicly available data through the Surveillance, Epidemiology, and End Results (SEER) program.
Acknowledgment
This work was supported by the National Institutes of Health (NIH) Cancer Center Support Grant P30 CA008748. The sponsor played no role in any aspect of the study or manuscript.
Disclosure
The authors report no conflicts of interest in this work.
References
1. Perme MP, Estève J, Rachet B. Analysing population-based cancer survival – settling the controversies. BMC Cancer. 2016;16(1):933. doi:10.1186/s12885-016-2967-9
2. Mariotto AB, Noone AM, Howlader N, et al. Cancer survival: an overview of measures, uses, and interpretation. J Natl Cancer Inst Monogr. 2014;2014(49):145–186. doi:10.1093/jncimonographs/lgu024
3. American Lung Association. Lung cancer fact sheet. Available from: http://www.lung.org/lung-health-and-diseases/lung-disease-lookup/lung-cancer/resource-library/lung-cancer-fact-sheet.html. Accessed September 10, 2018.
4. Munro AJ. Comparative cancer survival in European countries. Br Med Bull. 2014;110(1):5–22. doi:10.1093/bmb/ldu009
5. Cronin KA, Feuer EJ. Cumulative cause‐specific mortality for cancer patients in the presence of other causes: a crude analogue of relative survival. Stat Med. 2000;19(13):1729–1740.
6. Sarfati D, Blakely T, Pearce N. Measuring cancer survival in populations: relative survival vs cancer-specific survival. Int J Epidemiol. 2010;39(2):598–610. doi:10.1093/ije/dyp392
7. Howlader N, Ries LA, Mariotto AB, et al. Improved estimates of cancer-specific survival rates from population-based data. J Natl Cancer Inst. 2010;102(20):1584–1598. doi:10.1093/jnci/djq366
8. Surveillance, Epidemiology, and End Results (SEER) Program Populations (1973–2014). Bethesda (MD): National Cancer Institute, DCCPS, Surveillance Research Program, Cancer Statistics Branch; 2017.
9. Fritz A, Percy C, Jack A, et al. eds. International Classification of Diseases for Oncology.
10. Greene FL, Page DL, Fleming ID, et al. AJCC Cancer Staging Manual.
11. Ederer F, Heise H. The effect of eliminating deaths from cancer on general population survival rates. Meth Note No. 1959;11(23):169.
12. Dickman P. Estimating and modelling relative survival using SAS. Available from: http://www.pauldickman.com/rsmodel/sas_colon/. Accessed May 1, 2018.
13. Cho H, Howlader N, Mariotto AB, et al. Estimating relative survival for cancer patients from the SEER program using expected rates based on Ederer I versus Ederer II method. Surveillance Research Program, NCI, Technical Report #2011-01. Available from: https://surveillance.cancer.gov/reports/tech2011.01.pdf. Published 2011.
14. Radivoyevitch T. SEERaBomb: SEER and atomic bomb survivor data analysis tools. R package version 2017.2. The Comprehensive R Archive Network; 2017. Available from: https://CRAN.R-project.org/package=SEERaBomb.
15. Hyndman RJ. Demography: forecasting mortality, fertility, migration and population data. R package version 1.18. The Comprehensive R Archive Network; 2014. Available from: https://CRAN.R-project.org/package=demography.
16. National Center for Health Statistics (NCHS). United States life tables. Available from: https://www.cdc.gov/nchs/products/life_tables.htm.
17. Doria-Rose VP, Marcus PM. Death certificates provide an adequate source of cause of death information when evaluating lung cancer mortality: an example from the Mayo Lung Project. Lung Cancer. 2009;63(2):295–300. doi:10.1016/j.lungcan.2008.05.019
18. Frost JK, Ball WC, Levin ML, et al. Early lung cancer detection: results of the initial (prevalence) radiologic and cytologic screening in the Johns Hopkins study. Am Rev Respir Dis. 1984;130(4):549–554. doi:10.1164/arrd.1984.130.4.549
19. Tan KS. Misclassification of the actual causes of death and its impact on analysis: a case study in non-small cell lung cancer. Lung Cancer. 2019;134:16–24. doi:10.1016/j.lungcan.2019.05.016
20. Gamel JW, Vogel RL. Non-parametric comparison of relative versus cause-specific survival in Surveillance, Epidemiology and End Results (SEER) programme breast cancer patients. Stat Methods Med Res. 2001;10(5):339–352. doi:10.1177/096228020101000503
21. Molina JR, Yang P, Cassivi SD, et al. Non-small cell lung cancer: epidemiology, risk factors, treatment, and survivorship. Mayo Clin Proc. 2008;83(5):Elsevier. doi:10.1016/S0025-6196(11)60735-0
22. Willett WC, Green A, Stampfer MJ, et al. Relative and absolute excess risks of coronary heart disease among women who smoke cigarettes. N Engl J Med. 1987;317(21):1303–1309. doi:10.1056/NEJM198711193172102
23. Moore C. Cigarette smoking and cancer of the mouth, pharynx, and larynx: a continuing study. Jama. 1971;218(4):553–558.
24. Fuchs CS, Colditz GA, Stampfer MJ, et al. A prospective study of cigarette smoking and the risk of pancreatic cancer. Arch Intern Med. 1996;156(19):2255–2260.
25. Blakely T, Soeberg M, Carter K, et al. Bias in relative survival methods when using incorrect life‐tables: lung and bladder cancer by smoking status and ethnicity in New Zealand. Int J Cancer. 2012;131(6):E974–E982. doi:10.1002/ijc.27592
26. Hinchliffe SR, Rutherford MJ, Crowther MJ, et al. Should relative survival be used with lung cancer data? Br J Cancer. 2012;106(11):1854–1859. doi:10.1038/bjc.2012.182
27. Ellis L, Coleman MP, Rachet B. The impact of life tables adjusted for smoking on the socio-economic difference in net survival for laryngeal and lung cancer. Br J Cancer. 2014;111(1):195–202. doi:10.1038/bjc.2014.217
28. Rosenberg MA, Feuer EJ, Yu B, et al. Chapter 3: cohort life tables by smoking status, removing lung cancer as a cause of death. Risk Anal. 2012;32(Suppl 1):S25–S38. doi:10.1111/j.1539-6924.2011.01662.x
29. Hinchliffe SR, Dickman PW, Lambert PC. Adjusting for the proportion of cancer deaths in the general population when using relative survival: a sensitivity analysis. Cancer Epidemiol. 2012;36(2):148–152. doi:10.1016/j.canep.2011.09.007
30. Ellison LF. Adjusting relative survival estimates for cancer mortality in the general population. Health Rep. 2014;25(11):3–9.
31. Talbäck M, Dickman PW. Estimating expected survival probabilities for relative survival analysis—exploring the impact of including cancer patient mortality in the calculations. Eur J Cancer. 2011;47(17):2626–2632. doi:10.1016/j.ejca.2011.08.010
32. Hakulinen T, Seppä K, Lambert PC. Choosing the relative survival method for cancer survival estimation. Eur J Cancer. 2011;47(14):2202–2210. doi:10.1016/j.ejca.2011.03.011
33. Seppä K, Hakulinen T, Läärä E, et al. Comparing net survival estimators of cancer patients. Stat Med. 2016;35(11):1866–1879. doi:10.1002/sim.6833
34. Roche L, Danieli C, Belot A, et al. Cancer net survival on registry data: use of the new unbiased Pohar‐Perme estimator and magnitude of the bias with the classical methods. Int J Cancer. 2013;132(10):2359–2369. doi:10.1002/ijc.27830
35. Perme MP, Stare J, Esteve J. On estimation in relative survival. Biometrics. 2012;68:113–120. doi:10.1111/j.1541-0420.2011.01640.x
36. Lambert PC, Dickman PW, Rutherford MJ. Comparison of different approaches to estimating age standardized net survival. BMC Med Res Methodol. 2015;15(1):64. doi:10.1186/s12874-015-0092-0
Supplementary materials
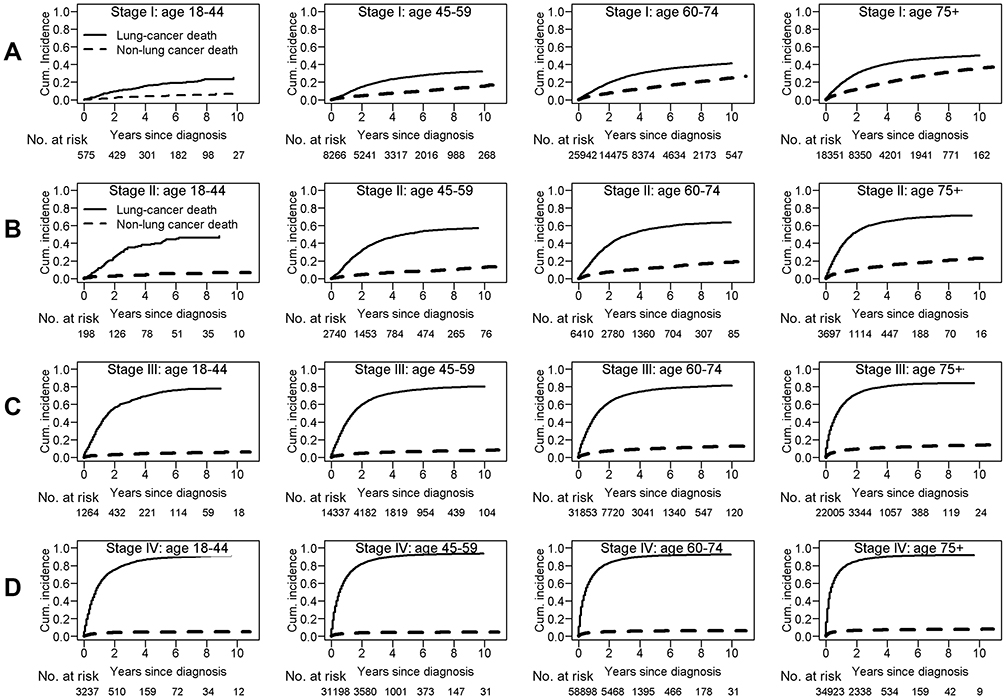 |
Figure S1 Crude mortality from cancer and noncancer causes by age group for patients with stage I (A), stage II (B), stage III (C), and stage IV (D) non-small cell lung cancer. Cumulative incidence of lung-cancer deaths (LC-CID) and cumulative incidence of nonlung-cancer deaths (non-LC-CID) were generated using a competing risk approach. Overall, LC-CID increased with advancing age and stage; similarly, non-LC-CID increased with advancing age and stage. Even though the total number of deaths increased with age, the proportion of deaths attributable to cancer in the older age group decreased because of increased competing causes of death. Abbreviation: Cum. incidence, cumulative incidence. |
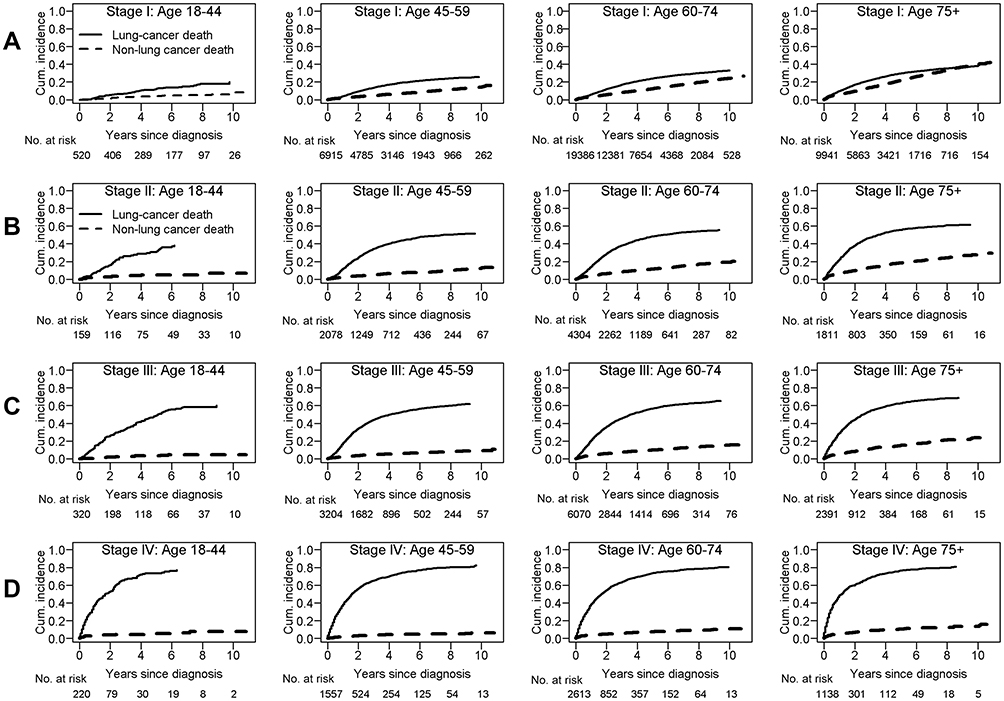 |
Figure S2 Crude mortality due to cancer and noncancer causes by age group for patients with stage I (A), stage II (B), stage III (C), and stage IV (D) non-small cell lung cancer among patients who underwent surgery. Abbreviation: Cum. incidence, cumulative incidence. |
 © 2019 The Author(s). This work is published and licensed by Dove Medical Press Limited. The
full terms of this license are available at https://www.dovepress.com/terms
and incorporate the Creative Commons Attribution
- Non Commercial (unported, 3.0) License.
By accessing the work you hereby accept the Terms. Non-commercial uses of the work are permitted
without any further permission from Dove Medical Press Limited, provided the work is properly
attributed. For permission for commercial use of this work, please see paragraphs 4.2 and 5 of our Terms.
© 2019 The Author(s). This work is published and licensed by Dove Medical Press Limited. The
full terms of this license are available at https://www.dovepress.com/terms
and incorporate the Creative Commons Attribution
- Non Commercial (unported, 3.0) License.
By accessing the work you hereby accept the Terms. Non-commercial uses of the work are permitted
without any further permission from Dove Medical Press Limited, provided the work is properly
attributed. For permission for commercial use of this work, please see paragraphs 4.2 and 5 of our Terms.