Back to Journals » Nature and Science of Sleep » Volume 11
Reported light in the sleep environment: enhancement of the sleep diary
Authors Harrison EM ![]() , Yablonsky AM, Powell AL
, Yablonsky AM, Powell AL ![]() , Ancoli-Israel S
, Ancoli-Israel S ![]() , Glickman GL
, Glickman GL
Received 8 November 2018
Accepted for publication 25 January 2019
Published 25 March 2019 Volume 2019:11 Pages 11—26
DOI https://doi.org/10.2147/NSS.S193902
Checked for plagiarism Yes
Review by Single anonymous peer review
Peer reviewer comments 3
Editor who approved publication: Dr Sutapa Mukherjee
Elizabeth M Harrison,1 Abigail M Yablonsky,2 Alexandra L Powell,1 Sonia Ancoli-Israel,1,3 Gena L Glickman1,4
1Center for Circadian Biology, University of California, San Diego, CA, USA; 2Clinical Investigations Department, Naval Medical Center San Diego, San Diego, CA, USA; 3Department of Psychiatry, University of California, San Diego, CA, USA; 4Department of Psychiatry, Uniformed Services University, Bethesda, MD, USA
Background: Light is the primary synchronizing cue for the circadian timing system, capable of exerting robust physiological effects, even with very dim and/or brief photic exposure. Mammals, including humans, are particularly susceptible to light at night. As such, measures of light in the sleeping environment are critical for evaluating sleep health. Sleep diaries provide inexpensive measures of sleep, but do not typically include light information.
Methods: Four questions probing visual perception of light in the bedtime and waking environments were added to the Consensus Sleep Diary for Morning administration. As part of a lighting intervention study, 18 hospital Labor and Delivery Department personnel completed the sleep diary for 1 week in each of two experimental conditions while wearing Actiwatch devices equipped with photosensors. Diary responses were evaluated against photosensor values from the beginning and end of each rest interval (n=194 rest intervals), as well as against sleep measures, utilizing linear mixed models.
Results: Responses to light questions were related to actual light measures at bedtime, controlling for shift type and experimental condition. In addition, subjective light information at bedtime and waking was related to both objective and subjective sleep parameters, with data generally indicating poorer sleep with light in the sleeping environment.
Conclusion: Questions addressing perception of light in the sleeping environment may provide a crude yet affordable metric of relative photic intensity. Further, as responses relate to sleep outcomes, subjective light information may yield valuable insights regarding mechanisms and outcomes of clinical significance in sleep and circadian research.
Keywords: circadian, actigraphy, photosensor, LAN
Introduction
The vast majority of American adults (89%) have light-emitting technology in their room at night.1 Light exerts a number of physiological effects on mammalian systems via multiple mechanisms and pathways. It is the primary synchronizing cue for the circadian timing system, and even relatively dim (eg, <2.41 uW/cm2, 1 lux) and/or brief (15 seconds) photic exposures can markedly influence circadian responses and other biological effects of light.2–4 Additional effects of light include acute alerting effects,5 melatonin suppression,4 and reorganization of the circadian system itself.6–11 While the magnitude of each of these responses is both dose- and wavelength-dependent,4,12–17 it is the timing of light exposure that is most critical for these photobiological effects, with particular sensitivity at the beginning and end of physiological night.18 Therefore, ambient light in the sleeping environment is a critical (yet often neglected) consideration in the assessment of sleep health, and data collected on light in sleeping environments could provide an additional behavioral point of intervention for clinicians.
Controlled laboratory studies are necessary for the rigorous characterization of the biological effects of light; however, field studies are important for further understanding the influence of light on sleep and circadian health under more naturalistic conditions. Actigraphy devices are wrist-worn activity monitors used widely to assess sleep and circadian rhythms outside the laboratory, and many models contain photosensors.19 Actigraphy devices continue to be one of the only ways to obtain individual light data under ecologically valid conditions (such as the home environment), while also enabling estimation of sleep and activity rhythms.
However, these devices are not without their limitations. Though there is an emerging trend for employing wearable technologies that monitor various aspects of physiology, including sleep,20 validated actigraphy devices remain costly, and this can be prohibitive and/or limit the scope of their application. Additionally, while light information collected at the wrist correlates with light at the eye, it is not an accurate measure of photic input to the circadian system.21,22 Indeed, most actigraphy light sensors measure light in lux, a unit of measurement that weights each wavelength of light based on the spectral sensitivity of the visual system.
By contrast, the circadian system has a distinct peak sensitivity to light in the short-wavelength region of the spectrum,4,16 primarily mediated by a subset of intrinsically photosensitive retinal ganglion cells (ipRGCs) containing the photopigment melanopsin.23–25 While ipRGCs appear to contribute to color vision to some extent,26–32 unlike rods and cones, ipRGCs show sustained responses to light, adapting at a rate that is orders of magnitude slower.33 Therefore, while lux remains the foremost measure available, it is at best a crude estimate of circadian input.
Further, while some newer actigraphy devices quantify spectral quality to a certain extent (eg, Actiwatch Spectrum, Plus and Pro, Philips Respironics, Murrysville, PA, USA), their accuracy has also been questioned.22,34–37 Consequently, even the most commonly deployed objective methods of ascertaining light in the sleeping environment are not without their limitations. While objective measures are generally more reliable, subjective sleep diaries are prevalent, and were described by Carney et al as “. . . universally used as the preferred method for collecting data over time . . . in insomnia research”.38 As such, we were prompted to consider the utility of subjectively reported visual perception of light in the sleeping environment; still a proxy for circadian input, but a less costly and more convenient one. Cost considerations cannot be discounted in applied research and clinical practice, both of which rely on longitudinally collected data. A free measure that is able to provide meaningful data in place of a device that costs upward of US$1,000 per individual would result in profound savings for a given study or practice.
Sleep logs are always used in conjunction with actigraphy, as self-reported information is highly recommended by the American Academy of Sleep Medicine for editing and scoring of activity data.39 Sleep diaries are also commonly used in the fields of sleep research and medicine to examine subjective reports of sleep/wake patterns outside the laboratory. Sleep diaries, in contrast to sleep logs, are more comprehensive, typically provide stand-alone outcome measures, and their relatively low cost makes them ideal for collecting subjective data remotely in patients and large cohorts of research participants. Historically, most sleep diaries have contained questions regarding the amount, quality, and timing of sleep; however, they may have little else in common. Though efforts to standardize sleep diaries have been made,40,41 more often than not, individual labs and researchers choose to create their own diaries, tailored for specific environments or research questions. This translates into issues with generalizability of results across labs and studies. To address this concern, a group of sleep physicians and researchers developed the Consensus Sleep Diary (CSD).38 The diary is available in three versions: a “core” one-page version to be completed in the morning (CSD), a more detailed two-page version also completed in the morning (CSD-M) and, a detailed two-page version to be completed in both the evening and the morning (CSD-E). While the CSD was an important first step toward increasing the utility of research results by expanding the generalizability of sleep-diary data across research teams and clinical populations, it did not include questions about light exposure.
There have been limited attempts to assess subjective information about light.42–44,55 To our knowledge, however, no published sleep diaries have asked respondents about light in the sleeping environment, despite a growing appreciation of the potent effects of light on circadian rhythms and sleep health. We hypothesized that the addition of questions pertaining to perception of light might aid in further understanding sleep hygiene, as well as compliance and relative photic exposure, at virtually no cost. As such, we aimed to establish a modified sleep diary to include a subjective assessment of light in the sleeping environment.
The four original questions, described in the Methods section, were designed to elicit information on perceived illumination as a way to assess relative, rather than absolute, photic stimulation. For example, measurably more light should be present in sleeping environments wherein individuals report perceivable light, objects, and color than in those where they do not.
Further, the questions could potentially help determine which photoreceptors are being stimulated by a light source. For example, a question regarding the perception of objects, when used in conjunction with a question regarding color visibility, could potentially help determine if the rods and/or cones are being activated (see Figure 1). Specifically, a bedroom fashioned with blackout curtains and other modifications may create scotopic conditions (with only rod activation), wherein an individual would only be able to see in shades of gray, if at all. By contrast, natural nighttime light from the moon and stars is typical of mesopic conditions, wherein both rods and cones are stimulated, allowing for the perception of color, even if it is not extremely vivid. Finally, under photopic conditions, as is typical of indoor architectural lighting, cones are stimulated and thus colors should be readily apparent (Figure 1). Therefore, asking whether light and objects are visible and whether objects can be perceived in color or in gray may be sufficient to distinguish among the three conditions.
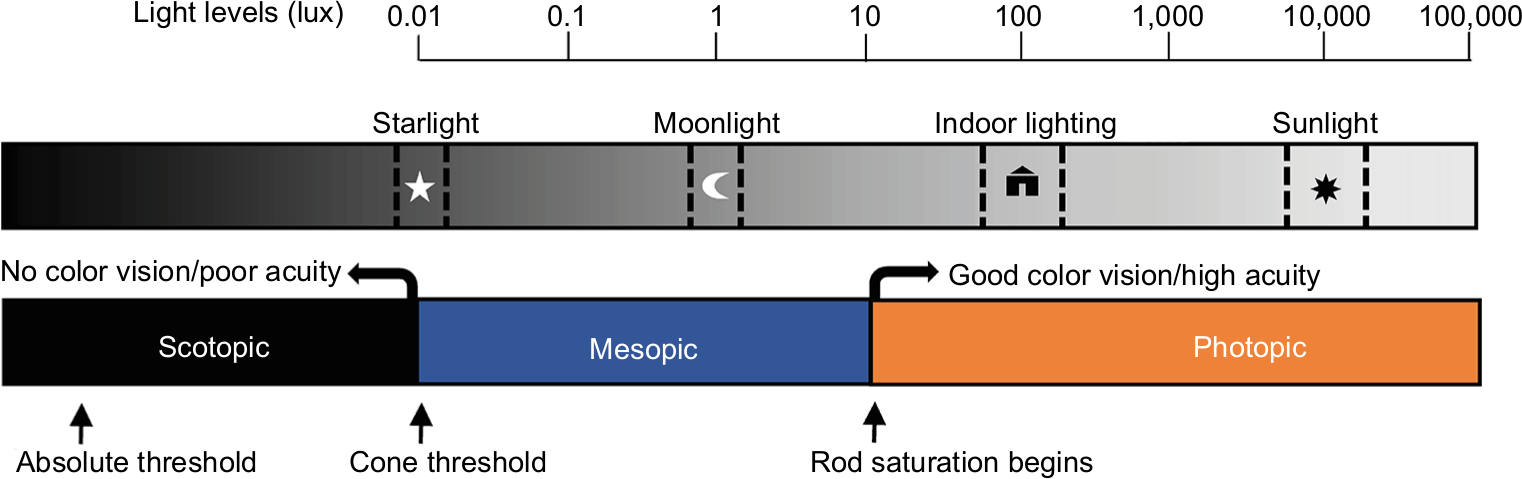 | Figure 1 Representation of photoreceptor thresholds, visual responses, and their relationship to the range of illumination from natural and artificial light sources. Notes: This schematic illustrates estimated levels of visual stimulation for typical ambient-lighting conditions. Lux values are depicted on a logarithmic scale, focusing on photic intensities that fall within the range of responsiveness across classical rod and cone photoreceptors. Light intensities are not absolute and depend on biological variables (eg, pupillary response, direction of gaze) and physical properties of the stimulus (eg, spectral composition, direction of light), as described in further detail within the text. Under scotopic conditions, a certain amount of light is required to elicit any response (absolute threshold) and only rods are activated, which is a relatively rare condition in practice, as starlight alone begins to stimulate cone photoreceptors. With mesopic conditions, such as a moonlit night, both rod and cone photoreceptors are stimulated. At greater intensities of light in the photopic range, “bleaching” of the photoreceptors will gradually occur, and ultimately, with very bright light, retinal damage becomes a concern. There is likely to be significant overlap in the identified photopic range and ipRGC activation; however, ipRGC activation is not depicted in the figure due to a lack of consensus regarding precise quantification of the range of responsiveness to light. This is further complicated by the fact that ipRGC activation may vary by a variety of photic variables, such as the timing, spectral quality, and prior exposure history. Abbreviation: ipRGC, intrinsically photosensitive retinal ganglion cell. |
Of note, if an individual reports perceiving objects in color in the sleeping environment, ipRGCs are also likely to be activated, though it will depend on the spectral composition of the light source, given their short-wavelength dependence. For example, a light source with significant long-wavelength energy and very little energy in the more potent shorter-wavelength region may allow for visual stimulation and color perception without stimulating ipRGCs sufficiently to alter sleep and/or circadian rhythms. We hypothesized that the addition of four questions on light perception would provide a reasonably good estimation of relative photic intensity (light energy per unit time per unit area) under typical architectural lighting conditions. A secondary hypothesis was that reported perception of light would relate to sleep parameters.
Methods
Participants
Data were collected in September and October 2017 as part of a larger study (to be published separately) examining the effects of a lighting intervention on hormonal, sleep, and performance rhythms of hospital staff in the Labor and Delivery Department at the Naval Medical Center San Diego (NMCSD). The primary component of the lighting intervention was a change in workplace lighting, with additional optional behavioral components for the home environment (Supplementary materials). Mid-study, civil twilight began at ~6 am and ended at ~7:45 pm. This study was conducted in accordance with the Declaration of Helsinki. All procedures were approved by the Institutional Review Board of the NMCSD (NMCSD2012.0002), and written informed consent was obtained for all participants.
Recruitment occurred via email and in person by study staff during shift turnovers. At the study site, nurses and corpsmen work day shifts (7 am–7 pm) or night shifts (7 pm–7 am). Approximately half the staff rotate every ~6 weeks between the two shift types, and nurse midwives often work both types in the same week. Concurrent actigraphy and sleep-diary data were collected for 1 week in each experimental lighting condition, including 1 week of baseline assessment with standard lighting and 1 week of exposure to a novel lighting intervention. Participants included one male administrator (scheduled Monday to Friday, 3 pm–11 pm) and 17 female nurses, midwives, and corpsmen (mean age ± SD=34.2±7.8 years).
Data from each participant were from one shift type only throughout the entire experiment (eight day workers, one admin, nine night workers) and included days off. Due to the atypical shift type of the single administrator, data from that participant were included in some but not all analyses (see Methods section for more detail). Two additional participants did not meet the data quality inclusion criteria. Participants reported no colorblindness or other vision conditions, with the exception of corrected vision (three day workers, one admin, and four night workers).
Diary
Participants completed a modified version of the CSD-M each day upon awakening from their primary rest interval. Four novel questions were added, eliciting information on visual perception of light in both sleeping and waking environments. As participants were shift workers and thus slept at all hours of the day, we used the terms bedtime (BT) and wake time (WT), rather than “night” and “morning”, for the beginning and end of each rest interval. Data from 194 and 193 rest intervals were included in BT and WT analyses, respectively, with roughly equal proportions from exclusively day workers and exclusively night workers. Sample sizes for each analysis by shift type are included in Tables S1–S3.
Questions were developed and reviewed by subject-matter experts in the area of photobiological effects of light on humans (GLG, EMH, and SAI) and examined for clarity and readability by nonexperts. Preliminary results from a pilot study were promising and were used to further refine the questions, including modifying the style from open-ended to check-box format.45 Revised questions were subjected to Lexile analysis.38 Questions for the BT environment were: 1) After turning off the light, was there any light still visible in your room? 2) If you answered “yes”, would you describe the light source as artificial (eg, lamp or ceiling fixture), natural (eg, sun, stars, or moon), or both? 3) Were you able to see objects in your room? and 4) If you answered “yes”, did visible objects appear to be in shades of gray or in color (even if less vivid)? Questions regarding the waking environment were identical, with the following prompt: “When you woke up for the day . . .” Within the text of this manuscript, we refer to these questions as Q1–Q4 and Q5–Q8 for the BT and WT environments, respectively. However, in the actual diaries administered, these questions were assigned numbers based on the logic of the extant sequencing in our version of the diary.
During the study, four self-reported measures38 were used to assess sleep as a function of responses to the previously described light questions: sleep-onset latency (SOL, minutes), wake after sleep onset (WASO, minutes), total sleep time (TST, minutes), and sleep quality (very poor [1] to very good [5]). As light just prior to WT was not expected to affect sleep latency of the previous night, SOL was assessed as a function of the four BT responses only (Q1–Q4).
Actigraphy
Each participant wore either the Actiwatch 2 or Actiwatch Spectrum on their nondominant wrist, and was instructed not to cover the Actiwatch with clothing or bedding. Activity was recorded at 30-second epoch lengths. Automated rest intervals were created in the affiliated software (Actiware version 6.0.9) on the settings medium threshold, 5 minutes each for sleep and waking determinations. Intervals were examined by two trained scorers for concordance within 30 minutes of diary BT/WT. Times when the watch was noted in the diary as “off-wrist” were excluded from analysis. When concordance was not achieved, manual adjustments were made by setting rest-interval start and end times at the outside of five consecutive intervals of light at 1 lux and/or activity at 0 counts, as described in the scoring hierarchy created by Patel et al.46 While the CSD-M asks about the daily timing and frequency of naps, no light questions during naptime sleep were added to our modified version. Therefore, reported naps were excluded from analyses for this substudy.
In practice, some mismatch between diary and activity patterns is to be expected. For this study, reasonable concordance between the watch and diary was crucial for analysis, given that we were examining the diary responses pertaining to light in the BT and WT environments. As such, data for any intervals wherein either the photosensor or activity-based times did not agree within 2 hours of the diary (for either the start or stop of the rest interval) were deemed unreliable and excluded from analyses (21 intervals total across 9 participants). Further, a participant had to have had at least four rest intervals (two from each experimental lighting condition) to be included in analyses. Actigraphy-derived measures (SOL, WASO, TST, and sleep efficiency [SE]) were used to quantify sleep for each rest interval. As with the diary responses, sleep latency was only assessed relative to BT responses.
Light in the environment was measured using the Actiwatch photosensors and quantified to examine the sensitivity of the diary questions relative to objective light measures. As absolute light levels derived from Actiwatch photosensors may not accurately reflect circadian input,22,36 and because raw illumination values can vary by orders of magnitude and thus render averages less meaningful, we utilized the time above light threshold (TALT) variable in Actiware. The TALT variable returns the number of minutes within the defined interval that the light exceeds a user-defined threshold. The number of minutes of light exposure above a certain threshold is frequently used to assess light levels in the field in sleep and circadian research.47–53 As the questions specifically pertained to perception of light immediately before sleep initiation and upon awakening, and ipRGCs integrate light over time, we examined a TALT of 10 lux (TA10) for both the 2-hour and 1-hour intervals inside each of the rest-interval start and stop times for each participant (eg, for a rest interval from 10 pm to 6 am, we examined TALT from 10 pm to 12 am and 4 am to 6 am, as well as 10 pm–11 pm and 5 am–6 am; Figure 2).
 | Figure 2 Actigram from a participant working day shifts (7 am–7 pm). Notes: Time is represented from noon to noon on the x-axis, with days represented on the y-axis. Black markings and thin yellow lines denote activity and light levels across the day, respectively. Rest intervals appear in light blue, with sleep onset and offset represented as dark blue vertical lines, with blue shading between. Red markings appear underneath the activity when identified by the Actiware algorithm as “wake”. Yellow and orange bars above the rest-interval start and stop times indicate the 1- and 2-hour windows of the photosensor analyses. |
Analysis
Primary data analyses were performed on all rest intervals using mixed linear models in SPSS 23.0 (IBM, Armonk, NY, USA), with subject as a random factor and question response as a fixed factor. As this data set was drawn from a larger intervention study that included two experimental lighting conditions and two different major shift types, main effects of both condition and shift and a shift–response interaction were included in original models of diary responses to the light-related questions (Supplementary materials). No main effects of condition were found (all P>0.08). A main effect of shift type (day vs night) on TST was found for one variable only: visibility of color at BT (P<0.05); therefore, shift type and its interaction with item response were included in that model. Data from the single administrator were not included in any model that included shift type, and means for all outcome variables for that participant fell well within a single SD (on average, only 32.7% of the SD of the sample; see Supplementary material for means and frequencies by shift type). Estimated marginal means are reported; chi-squared analyses were performed on response frequency data. All statistical tests were evaluated at the P<0.05 α-level, and Bonferroni adjustments were made when performing multiple comparisons.
Additionally, there were a few isolated rest intervals where one or more diary sleep responses were missing or unquantifiable (ie, reported as “unknown” or “a while”; one SOL and nine WASO responses), which contributed to small differences in overall sample sizes between analyses. When responses were inconsistent with previous responses (eg, a participant reported no light in the sleeping environment for Q1 but endorsed “natural” for Q6), responses were excluded from analyses (two responses for two rest intervals total, Figure 3). Cases with missing values were excluded pairwise, and sample sizes are reported in the tables. Finally, our light-based questions and instructions were submitted to Lexile analysis (http://lexile.com/analyzer), as was the original CSD.38
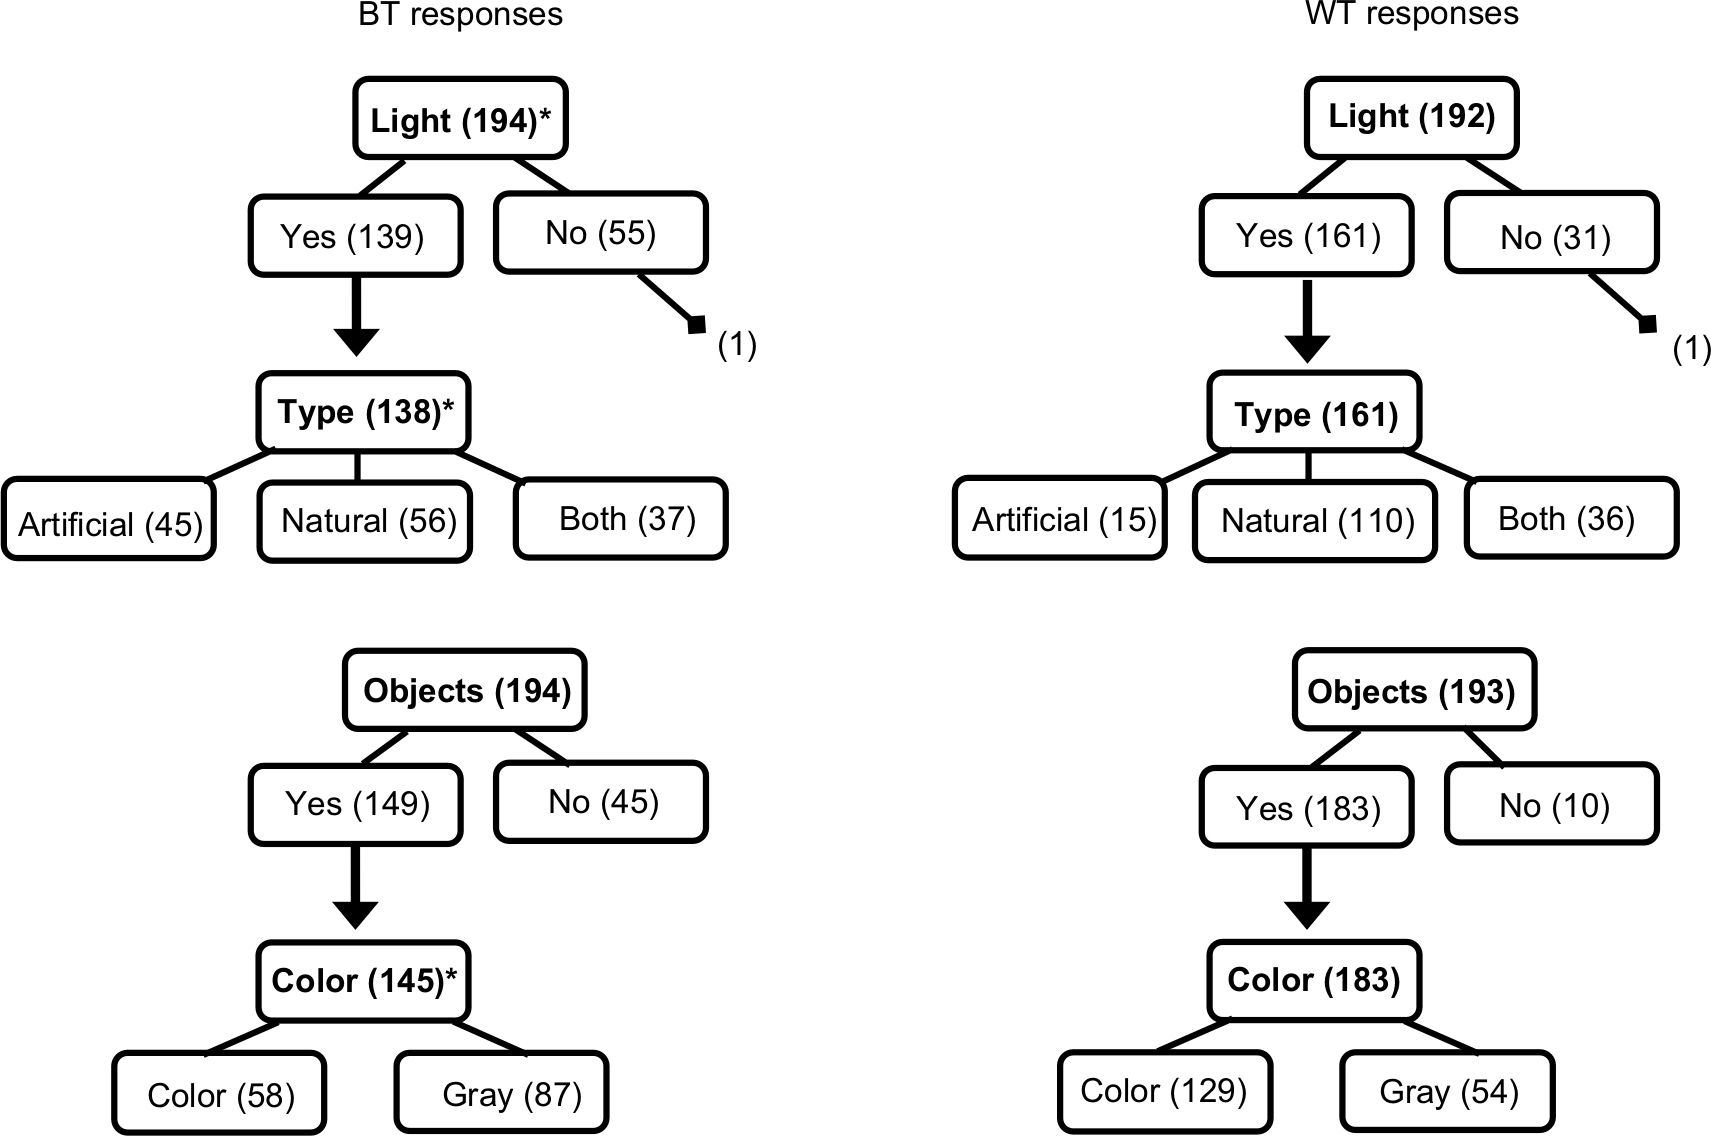 | Figure 3 Flowchart of response frequencies for the four light questions at BT and WT. Notes: Bolded text is used for questions and unbolded text for responses. Numbers in parentheses indicate the number of individuals who responded to that item. An asterisk denotes P<0.05 for differences in TA10 for the 2-hour interval post- and pre-BT and WT, respectively, by response (see Table 1 for means). Parenthetical values outside boxes are erroneous or logically inconsistent responses that were excluded from analyses (see “Methods” section for details). Abbreviations: BT, bedtime; WT, wake time; TALT, time above light threshold; TA10, TALT of lux. |
Results
Lexile analysis
Lexile analysis revealed that the text of the novel questions corresponded to fifth-grade reading levels (~10–11 years of age; 700–800 for BT, 800–900 for WT). Mean sentence length for questions was 11.50 and 11.83 words for BT and WT, respectively. Instructions corresponded to third-grade reading levels (8–9 years of age; 500–600), with a mean sentence length of 12.50 words. While these sentence lengths and Lexile scores are somewhat higher than those reported for the CSD-M, values are comparable to those of the core diary (CSD) instructions.
Response frequencies
With regard to the BT environment, light was reported in 139 of 194 cases (71.6%), with 40.6%, 32.6%, and 26.8% of light reported as natural, artificial, or both, respectively (Figure 3). Objects were reported as visible in 149 of 194 (76.8%) cases, and 40.0% of those reportedly appeared in color. For the waking environment, light was reported in 161 of 192 cases (83.9%), with 68.3%, 9.3%, and 22.4% reported as natural, artificial, or both, respectively. Objects were reported as visible in the waking environment for 183 of 193 (94.8%) cases, 70.5% of which reportedly appeared in color.
Additionally, responses differed between BT and WT. Light was reported more frequently upon waking than at BT (χ21=8.30, P<0.01), and light was more likely to be natural than artificial or both (χ22=30.99, P<0.001; both post hoc tests P<0.05). Similarly, there was higher reporting of objects being visible in the waking environment (χ21=25.75, P<0.001), and those objects were more likely to appear in color (χ21=30.69, P<0.001). Further, a majority of participants who completed both BT and WT light questions (Q1 and Q5) had dynamic responses for one or more of them across the study period (eg, reported light on some nights, but not on others; 12 of 18 or 66.7%). Across all subjects, more variation occurred for WT responses: BT responses varied for only 7 of 18 participants, whereas WT responses varied for 10 of 18, though this difference did not reach significance (χ21=1.00, P=0.32). For all four items, standard errors in outcome measures tended to be higher for the same question for WT than BT (for TALT values, P<0.01; for objective sleep measures, P<0.05; for subjective measures, P=0.10).
Reported light and photic illumination
BT environment (Q1–Q4)
For the 2-hour interval after BT, we found greater TA10 when light was reported, when that light was artificial, and when color was reported (Table 1, all P<0.05). No relationship was found between the object question (Q3) and TA10 (P=0.15). When the 1-hour interval was examined, these findings were replicated for the light (Q1) and type of light question (Q2; both P<0.05), and no statistically significant relationship was found for either the object or color question (both P>0.07).
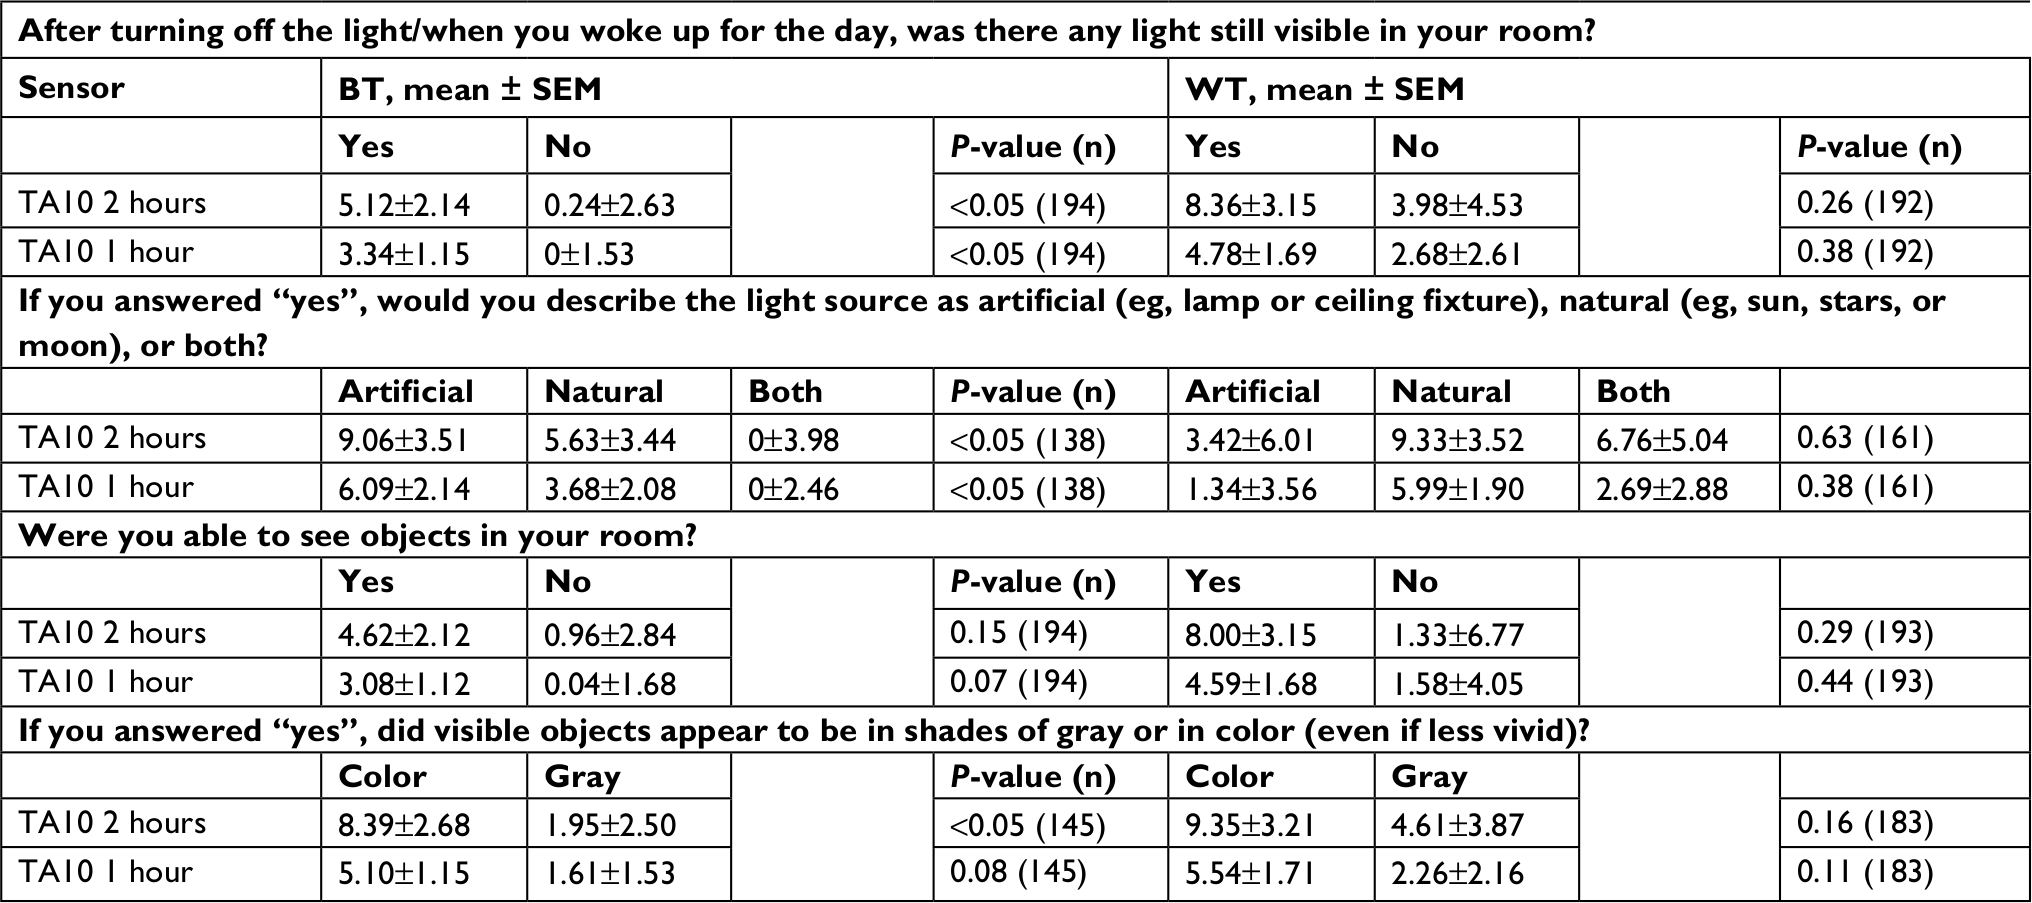 | Table 1 Reported light and photopic illumination (TA10) Notes: Responses to BT and WT light questions and corresponding estimated marginal mean light values ± SEM for each response. Light questions and responses shown by column, organized by BT and WT. TA10 refers to time above light threshold of 10 lux, in minutes, measured in the 1- and 2-hour intervals inside BT and WT. See Table S1 for frequencies, means, and analyses by shift type. Abbreviations: BT, bedtime; WT, wake time; TALT, time above light threshold; TA10, TALT of 10 lux. |
WT environment (Q5–Q8)
No relationship between the WT questions and any measure of light was found (all P>0.11). BT and WT as a function of reported type of light were examined. The average BTs for rest intervals wherein no light or only artificial light was reported were 10:52 pm and 11:24 pm, respectively. By contrast, the average BT for rest intervals where natural light was reported was in the morning—at 6:54. For intervals wherein both were reported, it fell between, at 2:35 am. Similarly, the average WTs were 4:59 am and 4:49 am for no light and artificial light, respectively. By contrast, the average WT for rest intervals where natural light was reported was in late morning, at 10:35, and even later, 11:19 am, when both were reported in the waking environment.
Reported light and objective sleep
BT environment (Q1–Q4)
Responses to all questions about light in the sleeping environment related to actigraphy-based TST (Table 2). TST was higher when no light was reported (P<0.001), when objects were not reported as visible (P<0.01), and when visible objects were reported as appearing in shades of gray, rather than in color (P<0.05). When light in the sleeping environment was reported, TST was higher when that light was artificial as compared to natural (P<0.05). Neither WASO, SE, nor SOL varied by response to any of the four BT questions (all P>0.12).
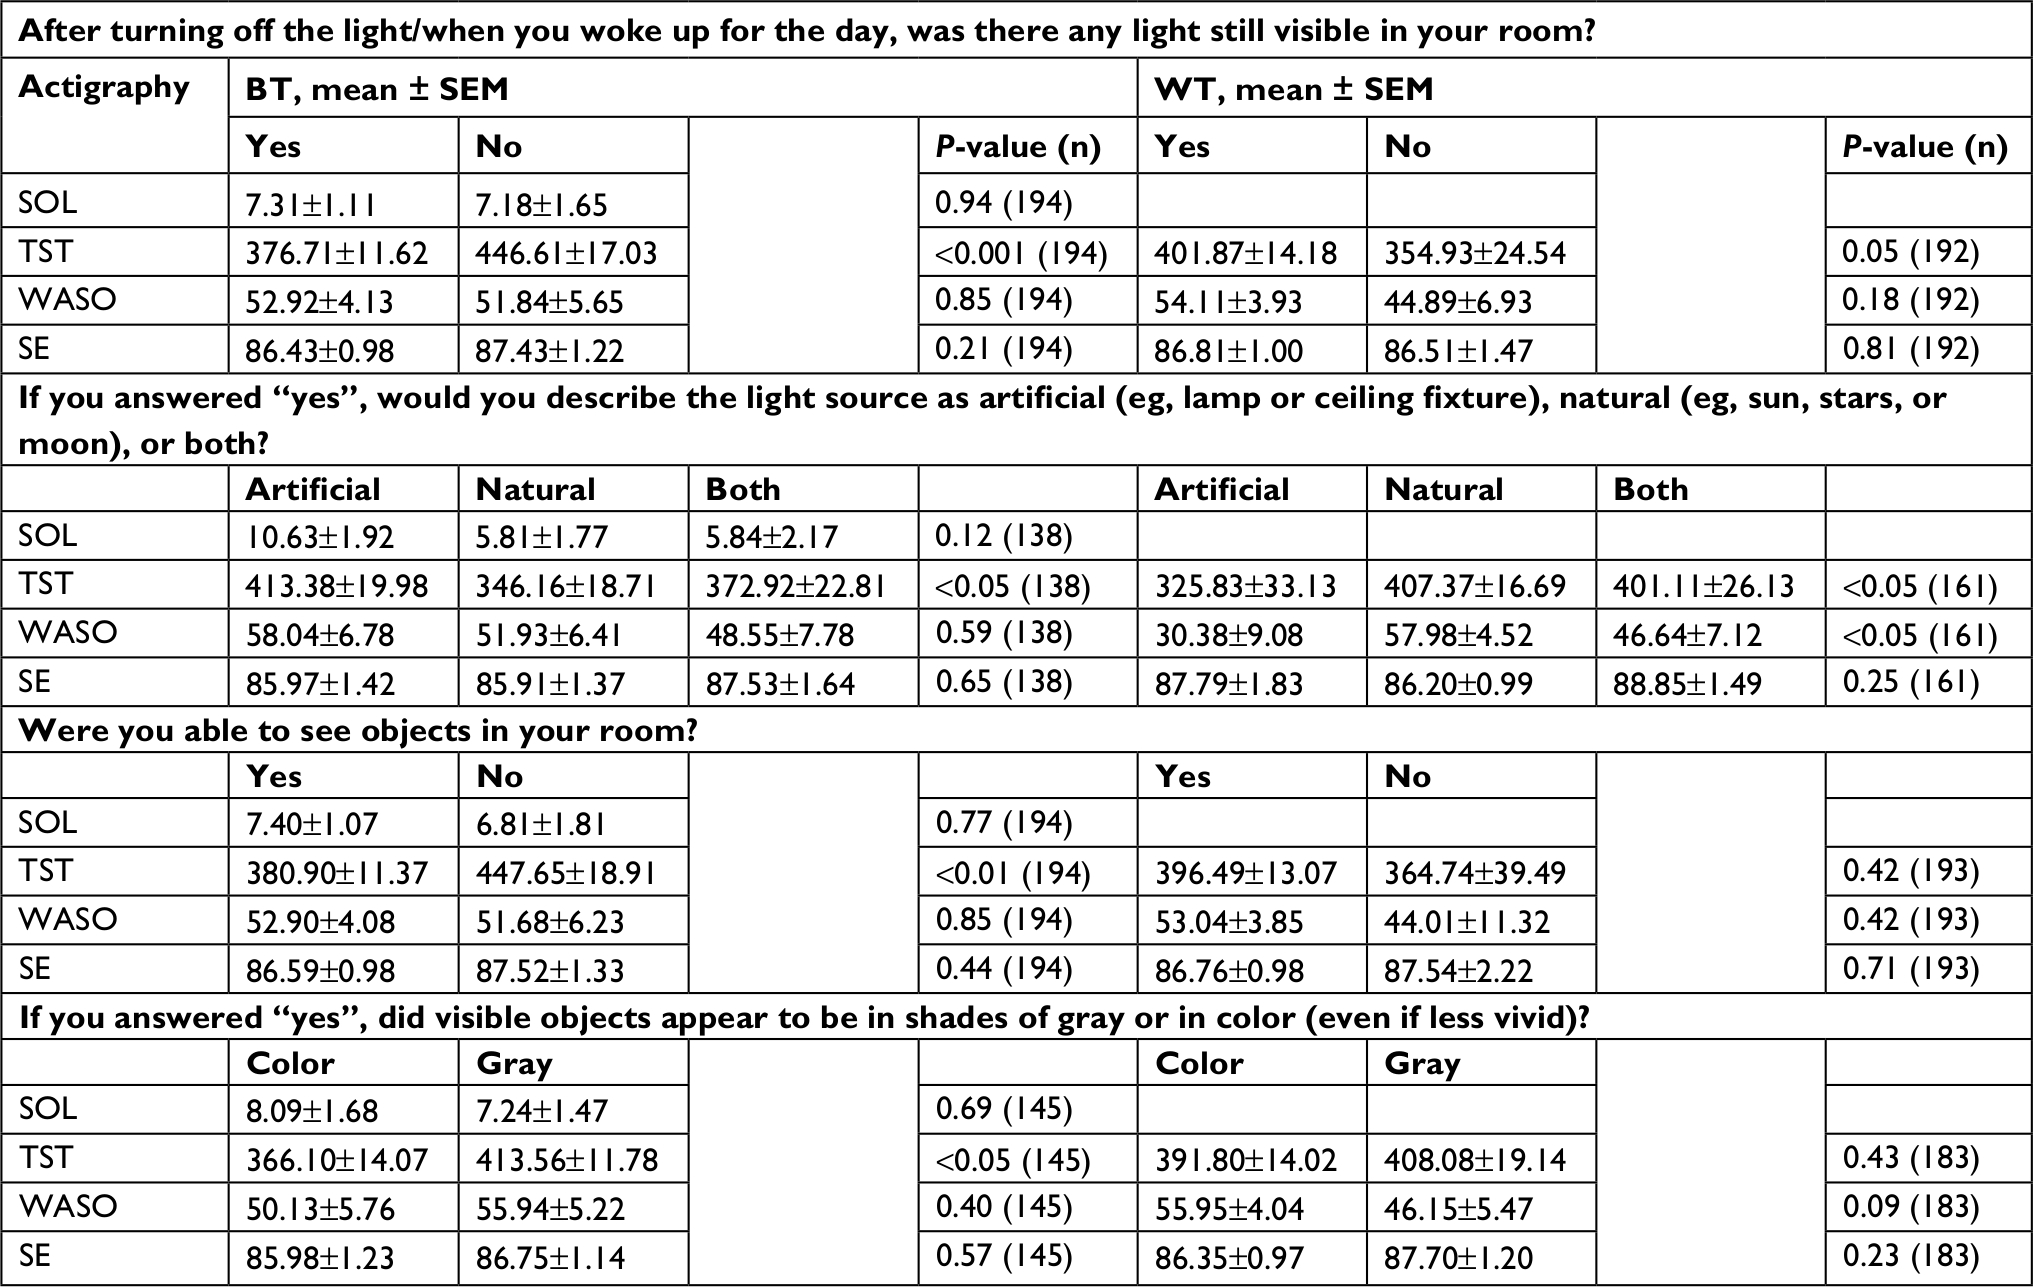 | Table 2 Reported light and objective sleep Notes: Responses to light questions and corresponding estimated marginal means of actigraphy-based sleep variables ± SEM for each response. Responses to light questions are shown by column, organized by BT and WT, and sleep variables are shown in rows. See Table S2 for frequencies, means, and analyses by shift type. Abbreviations: BT, bedtime; WT, wake time; SOL, sleep-onset latency; TST, total sleep time; WASO, wake after sleep onset; SE, sleep efficiency. |
WT environment (Q5–Q8)
With regard to the waking environment, TST was lower when artificial light was reported than either natural light or both (both P<0.05). WASO, which is dependent upon TST, was higher in natural light than in artificial light (P<0.05). No other relationships between reported light in the waking environment and objective sleep were found (all P>0.09).
Reported light and subjective sleep
BT environment (Q1–Q4)
Largely consistent with objective actigraphy results, BT responses were related to TST for three of the four BT questions (Table 3). Diary-based TST was higher when no light was reported (P=0.001), when objects were reported as not visible (P<0.05), and when visible objects were reported as appearing in shades of gray, rather than in color (P<0.01). In addition, reported sleep quality was higher when no light was reported (P<0.01) and when objects were reported as not visible (P<0.01). No other analyses were statistically significant (all P>0.11).
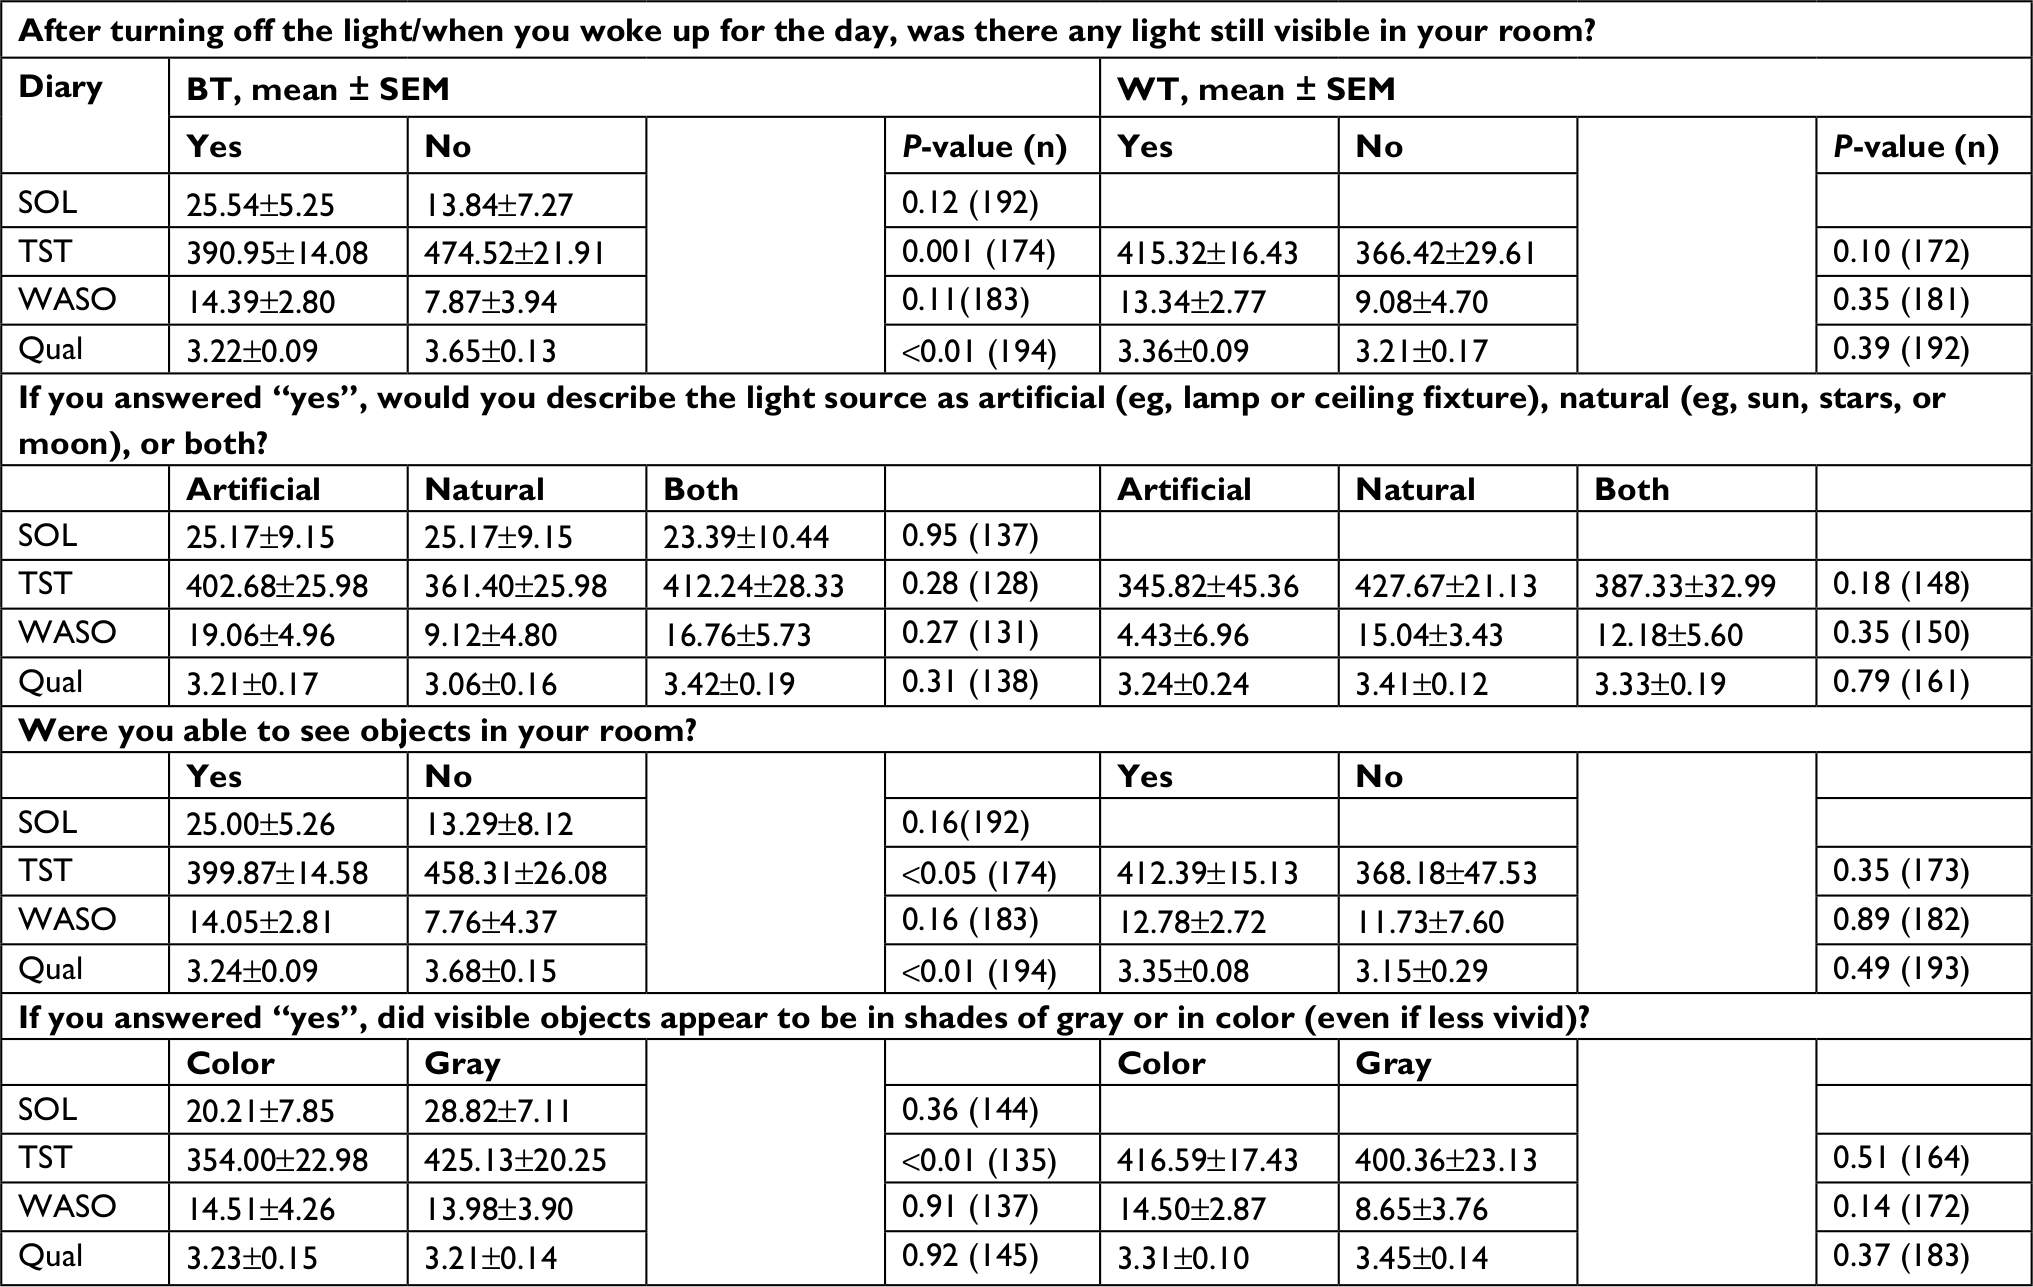 | Table 3 Reported light and subjective sleep Notes: Responses to light questions and corresponding estimated marginal means of diary-based sleep variables ± SEM for each response. Responses to light questions shown by columns, organized by BT and WT, and sleep variables are shown in rows. Reported SOL, TST, WASO, and Qual on a scale from 1 to 5. See Table S3 for frequencies, means, and analyses by shift type. Abbreviations: BT, bedtime; WT, wake time; SOL, sleep-onset latency; TST, total sleep time; WASO, wake after sleep onset; Qual, quality. |
WT environment (Q5–Q8)
There were no relationships found between self-reported sleep measures and reported light in the waking environment (all P>0.10). Subjective measures of sleep were positively related to their respective objective measures in our experiment (both P<0.05 for SOL/SOL and WASO/WASO; P<0.01 for SE/sleep quality; P<0.001 for TST/TST). Reported BTs for day and night workers between consecutive workdays were 10:37 pm and 9:24 am, respectively, and average WTs were 5:20 am and 3:20 pm. Between consecutive days off, average BTs were 11:06 pm and 12:25 am for day and night workers, respectively, and average WTs were 9:14 am and 9:22 am.
Discussion
The addition of only a few items to existing sleep diaries provides meaningful information about light in the sleep environment, which may in turn have implications for both subjective and objective measures of sleep and related outcomes. Responses to our four additional questions, specifically those regarding perceived light, light source, and perceived color, corresponded to differences in objective quantification of light levels in the sleeping environment, suggesting external validity (Table 1). Our findings regarding average BT and WT for those reporting natural light in the sleeping environment also support the external validity of the questions. Although responses were completed at WT and thus more temporally linked to WT-photosensor data, we found no statistically significant relationships between WT responses and photosensor light measures. However, mean patterns were similar to those observed for BT. Variability was higher for the same question for WT than BT, and sample sizes were less equal across a given question for WT responses than they were for BT (Figure 3), with more light, natural light, objects, and color reported at WT. It is thus possible that with a larger sample size, we might see correspondence between WT responses and light measurements as well.
We also demonstrated that the questions were sensitive to changes in the environment within the same individual. For the majority of respondents, responses differed both from BT to WT and across days. Therefore, these daily questions were more sensitive to change than a one-time questionnaire regarding light in the typical sleeping environment (eg, the National Sleep Foundation’s 2014 Sleep in America Poll).1,55 This sensitivity was supported also by our findings of more frequent reports of light, natural light, objects, and color in the waking environment than the BT one. Additionally, there were very few logically incompatible responses (eg, describing light source after endorsing “no light”), which suggests that the questions are sound and the wording and instructions sufficiently clear. The results of the Lexile analysis also indicated a reasonable level of text complexity. Further, given the hierarchical nature of our questions, we expected that the number of individuals who endorsed a type of light would be equal to or fewer than those who endorsed any light, and that fewer would endorse color than objects. This expected pattern held, suggesting the questions have some internal consistency (Figure 3).
Importantly, responses to these questions appear to relate to clinically relevant measures of both self-reported and actigraphy-derived sleep variables (Tables 2 and 3). This may be a consequence of the timing of sleep relative to the solar day, but may also reflect acute, alerting, or phase-shifting effects of light. As our study population consisted of shift workers, BT and WT were highly variable in our population. Consistently, however, sleep appears to be better with less reported light in the sleeping environment.
Several additional interesting findings emerged from this study regarding the relationship between reported light in the sleeping environment and sleep itself. For example, objective TST was longer for individuals who reported artificial light in the sleeping environment rather than natural (Table 3). This likely relates to the finding that individuals reporting artificial light in the sleeping environment had a much more “typical” nighttime BT around 11 pm, whereas those reporting natural light were going to bed in the early morning, averaging around 7 am.
In terms of the waking environment, TST was shorter in duration when artificial light was reported, likely a reflection of the earlier WT for those reporting artificial light in the waking environment. While WASO, generally considered to be a measure of sleep disturbance, was ~30 minutes higher when natural rather than artificial light was reported in the waking environment, it is dependent upon TST and thus may reflect the higher (~+1.25-hour) TST in those reporting natural light upon waking (ie, with a longer sleep interval, there is less homeostatic sleep pressure and more opportunity for wakefulness during sleep). While the pattern of sleep results we found may reflect the shift-working composition of our sample, particularly for the type of light questions (Q2 and Q6), results were robust and consistent across both subjective and objective sleep measures, especially for questions regarding the sleeping environment (Tables 2 and 3). Further, while our data were collected before and after a lighting intervention, which could potentially affect sleep outcomes (but not our primary outcome, objective light measures), this was accounted for in our modeling.
Our findings suggest modern sleeping environments often include the presence of some light, which is consistent with previous reports (89%)1 and underscores the utility of assessing ambient light as it pertains to sleep hygiene and health. The slightly lower frequencies we found here of light in 71.6% of BT environments and 83.9% of WT environments may reflect differences in methodology. Specifically, our unique shift worker population is likely to employ more heterogeneous BT sleep strategies, and our real-time nightly measures may capture more detail than a general retrospective description of a “typical” night. Further, we selected a window of 1–2 hours after and before BT and WT, respectively, to capture the home-lighting environment. Given the inaccuracy inherent in using subjective reporting, as well as the circadian system’s slow integration of light information over time, a relatively large window of time surrounding BT and WT seemed appropriate; however, it is possible that the results observed here would differ if a smaller window were used.
We did not specifically ask individuals to describe the specifications of the artificial light source, as we did not wish to make the diary much longer, and prior work examining the validity of a subjective light question found specific details regarding the artificial light source did not add significant value.42 It remains possible, however, that the addition of such information may provide further benefit, depending on the reason for assessment. For example, with the emergence of new lighting technologies (eg, light-emitting diodes) that have more variable spectral characteristics, this information may become increasingly useful.
Our study was not specifically designed to test the validity of the diary, and consequently it was somewhat underpowered. Because the light questions were interdependent (eg, respondents cannot answer questions about the source of light if there is no light visible), samples were smaller for the light source and object questions and smallest for the questions regarding color, which requires endorsement of seeing objects (and likely light). Therefore, diary responses regarding light in the sleeping environment may relate more closely to objective measures than what we have reported here. Additional future steps should include the refinement, removal, and/or addition of light-focused questions. For example, a graded response, rather than a binary choice, would provide more information as to how vividly colors appear. Additionally, because we based our diary on the CSD-M, all of our responses, including those regarding light in the BT environment, were collected in the morning. However, the fact that we found a stronger relationship between objective light measures and the sleeping environment (rather than the waking), seems to argue against this as a limitation.
As mentioned earlier, Actiwatch photosensors are not the optimal photosensors to determine the precise relationship between participant-reported and objective estimates of light exposure. In particular, for examining light exposure during sleep, the watches can become covered by bedclothes, and thus an additional photosensor on a bedside table may provide more reliable measures of photic exposure during sleep. While we did ask participants to keep the actigraphy watches uncovered, it is probable that some devices were covered periodically during measurement. However, there is no reason to suspect that this occurred in any systematic way, and this is supported by the fact that we were able to discern differences between response conditions (eg, more minutes of measured light >10 lux when individuals reported perceiving light than when they did not). Further, while covered photosensors might lead to an underestimation of the amount of light in the environment and thus to reduced correspondence between subjective and objective measures, they could not result in any false-positive findings. In addition, while the TALT variable was the best choice for this equipment, additional and more accurate measures would be useful for future studies. Other research has also used thresholds for the field measurement of light as a way of handling the accuracy issue. For example, a recent study found that dim-light melatonin onset in the laboratory was related to the timing of first exposure to light both >10 and >180 lux in the home,54 and other studies have used thresholds of 10 lux to represent exposure to dim light.50
Further work should also control for or take into account objectively measured visual function, including assessment of acuity and/or colorblindness, as well as yellowing of the lens that occurs with age, though the latter was not a concern in our relatively young population. Finally, the use of shift workers (and primarily female nurses) in this study could be considered a limitation in terms of generalizability; however, the shift worker population may also be perceived as an asset. Statistically significant relationships were found between our questions and objective light measures, even in individuals working and sleeping at different times of day, not just at night. As such, these questions appear to be robust, flexible, and may not require significant adaptation for future use in other populations. Nonetheless, future research should examine multiple versions of the diary in both shift working populations and those working more standard daytime schedules, as well as including a better balance of males and females. A study designed explicitly to test the utility of these new questions about light should also include multiple time points of reporting and more accurate photosensors (including those capable of measuring spectral composition) in the direction of gaze and at the level of the eyes.
Conclusion
In sum, our data suggest that questions eliciting information on subjective light in the sleeping environment can be integrated easily into sleep diaries, are related to objective light measures, and are related to objective and subjective measures of sleep. These questions are thus likely to have utility when examining sleep-related outcomes for both research and clinical purposes. As these questions about light are a tool that can be employed easily at little or no cost, we felt that the relationships demonstrated here warranted reporting so that future experiments of the size and scope required to refine this sleep-diary enhancement can be designed and implemented.
Acknowledgments
The authors would like to thank LCDR Virginia Sullivan, LT Melissa Schmidt, and the nursing staff of the NMCSD Labor and Delivery Department for their valuable participation and time. Cora Dyslin, Jianna Sode, Emily Schmidt, and Kyle O’Donnell also provided assistance with project execution and analysis. Additional thanks go to CAPT Jacqueline Rychnovsky and CAPT Gerard DeMers for facilitating this project. This work was supported by the TriService Nursing Research Program grant #N16-503 under work unit no. N1618 and the Department of Energy Solid State Lighting Division award #DE-EE0008206.
Disclosure
SAI consults for Merck, Eisai, Purdue, and Pfizer. GLG reports that through University of California, San Diego, she has received equipment, advice or financial support, and/or served as a consultant to Philips, Litebook, BIOS Lighting, Flux, PennWell Corporation, LightShow West, and Well Building Institute, and that she holds two currently issued patents (USPTO 7,678,140 and 8,366,755) and two continuing patent applications (USPTO 15/085,522 and 14/273,971). The authors report no other conflicts of interest in this work.
References
2014 Sleep in America Poll: Sleep in the Modern Family; 2014. Available from: https://sleepfoundation.org/sites/default/files/2014-NSF-Sleep-in-America-poll-summary-of-findings-FINAL-Updated-3-26-14-.pdf. Accessed June 11, 2018. | ||
Chang AM, Aeschbach D, Duffy JF, Czeisler CA. Evening use of light-emitting eReaders negatively affects sleep, circadian timing, and next-morning alertness. Proc Natl Acad Sci USA. 2015;112(4):1232–1237. | ||
Rahman SA, St Hilaire MA, Chang AM, et al. Circadian phase resetting by a single short-duration light exposure. JCI Insight. 2017;2(7):e89494. | ||
Brainard GC, Hanifin JP, Greeson JM, et al. Action spectrum for melatonin regulation in humans: evidence for a novel circadian photoreceptor. J Neurosci. 2001;21(16):6405–6412. | ||
Cajochen C. Alerting effects of light. Sleep Med Rev. 2007;11(6):453–464. | ||
Meijer JH, Michel S, Vanderleest HT, Rohling JH. Daily and seasonal adaptation of the circadian clock requires plasticity of the SCN neuronal network. Eur J Neurosci. 2010;32(12):2143–2151. | ||
Glickman GL, Webb IC, Elliott JA, et al. Photic sensitivity for circadian response to light varies with photoperiod. J Biol Rhythms. 2012;27(4):308–318. | ||
Glickman GL, Harrison EM, Elliott JA, Gorman MR. Increased photic sensitivity for phase resetting but not melatonin suppression in Siberian hamsters under short photoperiods. Horm Behav. 2014;65(3):301–307. | ||
Harrison EM, Gorman MR. Rapid adjustment of circadian clocks to simulated travel to time zones across the globe. J Biol Rhythms. 2015;30(6):557–562. | ||
Evans JA, Elliott JA, Gorman MR. Circadian effects of light no brighter than moonlight. J Biol Rhythms. 2007;22(4):356–367. | ||
Yan L, Silver R, Gorman M. Reorganization of suprachiasmatic nucleus networks under 24-h LDLD conditions. J Biol Rhythms. 2010;25(1):19–27. | ||
Boivin DB, Duffy JF, Kronauer RE, Czeisler CA. Dose-response relationships for resetting of human circadian clock by light. Nature. 1996;379(6565):540–542. | ||
Takahashi JS, Decoursey PJ, Bauman L, Menaker M. Spectral sensitivity of a novel photoreceptive system mediating entrainment of mammalian circadian rhythms. Nature. 1984;308(5955):186–188. | ||
Nelson DE, Takahashi JS. Sensitivity and integration in a visual pathway for circadian entrainment in the hamster (Mesocricetus auratus). J Physiol. 1991;439(1):115–145. | ||
Zeitzer JM, Dijk DJ, Kronauer R, Brown E, Czeisler C. Sensitivity of the human circadian pacemaker to nocturnal light: melatonin phase resetting and suppression. J Physiol. 2000;526(Pt 3):695–702. | ||
Thapan K, Arendt J, Skene DJ. An action spectrum for melatonin suppression: evidence for a novel non-rod, non-cone photoreceptor system in humans. J Physiol. 2001;535(Pt 1):261–267. | ||
Hut RA, Oklejewicz M, Rieux C, Cooper HM. Photic sensitivity ranges of hamster pupillary and circadian phase responses do not overlap. J Biol Rhythms. 2008;23(1):37–48. | ||
Minors DS, Waterhouse JM, Wirz-Justice A. A human phase-response curve to light. Neurosci Lett. 1991;133(1):36–40. | ||
Ancoli-Israel S, Martin JL, Blackwell T, et al. The SBSM guide to actigraphy monitoring: clinical and research applications. Behav Sleep Med. 2015;13(Suppl 1):S4–S38. | ||
de Zambotti M, Godino JG, Baker FC, Cheung J, Patrick K, Colrain IM. The boom in wearable technology: cause for alarm or just what is needed to better understand sleep? Sleep. 2016;39(9):1761–1762. | ||
Okudaira N, Kripke DF, Webster JB. Naturalistic studies of human light exposure. Am J Physiol Regul Integr Comp Physiol. 1983;245(4):R613–R615. | ||
Figueiro MG, Hamner R, Bierman A, Rea MS. Comparisons of three practical field devices used to measure personal light exposures and activity levels. Light Res Technol. 2013;45(4):421–434. | ||
Lucas RJ, Freedman MS, Lupi D, Munoz M, David-Gray ZK, Foster RG. Identifying the photoreceptive inputs to the mammalian circadian system using transgenic and retinally degenerate mice. Behav Brain Res. 2001;125(1–2):97–102. | ||
Hattar S, Liao HW, Takao M, Berson DM, Yau KW. Melanopsin-containing retinal ganglion cells: architecture, projections, and intrinsic photosensitivity. Science. 2002;295(5557):1065–1070. | ||
Provencio I, Rollag MD, Castrucci AM. Photoreceptive Net in the mammalian retina. This mesh of cells may explain how some blind mice can still tell day from night. Nature. 2002;415(6871):493. | ||
Allen AE, Storchi R, Martial FP, et al. Melanopsin-driven light adaptation in mouse vision. Curr Biol. 2014;24(21):2481–2490. | ||
Brown TM, Gias C, Hatori M, et al. Melanopsin contributions to irradiance coding in the thalamo-cortical visual system. PLoS Biol. 2010;8(12):e1000558. | ||
Brown TM, Tsujimura S, Allen AE, et al. Melanopsin-based brightness discrimination in mice and humans. Curr Biol. 2012;22(12):1134–1141. | ||
Spitschan M, Bock AS, Ryan J, Frazzetta G, Brainard DH, Aguirre GK. The human visual cortex response to melanopsin-directed stimulation is accompanied by a distinct perceptual experience. Proc Natl Acad Sci USA. 2017;114(46):12291–12296. | ||
Zele AJ, Adhikari P, Feigl B, Cao D. Cone and melanopsin contributions to human brightness estimation: reply. J Opt Soc Am A. 2018;35(10):1783. | ||
Ecker JL, Dumitrescu ON, Wong KY, et al. Melanopsin-expressing retinal ganglion-cell photoreceptors: cellular diversity and role in pattern vision. Neuron. 2010;67(1):49–60. | ||
Dacey DM, Liao HW, Peterson BB, et al. Melanopsin-expressing ganglion cells in primate retina signal colour and irradiance and project to the LGN. Nature. 2005;433(7027):749–754. | ||
Wong KY, Dunn FA, Berson DM. Photoreceptor adaptation in intrinsically photosensitive retinal ganglion cells. Neuron. 2005;48(6):1001–1010. | ||
Cao D, Barrionuevo PA. Estimating photoreceptor excitations from spectral outputs of a personal light exposure measurement device. Chronobiol Int. 2015;32(2):270–280. | ||
Markvart J, Hansen Åse Marie, Christoffersen J. Comparison and correction of the light sensor output from 48 wearable light exposure devices by using a side-by-side field calibration method. LEUKOS. 2015;11(3):155–171. | ||
Price LLA, Lyachev A, Khazova M. Optical performance characterization of light-logging actigraphy dosimeters. J Opt Soc Am A. 2017;34(4):545–557. | ||
Price LLA, Khazova M, O’Hagan JB. Performance assessment of commercial circadian personal exposure devices. Lighting Res Technol. 2012;44(1):17–26. | ||
Carney CE, Buysse DJ, Ancoli-Israel S, et al. The consensus sleep diary: standardizing prospective sleep self-monitoring. Sleep. 2012;35(2):287–302. | ||
Littner M, Kushida CA, Anderson WM, et al. Practice parameters for the role of actigraphy in the study of sleep and circadian rhythms: an update for 2002. Sleep. 2003;26(3):337–341. | ||
Monk TH, Reynolds CF, Kupfer DJ, et al. The Pittsburgh sleep diary. J Sleep Res. 1994;3(2):111–120. | ||
Åkerstedt T, Hume K, Minors D, Waterhouse J. The subjective meaning of good sleep, an intraindividual approach using the Karolinska Sleep diary. Percept Mot Skills. 1994;79(1):287–296. | ||
Bajaj A, Rosner B, Lockley SW, Schernhammer ES. Validation of a light questionnaire with real-life photopic illuminance measurements: the Harvard light exposure assessment Questionnaire. Cancer Epidemiol Biomarkers Prev. 2011;20(7):1341–1349. | ||
Thieden E, Philipsen PA, Wulf HC. Compliance and data reliability in sun exposure studies with diaries and personal, electronic UV dosimeters. Photoderm Photoimm Photomed. 2006;22(2):93–99. | ||
O’Riordan DL, Glanz K, Gies P, Elliott T. A pilot study of the validity of self-reported ultraviolet radiation exposure and sun protection practices among lifeguards, parents and children. Photochem Photobiol. 2008;84(3):774–778. | ||
Harrison EM, Powell AL, Yablonsky AM, Glickman GL. Reported light in the sleep environment: validity of a sleep diary. Sleep. 2017;40(Suppl 1):A61–A62. | ||
Patel SR, Weng J, Rueschman M, et al. Reproducibility of a standardized actigraphy scoring algorithm for sleep in a US Hispanic/Latino population. Sleep. 2015;38(9):1497–1503. | ||
Stothard ER, Mchill AW, Depner CM, et al. Circadian entrainment to the natural light-dark cycle across seasons and the weekend. Curr Biol. 2017;27(4):508–513. | ||
Hood B, Bruck D, Kennedy G. Determinants of sleep quality in the healthy aged: the role of physical, psychological, circadian and naturalistic light variables. Age Ageing. 2004;33(2):159–165. | ||
Tsai SY, Thomas KA, Lentz MJ, Barnard KE. Light is beneficial for infant circadian entrainment: an actigraphic study. J Adv Nurs. 2012;68(8):1738–1747. | ||
Espiritu RC, Kripke DF, Ancoli-Israel S, et al. Low illumination experienced by San Diego adults: association with atypical depressive symptoms. Biol Psychiatry. 1994;35(6):403–407. | ||
Vinzio S, Ruellan A, Perrin AE, Schlienger JL, Goichot B. Actigraphic assessment of the circadian rest-activity rhythm in elderly patients hospitalized in an acute care unit. Psychiatry Clin Neurosci. 2003;57(1):53–58. | ||
Wright KP, Mchill AW, Birks BR, Griffin BR, Rusterholz T, Chinoy ED. Entrainment of the human circadian clock to the natural light-dark cycle. Curr Biol. 2013;23(16):1554–1558. | ||
Towns SJ, Zeitzer J, Kamper J, et al. Implementation of actigraphy in acute traumatic brain injury (TBI) neurorehabilitation admissions: a Veterans Administration TBI model systems feasibility study. PM R. 2016;8(11):1046–1054. | ||
Crowley SJ, Molina TA, Burgess HJ. A week in the life of full-time office workers: work day and weekend light exposure in summer and winter. Appl Ergon. 2015;46(Pt A):193–200. | ||
McFadden E, Jones ME, Schoemaker MJ, Ashworth A, Swerdlow AJ. The relationship between obesity and exposure to light at night: cross-sectional analyses of over 100,000 women in the Breakthrough Generations Study. Am J Epidemiol. 2014;180(3):245–250. |
Supplementary materials
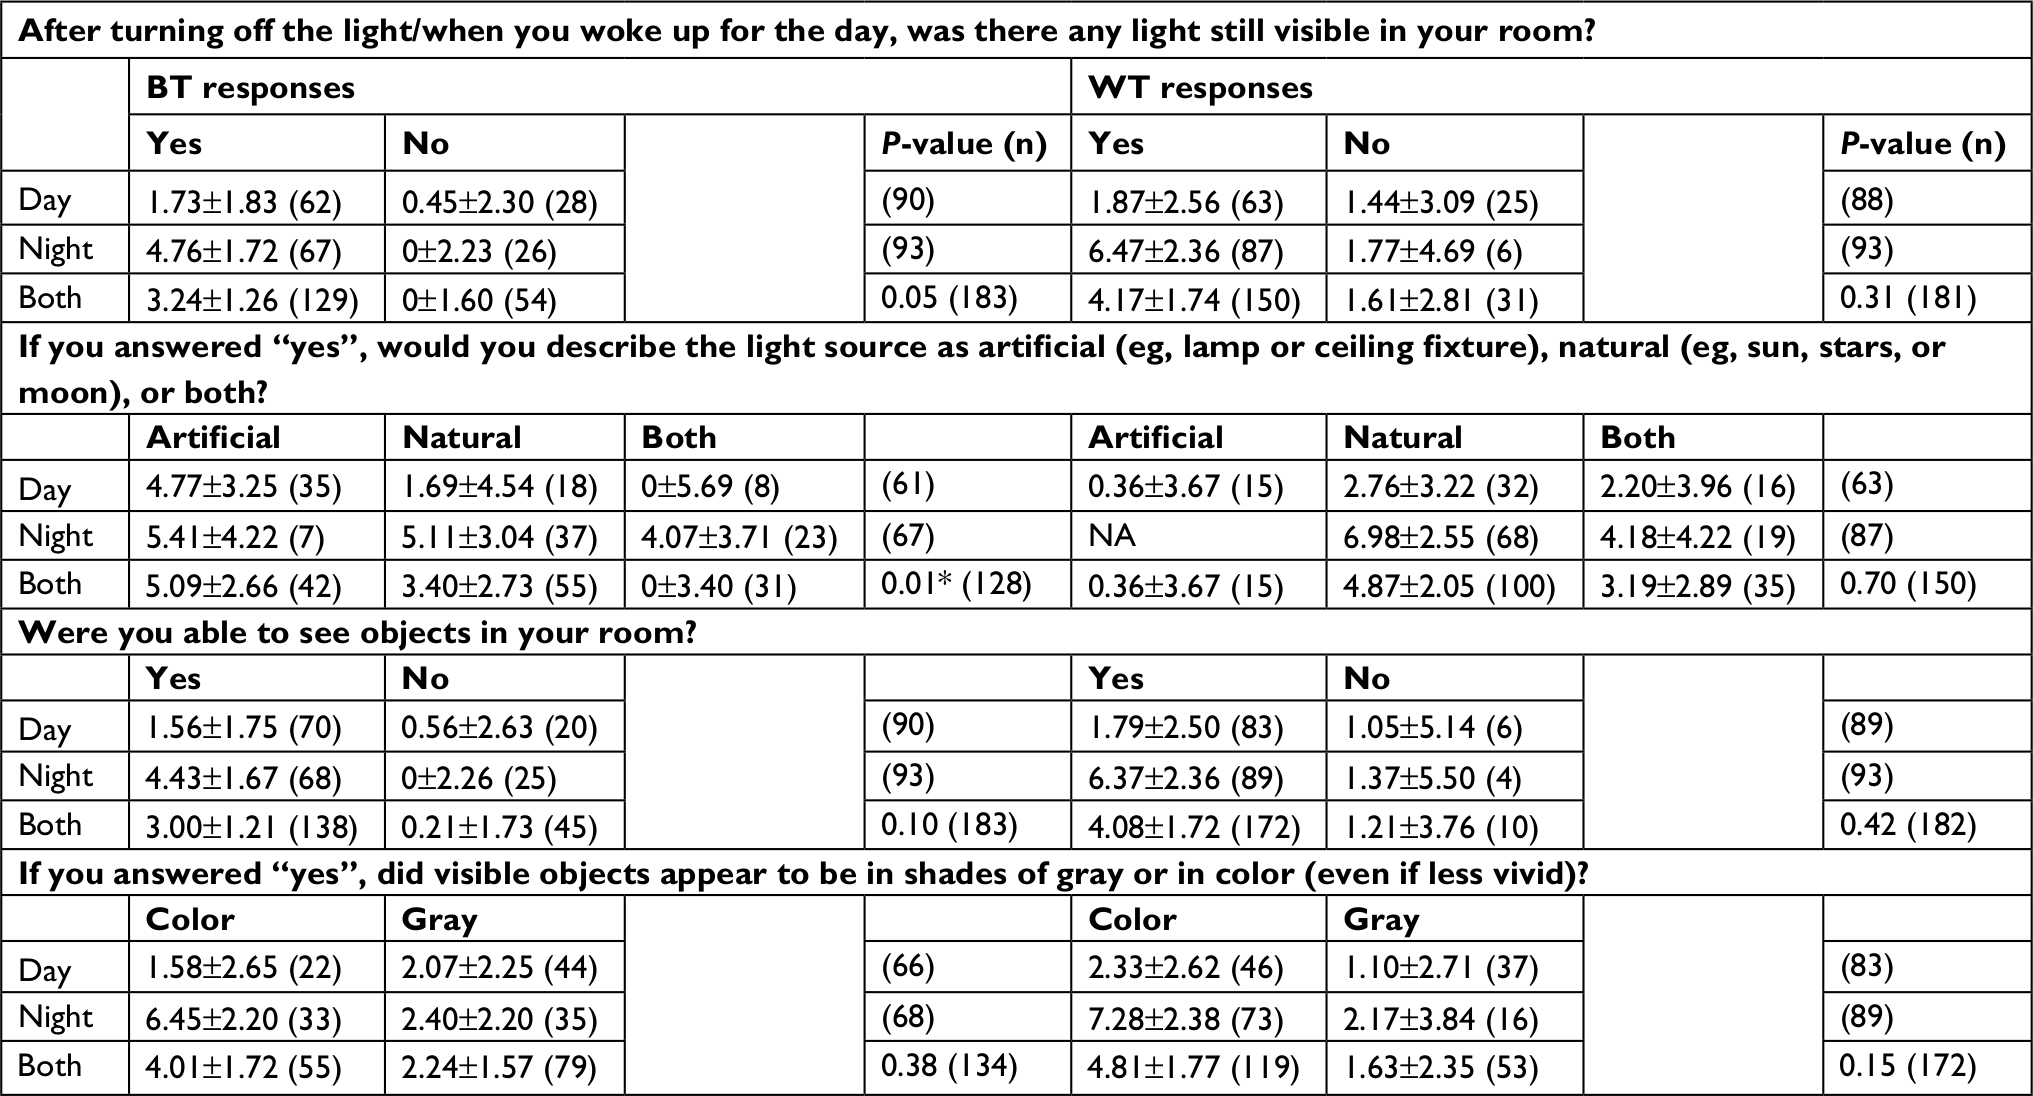 | Table S1 Reported light and photopic illumination for day- and nightshift workers (TA10) Notes: Response frequencies, estimated marginal means, errors, and P-values for main effect of response type by type of shift (day/night) for minutes above 10 lux (TA10). Light questions and responses shown by column, organized by BT and WT. TALT was measured in the 1- and 2-hour intervals inside BT and WT. Values here are for the 1-hour interval. Values vary slightly here from those reported in Table 1, due to inclusion here of only day and night workers (no administrator) and of shift and its interaction with response in all models. All P-values are for main effects for response only. *P<0.05, response–shift interaction. Abbreviations: BT, bedtime; WT, wake time; NA, not applicable; TALT, time above light threshold; TA10, TALT of 10 lux. |
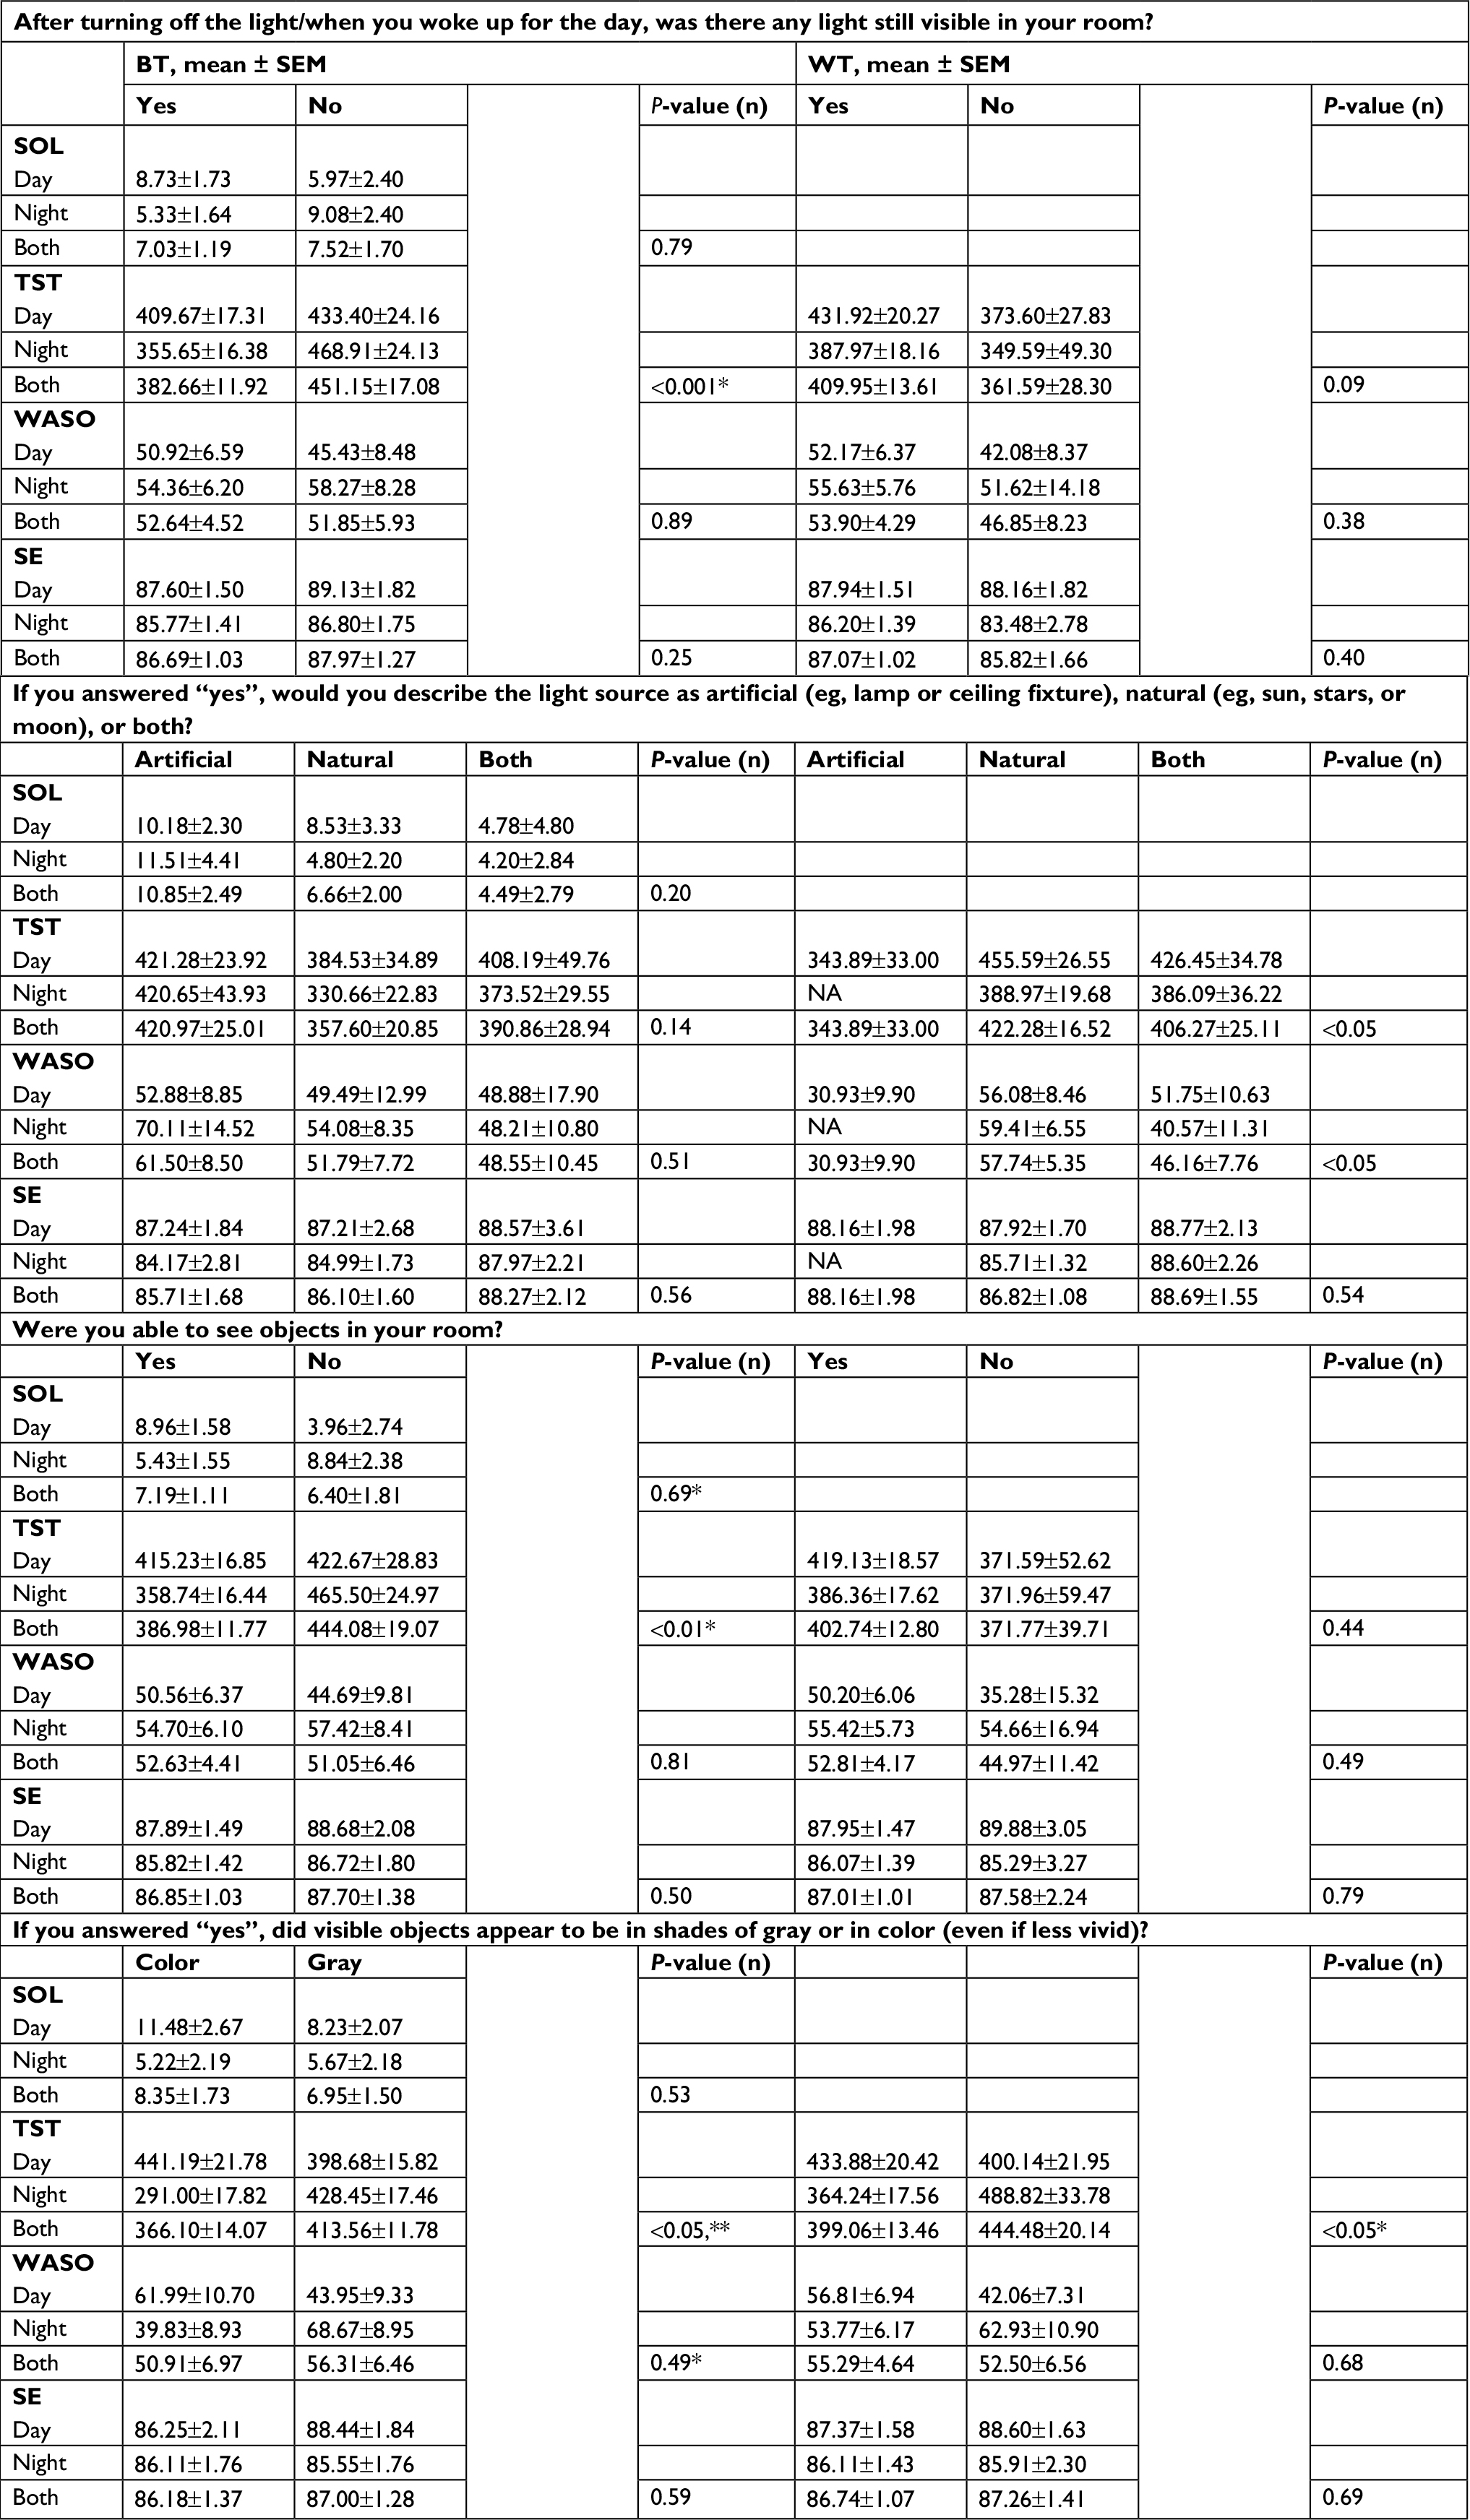 | Table S2 Reported light and objective sleep (actigraphy) by shift type Notes: Responses to light questions and corresponding estimated marginal means of actigraphy-based sleep variables ± SEM for each response. Responses to light questions are shown by column, organized by BT and WT, and sleep variables are shown in rows. Values vary slightly here from those reported in Table 2, due to inclusion here of only day and night workers (no administrator) and of shift and its interaction with response in all models. All P-values are for main effects for response only. *P<0.05, response–shift type interaction; **P<0.05, shift type. Subject numbers by response and shift type are the same as those reported in Table S1. Abbreviations: BT, bedtime; WT, wake time; NA, not applicable; SOL, sleep-onset latency; TST, total sleep time; WASO, wake after sleep onset; SE, sleep efficiency. |
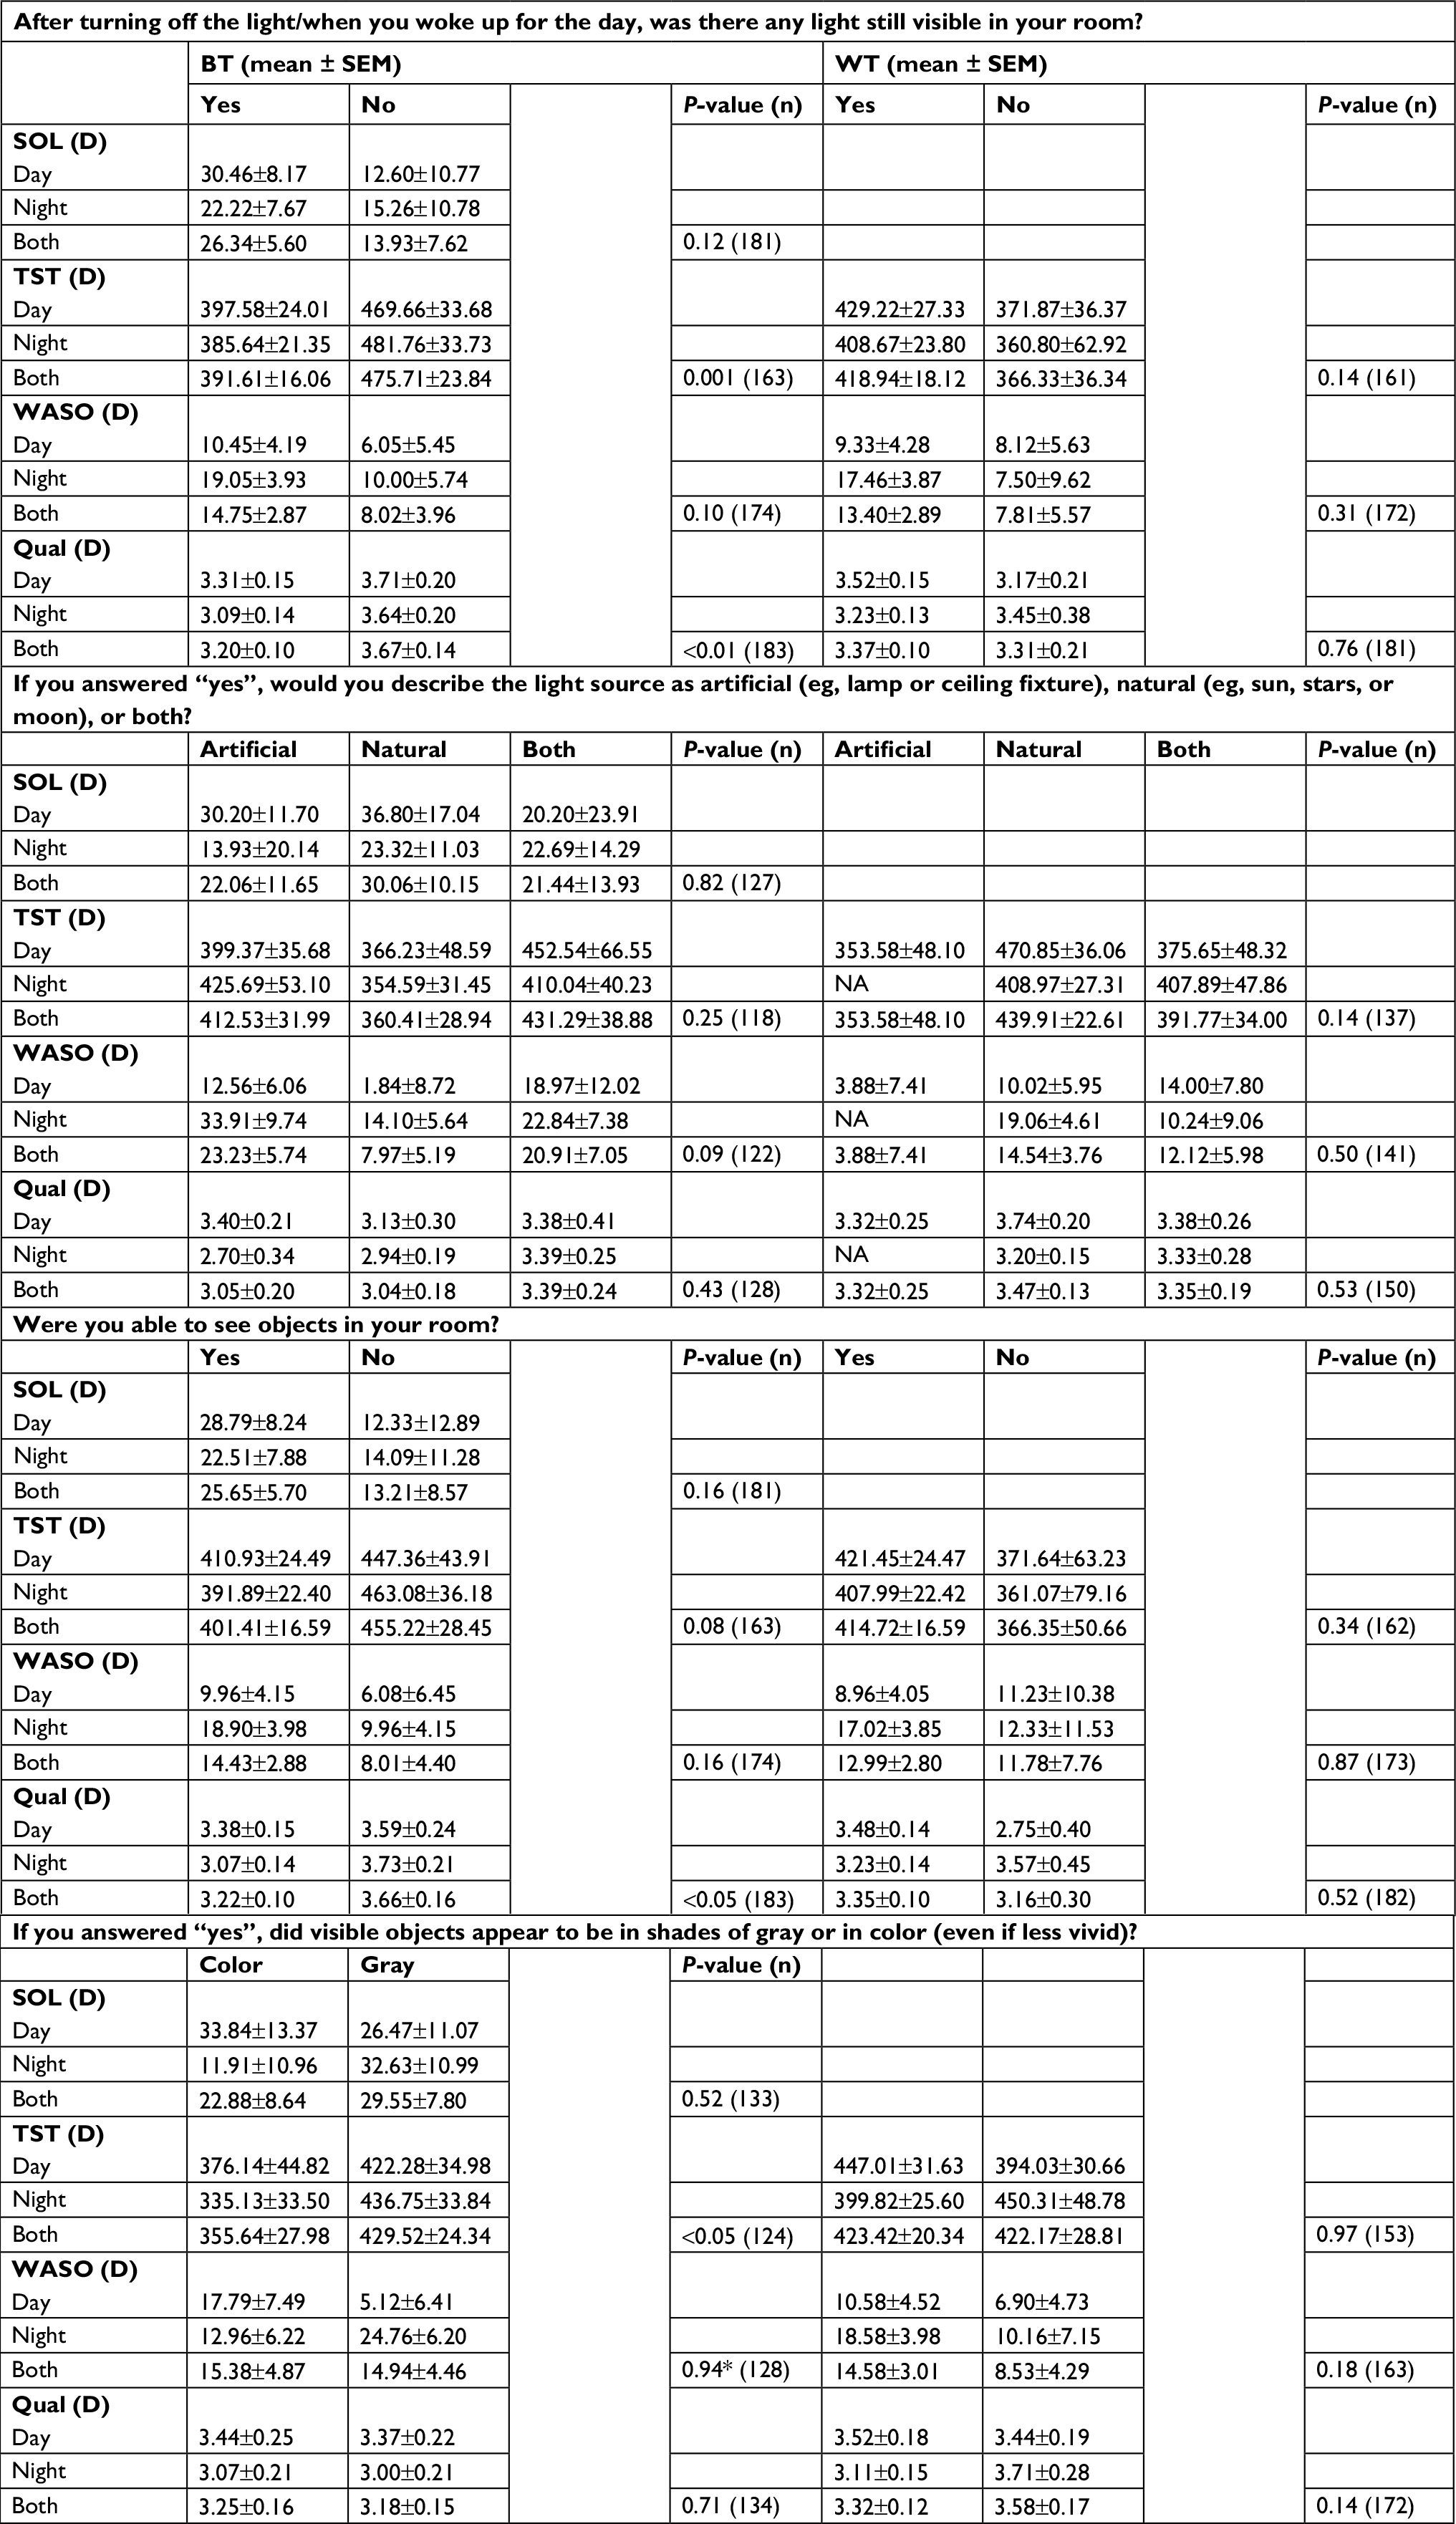 | Table S3 Reported light and subjective sleep (diary) by shift type Notes: Responses to light questions and corresponding estimated marginal means of diary-based sleep variables ± SEM for each response. Responses to light questions shown by column, organized by BT and WT, and sleep variables shown in rows. SOL, WASO, TST, and Qual assessed on a scale of 1–5. Values vary slightly here from those reported in Table 3, due to inclusion here of only day and night workers (no administrator) and of shift and its interaction with response in all models. All P-values are for main effects for response only. *P<0.05, response–shift type interaction; Subject numbers vary slightly for each analysis. Abbreviations: BT, bedtime; WT, wake time; SOL, sleep-onset latency; TST, total sleep time; WASO, wake after sleep onset; Qual, quality; NA, not applicable. |
 © 2019 The Author(s). This work is published and licensed by Dove Medical Press Limited. The
full terms of this license are available at https://www.dovepress.com/terms
and incorporate the Creative Commons Attribution
- Non Commercial (unported, 3.0) License.
By accessing the work you hereby accept the Terms. Non-commercial uses of the work are permitted
without any further permission from Dove Medical Press Limited, provided the work is properly
attributed. For permission for commercial use of this work, please see paragraphs 4.2 and 5 of our Terms.
© 2019 The Author(s). This work is published and licensed by Dove Medical Press Limited. The
full terms of this license are available at https://www.dovepress.com/terms
and incorporate the Creative Commons Attribution
- Non Commercial (unported, 3.0) License.
By accessing the work you hereby accept the Terms. Non-commercial uses of the work are permitted
without any further permission from Dove Medical Press Limited, provided the work is properly
attributed. For permission for commercial use of this work, please see paragraphs 4.2 and 5 of our Terms.