Back to Journals » Drug Design, Development and Therapy » Volume 19
Renal Function and Hemoglobin Independently Predict Levetiracetam Exposure in Epilepsy Patients: A Multifactorial Regression Study
Authors Jiang X ![]() , Xiong F, Lin Z, Huang X
, Xiong F, Lin Z, Huang X
Received 14 July 2025
Accepted for publication 12 October 2025
Published 17 October 2025 Volume 2025:19 Pages 9415—9423
DOI https://doi.org/10.2147/DDDT.S553644
Checked for plagiarism Yes
Review by Single anonymous peer review
Peer reviewer comments 2
Editor who approved publication: Dr Solomon Tadesse Zeleke
Xuehui Jiang,1,* Fangfang Xiong,2,* Zhihang Lin,1 Xiaowei Huang1
1Department of Pharmacy, Quanzhou First Hospital Affiliated to Fujian Medical University, Quanzhou, 362000, People’s Republic of China; 2Department of Pharmacy, The Second Affiliated Hospital of Fujian Medical University, Quanzhou, 362000, People’s Republic of China
*These authors contributed equally to this work
Correspondence: Zhihang Lin, Department of Pharmacy, Quanzhou First Hospital Affiliated to Fujian Medical University, No. 1028 Anji South Road, Fengze District, Quanzhou, 362000, People’s Republic of China, Tel +86 13506000324, Email [email protected] Xiaowei Huang, Department of Pharmacy, Quanzhou First Hospital Affiliated to Fujian Medical University, No. 1028 Anji South Road, Fengze District, Quanzhou, 362000, People’s Republic of China, Tel +86 13400538528, Email [email protected]
Purpose: To investigate the key factors influencing the plasma concentration of levetiracetam (LEV) in patients with epilepsy and to establish a predictive model for LEV steady-state trough concentration.
Patients and Methods: Clinical data from 130 epilepsy patients (175 steady-state trough concentration blood samples) were retrospectively collected at a single center. Univariate analysis and multiple linear regression modeling were employed to systematically quantify the independent effects of demographic characteristics, biochemical indicators, and concomitant medications on the LEV C/D. The robustness of the model was validated using the Bootstrap method (1000 resamples).
Results: Creatinine clearance rate (Ccr) emerged as the strongest independent predictor (unstandardized β = − 0.168, p < 0.001), with every 1 mL/min increase in Ccr resulting in a 0.168 ng·mL− 1/(g·d− 1) decrease in C/D. Hemoglobin (HGB) exhibited a secondary negative association (unstandardized β = − 0.070, p < 0.05), where every 1 g/L decrease led to a 0.070 ng·mL− 1/(g·d− 1) increase in C/D. Bootstrap validation confirmed the stability of these coefficients (95% CI: Ccr [− 0.221, − 0.123], HGB [− 0.140, − 0.008]). The final predictive equation was: C/Dpred [ng·mL− 1/(g·d− 1)] = 37.759 − 0.168 × Ccr (mL/min) − 0.070 × HGB (g/L) (adjusted R² = 0.440, p < 0.001).
Conclusion: Routine clinical indicators Ccr and HGB are core influencing factors of LEV exposure. This model quantifies their independent effects on LEV steady-state trough concentration, providing novel insights into the interindividual variability of LEV pharmacokinetics and offering a potential tool for aiding individualized dosing strategies, especially in resource-limited settings where therapeutic drug monitoring is not readily available. However, its generalizability still needs to be demonstrated through subsequent external validation and prospective multicenter studies.
Keywords: levetiracetam, creatinine clearance, hemoglobin, multifactorial regression, epilepsy
Introduction
Epilepsy, a chronic brain disorder caused by a variety of factors, is characterized by recurrent, unprovoked seizures. It is associated with significant disability and an increased risk of premature mortality, severely impairing the life quality of patients of all ages and shortening their life expectancy.1 Epidemiological data show that there are more than 50 million people with epilepsy worldwide, accounting for more than 0.5% of the global disease burden. Over 80% of the disease burden is concentrated in low- and middle-income countries,2 imposing a significant economic and psychological burden on individuals with epilepsy and their families.3 Fortunately, more than 70% of patients achieve effective seizure control through the rational use of antiepileptic drugs (AEDs), highlighting the importance of drug therapy.4
Levetiracetam (LEV) exhibits a unique mechanism of action distinct from conventional AEDs. Its primary mechanism involves high-affinity binding to the synaptic vesicle protein 2A (SV2A). This binding is thought to modulate synaptic vesicle exocytosis, thereby dampening the hypersynchronous neuronal activity that underlies seizures by reducing excessive neurotransmitter release. Its broad-spectrum efficacy is attributed to this presynaptic action, which differs from the ion channel-focused mechanisms of older drugs.5 It features excellent safety and efficacy, with high oral bioavailability (>95%),6 and is currently recommended as a first-line treatment for partial seizures, making it widely used in the initial and adjunctive treatment of seizures in both adults and children.7,8 The plasma concentration of LEV is closely related to its efficacy,9 and the International League Against Epilepsy (ILAE) recommends a concentration range of 12–46 μg/mL.10 However, due to various factors, there is considerable inter- and intra-individual variability in LEV plasma concentrations.11 Given that LEV displays linear (dose-proportional) pharmacokinetics across its clinical dose range,12 the concentration-to-dose (C/D) ratio is a useful parameter to normalize for the administered dose and identify sources of pharmacokinetic variability beyond dose itself. Identifying these factors that may influence LEV pharmacokinetic parameters is an important step in the treatment of epilepsy.
Renal function is the dominant covariate significantly influencing LEV clearance and exposure.13 This is mechanistically supported by the pharmacokinetic profile of LEV: low protein binding (<10%) and predominant renal elimination (approximately 66% excreted unchanged in urine.6 Consequently, therapeutic drug monitoring (TDM) guidelines highlight the importance of dose adjustment in patients with renal impairment.10 While the relationship between renal function and LEV disposition is well-established, there is limited exploration into the predictive role of other readily available clinical biomarkers, and a scarcity of practical models that integrate these factors for clinical use. This gap is particularly relevant in settings where TDM is not readily available.
Therefore, building upon the established role of renal function and seeking to identify additional modifiable factors, this study collected steady-state trough concentration data and clinical information from epilepsy patients receiving LEV therapy. The aim was to explore key demographic, biochemical, and comedication factors that may influence LEV plasma concentrations (as expressed by the C/D ratio) and to develop a practical predictive model.
Materials and Methods
Patients
A total of 175 eligible blood samples were retrospectively collected from 130 epilepsy patients receiving LEV treatment at Quanzhou First Hospital Affiliated to Fujian Medical University (from 1 June 2024 to 31 May 2025). Inclusion criteria included: (1) meeting the ILAE epilepsy diagnostic criteria;14 (2) hospitalized patients; (3) patients who had received oral LEV treatment for at least 3 days with stable dosing. Exclusion criteria were: (1) poor medication adherence; (2) pregnancy; (3) patients with acute kidney injury or significant renal function fluctuations [more than a 20% variation in two consecutive serum creatinine (Scr) measurements during hospital stay]; (4) patients with any missing required information.
This study was approved by the Ethics Committee of Quanzhou First Hospital Affiliated to Fujian Medical University [(2024) K113], and all enrolled patients or their legal guardians have provided informed consent.
Data Collection
Patient medical records (demographic characteristics, medication data, and laboratory indicators) were extracted from hospital electronic information systems. The specific information collected includes: (1) Basic information: gender, age, and weight; (2) Medication information: LEV dosage regimen, plasma concentration sampling time and test values, and concomitant medications mainly include valproic acid (VPA), oxcarbazepine (OXC), phenobarbital (PB), and proton pump inhibitors (PPI); (3) Laboratory indicators: 1) Complete blood count: red blood cell count (RBC), hemoglobin (HGB), white blood cell count (WBC); 2) Liver function: total protein (TP), albumin (ALB), total bilirubin (TBIL), alanine aminotransferase (ALT), aspartate aminotransferase (AST); 3) Kidney function: Scr, and creatinine clearance (Ccr) was calculated using the Cockcroft-Gault formula [Ccr (mL/min) = [(140 − Age) × Weight (kg) × 1.23] / Scr (μmol/L) × (0.85 if female)].15
Biochemical Measurements
Fasting venous blood (2 mL) was collected 30–60 minutes before the next dose of medication and injected into an EDTA anticoagulant tube. After centrifuging the samples at 3000 r/min for 10 min, the plasma supernatant was separated and stored at −20°C until analysis. LEV concentrations in plasma were quantified using an enzyme-enhanced immunoassay technique on a Siemens Viva-E automated biochemical analyzer (reagents, calibrators, and controls from Zhuhai Livzon Reagents Inc.). The method is based on a competitive immunoassay principle. The plasma samples were analyzed under the following conditions: 3 µL of sample, 70 µL of R1 (containing antibody and substrate), and 85 µL of R2 (enzyme conjugate), with a reaction incubation of 2–5 minutes at 37°C; absorbance readings were taken kinetically at 340 nm starting 50 seconds after the addition of R2. Calibration was performed using six-point calibrators (each measured in duplicate), and the assay demonstrated a linear range of 2–100 µg/mL (R ≥ 0.99). The inter- and intra-assay precision (CV) were ≤10%, recovery rates ranged from 96.3% to 109.9%. Quality control samples (low, medium, high) were run in each batch to ensure accuracy and reliability.
Scr and other biochemical indicators were measured using fresh serum samples collected after an overnight fast. Blood sampling for all biochemical tests was performed on the same morning as the LEV trough concentration measurement. All blood samples were drawn via venipuncture into vacuum serum separator tubes, followed by centrifugation and analysis on automated clinical chemistry analyzers (Siemens Healthineers, Germany).
Statistical Analysis
The C/D ratio was chosen as the primary outcome measure to normalize the trough concentration (Ctrough) for the daily dose (D), thereby eliminating dose as a confounding variable and allowing for the comparison of drug exposure across individuals receiving different regimens, and it is a well-established approach in pharmacokinetic studies.16
Normality of continuous variables was assessed using the Shapiro–Wilk test. If the data were normally distributed (p > 0.05), they were described using the mean ± standard deviation (Mean ± SD) to indicate central tendency and dispersion. Further analysis involved using an independent samples t-test to compare between-group differences in binary variables. For two continuous variables that were both normally distributed, the Pearson correlation coefficient was used to assess linear correlation. If the data are not normally distributed, the median (interquartile range, IQR) is used instead. The Mann–Whitney U-test is used to compare between-group differences in binary variables, and the Spearman rank correlation coefficient is used to analyze correlations. Predictor variables were selected for inclusion in the multivariate model based on clinical relevance and significance in univariate analysis (p < 0.05). If the vast majority of patients (above 80%) contributed only a single data point, the within-patient correlation was ignored. All hypothesis tests were two-tailed tests, with a significance threshold set at p < 0.05. Statistical analysis was performed using SPSS 26.0 (IBM Corp.).
To internally validate the stability of the final regression model and the precision of its coefficients, the bootstrap resampling method was employed with 1000 iterations.17 This approach provides confidence intervals for the coefficients and assesses the robustness of the model as well as shows the statistical power of available samples.
Results
Patient Characteristics
This study included 130 epilepsy patients who received LEV treatment (86 males, accounting for 66.2%; 44 females, accounting for 33.8%), and 175 blood samples were collected. Median age was 55.0 years (IQR: 38.0–69.0), and median weight was 60.5 kg (IQR: 52.6–70.0). The Median C/D was 9.8 ng·mL−1/(g·d−1) (IQR: 5.9–15.7). In terms of combination therapy, there were 71 patients (54.6%) concurrently using VPA, 68 patients (52.3%) using PPI, 31 patients (23.8%) using OXC, and 21 patients (16.2%) using PB. Detailed information is shown in Table 1.
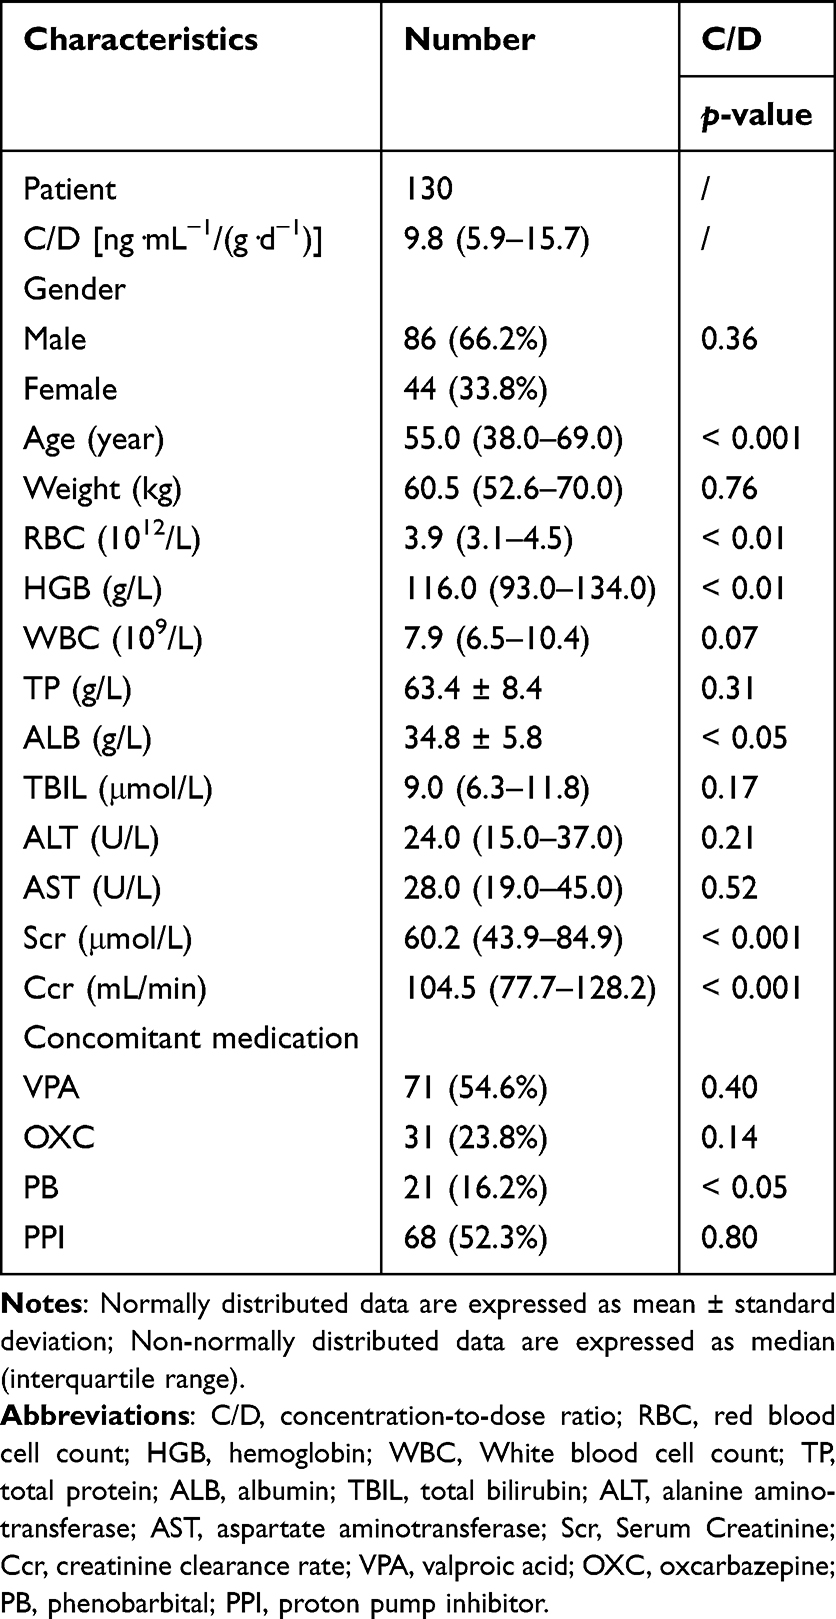 |
Table 1 Patient Characteristics and Univariate Analysis of Factors Associated with Levetiracetam Concentration-to-Dose Ratio (C/D) |
Univariate Factor Analysis
As a preliminary screening of potential factors affecting LEV C/D values, this study conducted a univariate analysis of each collected covariate, which provided a key prerequisite for subsequent multi-factor model construction. As indicated in Table 1, among physiological and biochemical indicators, age (p < 0.001), RBC (p < 0.01), HGB (p < 0.01), ALB (p < 0.05), and renal function (p < 0.001) were significantly correlated with the C/D ratio. Regarding combination therapy, it was found that the addition of PB therapy (p < 0.05) significantly affected the C/D ratio. However, no significant effects were observed for other combination therapies (VPA, OXC, and PPI).
Multivariate Linear Regression
To identify independent factors and correct for confounding effects, a multiple linear regression model was further established. In the model, the C/D value was used as the dependent variable, and variables that showed significant results in the univariate analysis (age, RBC, HGB, ALB, Scr, Ccr, and PB) were included to quantify the independent effects. Additionally, to eliminate multicollinearity, RBC and Scr were further excluded because, as shown in Figure 1, RBC was significantly correlated with HGB (rs = 0.91, p < 0.001), while Ccr itself was derived from Scr. The final model results (Table 2) showed that Ccr was the strongest predictor (p < 0.001), with a standardized coefficient as high as −0.674, while HGB was a secondary independent factor (p < 0.05). Notably, age, ALB, and PB lost significance after adjusting for confounding factors (p > 0.05). The variance inflation factor values of the predictive variables included in the model are all less than 2 (Ccr: 1.316; HGB: 1.378), indicating that there is no significant multicollinearity problem in the model. The final prediction equation established for the predicted C/D value (C/Dpred) (adjusted R2 = 0.440; p < 0.001) is as follows:
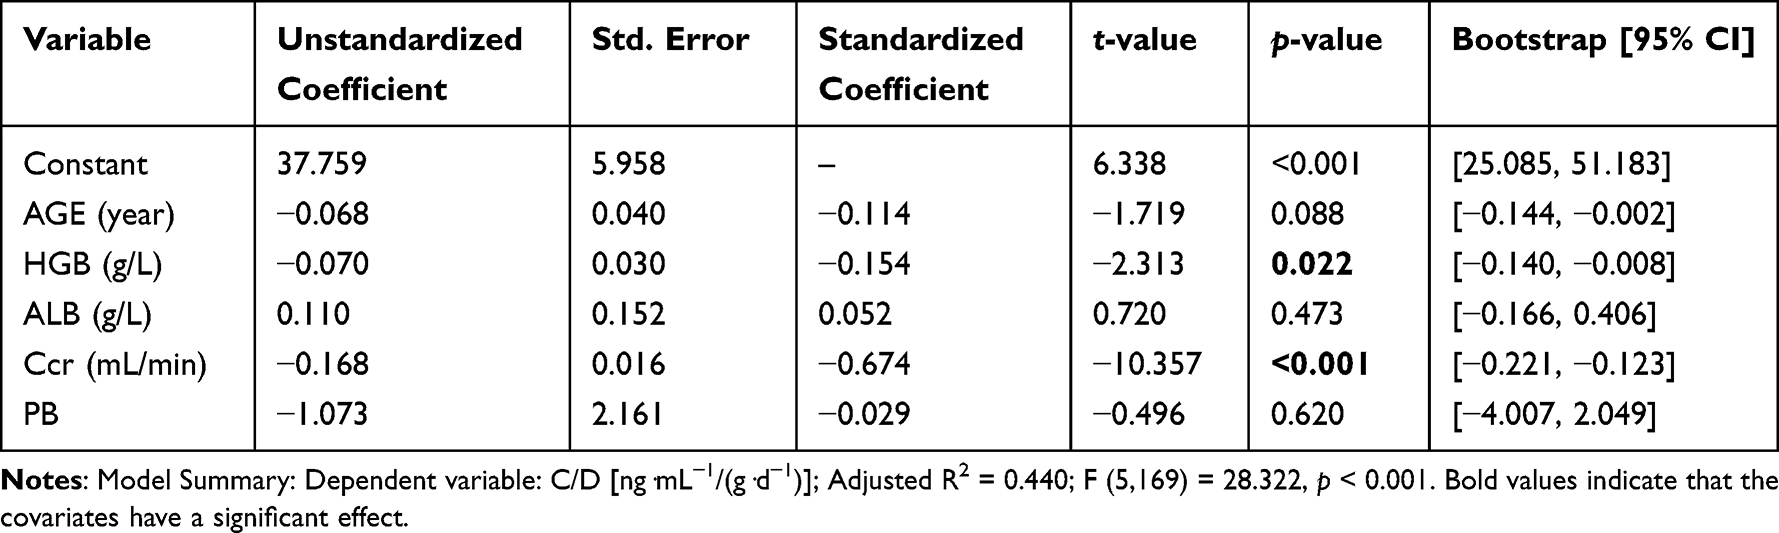 |
Table 2 Multiple Linear Regression Analysis of Predictors for Levetiracetam Concentration-to-Dose Ratio (C/D) |
 |
Figure 1 Scatter Plot Demonstrating the Strong Linear Correlation Between Red Blood Cell Count (RBC) and Hemoglobin (HGB) Concentration (rs = 0.91, p < 0.001). |
C/Dpred [ng·mL−1/(g·d−1)] = 37.759 − 0.168 × Ccr (mL/min) − 0.070 × HGB (g/L)
Model Evaluation
To assess the robustness of the predictive model, the bootstrap method was used to perform validation of the model. The 95% confidence intervals (CI) for the coefficients of each predictor variable were calculated by repeating the sampling 1000 times (Table 2). The results showed that the coefficients of the significant predictors (Ccr and HGB) were all within the 95% CI of 1000 bootstrap datasets, and the direction was consistent with the original model, confirming that the model structure had good stability. It reinforces the reliability of Ccr and HGB as core factors influencing LEV C/D values.
Discussion
This study analyzed 175 steady-state trough concentration blood samples from 130 epilepsy patients and identified Ccr and HGB levels as significant influencing factors for the LEV C/D. The findings provide evidence-based insights into the concentration variability of LEV in the epileptic population. Furthermore, the independent effects of Ccr and HGB on LEV steady-state trough concentrations were quantitatively assessed. The derived predictive equation serves as an auxiliary tool to assist clinicians in estimating drug concentrations before TDM results are available or in identifying potential causes of abnormal results (eg, renal function changes or anemia). This approach simplifies traditional pharmacokinetic models, which are often complex in calculation, making it more suitable for application in primary healthcare settings. This facilitates a more informed and personalized dosing strategy, especially in low-income countries where routine monitoring of LEV blood concentrations is often limited due to resource constraints.
The standardized coefficients revealed that the factor weight of Ccr (|β| = 0.674) was 4.4 times greater than that of HGB (|β| = 0.154), indicating that renal function was the strongest and most independent predictor of LEV C/D values. This finding aligns with the pharmacokinetic property of LEV, which is primarily cleared renally (approximately 66% excreted unchanged in urine).6 The predictive equation established in this study quantitatively demonstrated a significant negative correlation between Ccr and LEV C/D (p < 0.001): a 10 mL/min change in Ccr, corresponds to 1.68 ng·mL−1/(g·d−1) change in predicted C/D. These results suggest that enhanced drug clearance occurs in states of hyperfiltration, whereas impaired renal function leads to reduced LEV elimination. This finding strongly supports the importance of routine renal function monitoring during LEV therapy, providing clinicians with a practical tool to anticipate the impact of renal function changes on LEV exposure. These observations are also corroborated by Karatza et al,18 who reported a higher seizure recurrence rate in patients with augmented renal clearance, hypothesizing that increased drug elimination resulted in subtherapeutic concentrations and diminished efficacy. Additionally, Rhee et al confirmed the unique predictive value of renal function parameters in estimating LEV plasma concentrations.19
A negative correlation was observed between HGB (p < 0.05) and the C/D ratio. For every 1 g/L change in HGB, the C/D value of LEV changes 0.070 ng·mL−1/(g·d−1), indicating that lower HGB levels were associated with higher LEV C/D values. HGB was identified as the second independent negative predictor following Ccr. This association has been infrequently reported in previous LEV studies.20 Two pathophysiological mechanisms may underlie this association: First, anemia may alter systemic blood flow distribution, affecting tissue perfusion and oxygenation, thereby impairing metabolic clearance capacity;21 second, HGB levels may serve as a surrogate marker for nutritional status, chronic disorder burden, or comorbidities.22 Furthermore, the deepening understanding of the role of oxidative stress in epilepsy provides a potential pathophysiological framework to explain this phenomenon. Although LEV has low protein binding (<10%) and is primarily excreted renally, HGB may act as a surrogate marker for systemic oxidative stress. Recent studies have shown that beyond its oxygen-carrying function, HGB acts as a pseudoperoxidase in astrocytes and neurons, capable of decomposing hydrogen peroxide (H2O2) and mitigating oxidative stress.23 Therefore, low HGB levels may be indicative of elevated oxidative stress, potentially accompanied by impaired tissue oxygenation. These factors may collectively alter drug clearance pathways in the kidneys or liver. Oxidative stress has been clearly implicated in both the pathogenesis of epilepsy and the regulation of drug metabolism.24 Therefore, low HGB levels may reflect a state of increased oxidative burden and compromised intrinsic antioxidant capacity. Theoretically, this state could indirectly affect the drug metabolic environment, potentially leading to decreased LEV clearance and elevated blood concentrations. However, further research is still needed to explore the underlying mechanisms. Monitoring HGB status may help identify patients at potential risk of drug overexposure. For patients with moderate-to-severe anemia, intensified therapeutic monitoring is recommended.
Preliminary analysis revealed that age, ALB, and concomitant use of PB were all statistically correlated with the LEV C/D ratio in univariate analysis. However, none of these factors retained their independent predictive value when incorporated into a more rigorous multivariate regression model. This suggests that their effects were ultimately superseded by Ccr or HGB, which were included in the final multivariate equation. Advanced age is one of the most profound non-pathological contributors to reduced Ccr, as elderly patients commonly exhibit varying degrees of renal function decline.25 Thus, age may appear as a surrogate marker associated with the target outcome in univariate analysis, while its independent predictive significance diminishes when Ccr, a more precise and direct measure of renal function, is incorporated into the model, which captures the primary effects of aging. Similarly, ALB reduction is often indicative of disease states associated with low HGB.26 Additionally, the low protein-binding rate of LEV (<10%) may further influence this relationship.6 Univariate analysis suggested that PB coadministration might affect the C/D ratio; however, this association lost significance after adjustment. A plausible explanation is that although PB is a potent cytochrome P450 enzyme inducer,27 only a minor fraction of LEV metabolism depends on this system.5,6 And the initial significance may be attributed to the relatively small sample size in the PB group, which led to statistical results that were not robust. Furthermore, PB is typically used for refractory epilepsy or specific types of epilepsy, and such patient populations are generally more complex and may be influenced by certain confounding factors. When Ccr and HGB were included in the multivariate model, they emerged as stronger and more direct predictors, effectively “absorbing” the part initially attributed to age, ALB, and PB coadministration. This not only underscores the central and robust predictive roles of Ccr and HGB as independent factors but also highlights the necessity of multivariate analysis, which more effectively untangles genuine independent predictors and potential causal relationships compared to univariate assessment.
It is crucial to define the applicable population for the correct interpretation and translation of our findings. Our study cohort consisted exclusively of hospitalized patients with normal body mass index (median weight: 60.5 kg, IQR: 52.6–70.0), aged 6 to 88 years (with the majority being adults), and all were non-pregnant. Therefore, our predictive model is primarily applicable to non-pregnant inpatients with normal body mass index and stable renal function. Given that our study population comprised hospitalized patients with good medication adherence, the findings may also be extrapolated to outpatients with similar adherence. However, caution should be exercised when applying these results to special populations not represented in our cohort, such as pregnant women. Pregnancy induces profound physiological changes that significantly alter LEV pharmacokinetics, rendering our model inapplicable to this subpopulation. For instance, relevant studies have demonstrated that LEV apparent clearance increases by 42–55% in the second trimester and 15–55% in the third trimester compared to non-pregnant states.28,29 These studies identified total body weight and trimester of pregnancy as key covariates affecting LEV clearance in pregnant women.28,29 Thus, the pharmacokinetic profile of LEV in pregnant women differs from that of our study population.
This study has several limitations. First, due to its retrospective nature, although the inclusion criteria were restricted to hospitalized patients, potential selection bias and information bias may still exist. Second, the regression equation yielded an R2 of 0.440 (p < 0.001), indicating the presence of other undetected potential influencing factors. Although this study incorporated common clinical covariates, due to the complexity of patient conditions, factors such as comorbidities (eg, heart failure, inflammatory states), patient lifestyle habits (eg, smoking, diet), and genetic factors were not included and could act as potential confounders. Third, the limited sample size may have resulted in insufficient statistical power for analyzing certain subgroups. Finally, since the vast majority of patients contributed only a single data point, our statistical model did not explicitly account for within-patient correlation in the subset of individuals who provided multiple samples. Although bootstrap validation of the coefficients supports the stability of our findings, linear mixed-effects models seem to be a more appropriate choice for this type of data. Therefore, further validation through prospective multicenter studies was needed.
Conclusion
This study elucidates the key factors (Ccr and HGB) influencing LEV plasma concentrations and quantifies their effect magnitudes. The derived model, based on two routine clinical indicators, offers a potential practical tool for optimizing LEV therapy. It can aid clinicians in initial dose selection and provide a rationale for interpreting monitoring results. By leveraging this model, clinicians can better anticipate individual pharmacokinetic variability, thereby proactively mitigating the risks of supratherapeutic concentrations (which increase adverse drug reactions) or subtherapeutic levels (which lead to treatment failure). Meanwhile, it is important to acknowledge the limitations of this study, including its retrospective design and the fact that the model explains a portion of the variability (adjusted R2 = 0.440), indicating that other unmeasured factors also contribute to LEV exposure. The current model can identify and quantify key predictors and lays the groundwork for the development of future clinical application tools. However, its generalizability still needs to be demonstrated through subsequent external validation and prospective multicenter studies.
Data Sharing Statement
All datasets or codes generated can be obtained by contacting Mr. Xiaowei Huang.
Ethical Approval
All participants gave their written informed consent, and the study was performed following the Declaration of Helsinki and granted by the medical ethics review board of Quanzhou First Hospital Affiliated to Fujian Medical University [Medical Ethics (2024) K113].
Consent for Publication
All named authors agreed to submit the manuscript for publication.
Acknowledgments
The authors would like to thank the provision of financial support by Fujian Medical University.
Funding
Startup Fund for scientific research, Fujian Medical University (Grant number: 2023QH1293).
Disclosure
There is no conflict of interest in this work to declare.
References
1. Thijs RD, Surges R, O’Brien TJ, Sander JW. Epilepsy in adults. Lancet. 2019;393(10172):689–701. doi:10.1016/S0140-6736(18)32596-0
2. Feigin VL, Vos T, Nair BS, et al. Global, regional, and national burden of epilepsy, 1990–2021: a systematic analysis for the Global Burden of Disease Study 2021. Lancet Public Health. 2025;10(3):e203–e227. doi:10.1016/S2468-2667(24)00302-5
3. Begley C, Wagner RG, Abraham A, et al. The global cost of epilepsy: a systematic review and extrapolation. Epilepsia. 2022;63(4):892–903. doi:10.1111/epi.17165
4. Trinka E, Kwan P, Lee B, Dash A. Epilepsy in Asia: disease burden, management barriers, and challenges. Epilepsia. 2018;60(S1):7–21. doi:10.1111/epi.14458
5. Lynch BA, Lambeng N, Nocka K, et al. The synaptic vesicle protein SV2A is the binding site for the antiepileptic drug levetiracetam. Proc Natl Acad Sci USA. 2004;101(26):9861–9866. doi:10.1073/pnas.0308208101
6. Sheinberg R, Heyman E, Dagan Z, et al. Correlation between efficacy of levetiracetam and serum levels among children with refractory epilepsy. Pediatr Neurol. 2015;52(6):624–628. doi:10.1016/j.pediatrneurol.2015.01.012
7. Weijenberg A, Bos JHJ, Schuiling-Veninga CCM, Brouwer OF, Callenbach PMC. Antiepileptic drug prescription in Dutch children from 2006–2014 using pharmacy-dispensing data. Epilepsy Res. 2018;146:21–27. doi:10.1016/j.eplepsyres.2018.07.011
8. Glauser T, Ben-Menachem E, Bourgeois B, et al. Updated ILAE evidence review of antiepileptic drug efficacy and effectiveness as initial monotherapy for epileptic seizures and syndromes. Epilepsia. 2013;54(3):551–563. doi:10.1111/epi.12074
9. Snoeck E, Stockis A. Dose–response population analysis of levetiracetam add-on treatment in refractory epileptic patients with partial onset seizures. Epilepsy Res. 2007;73(3):284–291. doi:10.1016/j.eplepsyres.2006.11.006
10. Patsalos PN, Berry DJ, Bourgeois BFD, et al. Antiepileptic drugs—best practice guidelines for therapeutic drug monitoring: a position paper by the subcommission on therapeutic drug monitoring, ILAE Commission on Therapeutic Strategies. Epilepsia. 2008;49(7):1239–1276. doi:10.1111/j.1528-1167.2008.01561.x
11. Chhun S, Jullien V, Rey E, Dulac O, Chiron C, Pons G. Population pharmacokinetics of levetiracetam and dosing recommendation in children with epilepsy. Epilepsia. 2009;50(5):1150–1157. doi:10.1111/j.1528-1167.2008.01974.x
12. Haria M, Balfour JA. Levetiracetam. CNS Drugs. 1997;7(2):159–164. doi:10.2165/00023210-199707020-00006
13. Li ZR, Wang CY, Zhu X, Jiao Z. Population pharmacokinetics of levetiracetam: a systematic review. Clin Pharmacokinet. 2021;60(3):305–318. doi:10.1007/s40262-020-00963-2
14. Fisher RS, Cross JH, French JA, et al. Operational classification of seizure types by the international league against epilepsy: position paper of the ILAE commission for classification and terminology. Epilepsia. 2017;58(4):522–530. doi:10.1111/epi.13670
15. Cockcroft DW, Gault MH. Prediction of creatinine clearance from serum creatinine. Nephron. 1976;16(1):31–41. doi:10.1159/000180580
16. Araki K, Nakamura T, Takeuchi Y, et al. Pharmacological monitoring of antiepileptic drugs in epilepsy patients on haemodialysis. Epileptic Disord. 2020;22(1):90–102. doi:10.1684/epd.2020.1139
17. Parke J, Holford NHG, Charles BG. A procedure for generating bootstrap samples for the validation of nonlinear mixed-effects population models. Comput Methods Programs Biomed. 1999;59(1):19–29. doi:10.1016/S0169-2607(98)00098-4
18. Karatza E, Markantonis SL, Savvidou A, et al. Pharmacokinetic and pharmacodynamic modeling of levetiracetam: investigation of factors affecting the clinical outcome. Xenobiotica. 2020;50(9):1090–1100. doi:10.1080/00498254.2020.1746981
19. Rhee SJ, Shin JW, Lee S, et al. Population pharmacokinetics and dose-response relationship of levetiracetam in adult patients with epilepsy. Epilepsy Res. 2017;132:8–14. doi:10.1016/j.eplepsyres.2017.02.011
20. García Carretero R, Romero Brugera M, Olid-Velilla M, Salamanca-Ramirez I. Pancytopenia associated with levetiracetam in an epileptic woman. BMJ Case Rep. 2016;2016:bcr2016217407. doi:10.1136/bcr-2016-217407
21. Krzesiński P, Galas A, Gielerak G, Uziębło-życzkowska B. Haemodynamic effects of anaemia in patients with acute decompensated heart failure. Cardiol Res Pract. 2020;2020:9371967. doi:10.1155/2020/9371967
22. Moorthy D, Merrill R, Namaste S, Iannotti L. The impact of nutrition-specific and nutrition-sensitive interventions on hemoglobin concentrations and anemia: a meta-review of systematic reviews. Adv Nutr. 2020;11(6):1631–1645. doi:10.1093/advances/nmaa070
23. Won W, Lee EH, Gotina L, et al. Hemoglobin as a pseudoperoxidase and drug target for oxidative stress-related diseases. Signal Transduct Target Ther. 2025;10(1):270. doi:10.1038/s41392-025-02366-w
24. Akünal Türel C, Yunusoğlu O. Oleanolic acid suppresses pentylenetetrazole-induced seizure in vivo. Int J Environ Health Res. 2023;33(5):529–540. doi:10.1080/09603123.2023.2167947
25. Wei L, Bai Y, Zhang Y, et al. Thyroid function and age-related decline in kidney function in older Chinese adults: a cross-sectional study. BMC Geriatr. 2022;22(1):221. doi:10.1186/s12877-022-02904-z
26. Xu H, Zheng X, Ai J, Yang L. Hemoglobin, albumin, lymphocyte, and platelet (HALP) score and cancer prognosis: a systematic review and meta-analysis of 13,110 patients. Int Immunopharmacol. 2023;114:109496. doi:10.1016/j.intimp.2022.109496
27. Uomoto S, Takesue K, Shimizu S, et al. Phenobarbital, a hepatic metabolic enzyme inducer, inhibits preneoplastic hepatic lesions with expression of selective autophagy receptor p62 and ER-phagy receptor FAM134B in high-fat diet-fed rats through the inhibition of ER stress. Food Chem Toxicol. 2023;173:113607. doi:10.1016/j.fct.2023.113607
28. Li Y, Wang ML, Guo Y, et al. Population pharmacokinetics and dosing regimen optimization of levetiracetam in epilepsy during pregnancy. Br J Clin Pharmacol. 2023;89:1152–1161. doi:10.1111/bcp.15572
29. Duan Y, Yang X, Zhang M, et al. Adaptive dosage strategy of levetiracetam in Chinese epileptic patients: focus on pregnant women. J Pharm Sci. 2024;113:1385–1394. doi:10.1016/j.xphs.2023.12.025
 © 2025 The Author(s). This work is published and licensed by Dove Medical Press Limited. The
full terms of this license are available at https://www.dovepress.com/terms
and incorporate the Creative Commons Attribution
- Non Commercial (unported, 4.0) License.
By accessing the work you hereby accept the Terms. Non-commercial uses of the work are permitted
without any further permission from Dove Medical Press Limited, provided the work is properly
attributed. For permission for commercial use of this work, please see paragraphs 4.2 and 5 of our Terms.
© 2025 The Author(s). This work is published and licensed by Dove Medical Press Limited. The
full terms of this license are available at https://www.dovepress.com/terms
and incorporate the Creative Commons Attribution
- Non Commercial (unported, 4.0) License.
By accessing the work you hereby accept the Terms. Non-commercial uses of the work are permitted
without any further permission from Dove Medical Press Limited, provided the work is properly
attributed. For permission for commercial use of this work, please see paragraphs 4.2 and 5 of our Terms.