Back to Journals » Diabetes, Metabolic Syndrome and Obesity » Volume 18
Remnant Cholesterol as a Superior Marker Over LDL-C for Hyperuricemia: A Cross-Sectional Study in Northwest China
Authors Lu X ![]() , Liang H, Zhou X, Wu Y, Sha L, Lei H
, Liang H, Zhou X, Wu Y, Sha L, Lei H
Received 14 September 2025
Accepted for publication 10 November 2025
Published 1 December 2025 Volume 2025:18 Pages 4411—4421
DOI https://doi.org/10.2147/DMSO.S563873
Checked for plagiarism Yes
Review by Single anonymous peer review
Peer reviewer comments 3
Editor who approved publication: Dr Pablo Corral
Xixuan Lu, Haiyan Liang, Xiaoli Zhou, Yuemei Wu, Liping Sha, Hong Lei
Department of Endocrinology, Cardiovascular and Cerebrovascular Disease Hospital, General Hospital of Ningxia Medical University, Yinchuan, Ningxia, People’s Republic of China
Correspondence: Xixuan Lu, Department of Endocrinology, Cardiovascular and Cerebrovascular Disease Hospital, General Hospital of Ningxia Medical University, No. 804, Shengli South Street, Xingqing District, Yinchuan, Ningxia, 750004, People’s Republic of China, Email [email protected]; [email protected]
Purpose: Hyperuricemia is a precursor to gout and is linked to various metabolic disorders. This study investigated the associations of hyperuricemia with concordant/discordant lipid phenotypes based on low-density lipoprotein cholesterol (LDL-C) and remnant cholesterol (RC).
Methods: We analyzed 8,971 participants from a cluster-stratified random sample across six provinces in Northwest China. They were categorized into four groups by LDL-C and RC levels: NRC+NLDL, NRC+HLDL, HRC+NLDL, and HRC+HLDL. Multivariable logistic regression was used to assess the odds of hyperuricemia across these groups.
Results: Participants in Group NRC+HLDL, Group HRC+NLDL, and Group HRC+HLDL exhibited an increased risk for hyperuricemia by 37%, 96%, and 120%, respectively (OR: 1.37, 95% CI: 1.13– 1.66 for NRC+HLDL; OR: 1.96, 95% CI: 1.57– 2.45 for HRC+NLDL; OR: 2.20, 95% CI: 1.82– 2.65 for HRC+HLDL), relative to Group NRC+NLDL. Subgroup analyses highlighted significant interaction effects based on gender and hypertriglyceridemia, with a more pronounced association observed in female participants. Sensitivity analyses revealed Group HRC+NLDL was most closely related to HUA when stricter LDL-C cut-offs were applied. Body mass index (BMI) and waist circumference (WC) mediated 20.27% and 6.67% of this association, respectively.
Conclusion: RC demonstrated a stronger association with hyperuricemia than LDL-C, partially mediated by BMI and WC. Women exhibited greater susceptibility to RC-related hyperuricemia.
Keywords: remnant cholesterol, low-density lipoprotein cholesterol, hyperuricemia, discordance, concordance
Introduction
Hyperuricemia (HUA), characterized by elevated serum uric acid (sUA) levels, is not only a precursor to gout but also closely associated with various comorbidities, including cardiovascular diseases, heart failure, metabolic syndrome, type 2 diabetes, and chronic kidney disease. These conditions contribute to increased morbidity and mortality rates among affected individuals.1 Its rising prevalence has significantly impaired patients’ quality of life and imposed substantial economic burdens on healthcare systems globally.2,3 Current management primarily relies on lifestyle modifications and pharmacotherapy, yet these approaches often face challenges related to patient adherence and therapeutic efficacy.4 Therefore, it is essential to investigate the underlying associations and risk factors for hyperuricemia in order to develop more targeted preventive strategies. To date, several pathological risk factors for hyperuricemia have been identified, such as hypertension, obesity, chronic inflammation, and traditional lipid components.5–8 A community-based cross-sectional study demonstrated that serum triglycerides (TG) exhibit the strongest association with hyperuricemia; additionally, Non-high-density lipoprotein cholesterol (non-HDL-C) is significantly correlated with this condition as well.9 Data from The Third National Health and Nutrition Examination Survey (NHANES III) revealed notable correlations between serum levels of low-density lipoprotein cholesterol (LDL-C), TGs, total cholesterol (TC), apolipoprotein B levels, the TG/HDL ratio, and the ratio of apolipoprotein B to apolipoprotein A-I with sUA levels,while HDL-C exhibited an inverse relationship.10 However, with the increasing use of statins in recent years, research focus has shifted toward triglyceride-rich lipoproteins (TRLs), which represent a key component of dyslipidemia that remains inadequately managed by statin therapy.9,10 Remnant cholesterol (RC), an emerging atherogenic lipoprotein marker, refers to the cholesterol content within TRLs, primarily comprising chylomicron remnants, very low-density lipoproteins (VLDL), and intermediate-density lipoproteins (IDL). RC is more abundant, larger, and carries more cholesterol than LDL-C particles thus, it is not surprising that RC has been associated with cardiovascular events and total mortality.11,12
Accumulating evidence indicates that RC may pose a more direct and significant risk factor for cardiovascular and metabolic diseases compared to conventional lipid markers such as LDL-C or TG.13–15 Higher RC levels were also suggested to be significantly associated with the development of DM and hypertension.16 This offers new insights into the concordance/discordance dynamics between RC and LDL-C.
Although previous studies have indicated a positive association between RC and HUA,17–19 the roles of RC/LDL-C concordance and discordance in HUA development remain insufficiently explored. To address this gap, the present study employed a multi-stage stratified random sampling design across six provinces in Northwest China, aiming to investigate the relationship between lipid phenotype and hyperuricemia, with a particular focus on the concordance and discordance between RC and LDL-C levels.
Methods
Subjects
This study was conducted in Northwest China, encompassing six provinces (Ningxia, Shanxi, Gansu, Xinjiang, Qinghai, and Inner Mongolia) from 2014 to 2017 using a whole cluster stratified random sampling design. The inclusion criteria for subjects were: 1) age 18 years or older; 2) local residency for at least five years; and 3) non-pregnant women. The exclusion criteria were: 1) Use of any lipid-lowering medication; 2) A self-reported history of physician-diagnosed cardiovascular disease (including myocardial infarction, coronary revascularization, or stroke); 3) Diagnosis of severe renal insufficiency or severe hepatic disease (eg, cirrhosis, viral hepatitis); 4) Missing essential laboratory or questionnaire data required for group classification or outcome assessment; 5) Presence of acute infectious or inflammatory diseases at the time of enrollment; 6) Presence of malignant tumors or other terminal illnesses. The study received approval from the Ethics Committee of General Hospital of Ningxia Medical University, and all procedures adhered to the ethical standards as well as the principles outlined in the 1964 Helsinki Declaration and its subsequent amendments. Prior to enrollment, all subjects provided written informed consent following a comprehensive explanation of the study’s purpose and procedures, and all collected data were anonymized to ensure confidentiality. A total of 15,506 samples were collected; however, we excluded 211 samples with incomplete information, 859 samples lacking blood tests, 3,197 samples taking oral lipid-lowering medications, and 2,268 samples with a RC less than or equal to zero. Ultimately, 8,971 participants were enrolled in this study. The sample screening process is illustrated in Figure 1.
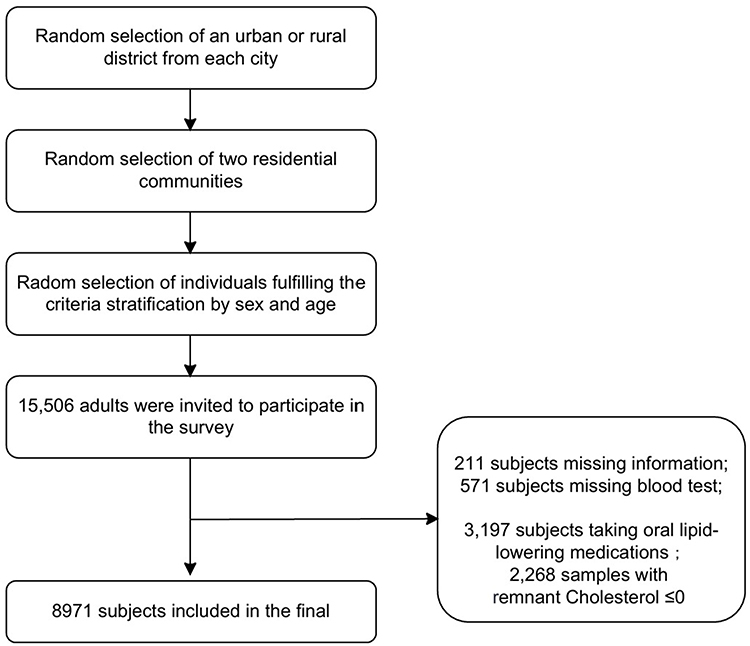 |
Figure 1 Flow chart of research population. |
Data Collection and Anthropometry
A standardized questionnaire was administered by professionally trained personnel to gather data on sociodemographic factors, regional location, lifestyle choices, and medical history of diabetes mellitus (DM) and hypertension. Physical examinations and blood pressure (BP) measurements were primarily conducted by physicians or medical students. Body mass index (BMI) was calculated as weight in kilograms divided by height squared in meters (kg/m2). Waist circumference (WC) was measured at the narrowest part of the torso, midway between the inferior border of the rib cage and the superior aspect of the iliac crest. BP was taken three times after a resting period of at least ten minutes; the average of these three measurements served as the final value.
Laboratory Measurements
Participants were instructed to fast for eight hours overnight prior to venipuncture. Blood specimens underwent centrifugation for separation before being stored at −80 °C until transported to the Laboratory of General Hospital of Ningxia Medical University for laboratory assays. Uric acid and lipid profiles were quantified accordingly on a biochemistry instrument (SIEMENS, ADVIA chemistry XPT).
Definition of LDL-C and RC Concordant/Discordant Groups and Other Variables
RC (mmol/L) was calculated by subtracting HDL-C and LDL-C from TC using standard lipid profile measurements.20 In accordance with the recommendations outlined in the 2019 ESC/EAS Guidelines for the Management of Dyslipidaemias,21 we established cut-off points of 2.6 mmol/L (100 mg/dL) for LDL-C and 0.62 mmol/L (24 mg/dL) for RC. The phenotypes of RC/LDL-C were classified into four categories based on the concordance or discordance between LDL-C and RC: Group NRC+NLDL: Normal serum levels of both RC and LDL-C; Group NRC+HLDL: Normal serum levels of RC with elevated levels of LDL-C; Group HRC+NLDL: Elevated serum levels of RC with normal LDL-C; Group HRC+HLDL: Elevated serum levels of both RC and LDL-C. Hyperuricemia was characterized by sUA ≥420 μmol/L (7.0 mg/dL) in males and ≥360 μmol/L (6.0 mg/dL) in females while hypertriglyceridemia (HTG) was defined as serum triglyceride levels (sTG) ≥ 1.7 mmol/L (150 mg/dL).22 Smoking status was categorized as regular smoker (having smoked at least 100 cigarettes in one’s lifetime and currently smoking ≥20 cigarettes/day), occasional smoker (having smoked at least 100 cigarettes in one’s lifetime but currently smoking <20 cigarettes/day), or nonsmoker. Geographic location was classified as either urban or rural, while income levels were divided into low, medium, and high categories based on average annual incomes of <10,000 Yuan, <50,000 Yuan, and ≥50,000 Yuan respectively. Educational attainment was categorized as low (elementary school education or below), medium (junior high school education or above), and high (college education or above). Salt intake classifications included high (>10.0 g/day), medium (6.0–10.0 g/day), and low (<6.0 g/day).
Statistical Analysis
All statistical analyses were conducted using SPSS version 22.0 (SPSS Inc., Chicago, IL, USA). The baseline characteristics of participants were described according to four distinct lipid phenotypes. Variables that could be approximately considered to be normally distributed were expressed as means ± standard deviations (Means ± SDs). LDL-C and RC were skewed distributed and expressed as median and interquartile range (25–75%). Categorical variables were expressed as relative frequency (percentage). One-Way ANOVA test was utilized for the comparison of normally distributed data while the Mann–Whitney/ Kruskal–Wallis rank test was used for non-normally distributed data. Chi-square tests facilitated our assessment of categorical variables to identify significant differences across various groups. To evaluate independent associations between distinct lipid phenotypes and hyperuricemia, we performed logistic regression analyses yielding odds ratios (ORs) and their corresponding 95% confidence intervals (95% CIs). Covariates deemed clinically relevant or significantly differing at baseline comparisons were incorporated into our multivariate models. We established four primary covariable-adjusted models: Model I adjusted solely for age and gender; Model II further adjusted for ethnicity along with BMI, WC, income levels, educational attainment, and smoking status; Model III integrated additional adjustments based on DM and hypertension history; Model IV encompassed all prior adjustments plus sTG levels. Subgroup analyses examined how varying lipid phenotypes influenced hyperuricemia across diverse subgroups such as gender (male/female) and co-occurrence with HTG. For sensitivity analyses, we maintained consistency by applying identical logistic regression to evaluated the relationship between the phenotype of RC/LDL-C and HUA using a stricter cut-off value of LDL-C (1.80 mmol/L) according to established guideline recommendations.21,23 A two-tailed p-value less than 0.05 was regarded statistically significant.
Results
The Basic Characteristics of the Studied Population
The distribution of LDL-C and RC across discordant and concordant groups is illustrated in Figure 2. Elevated levels of RC were relatively less prevalent among participants with normal or high LDL-C, but were more frequently observed in the individuals with high LDL-C. The baseline characteristics of all participants categorized by the patterns of RC/LDL-C are presented in Table 1 (We also presented the baseline characteristics of men and women respectively as shown in Supplementary Material Table 1 and 2). Compared to the Group NRC+NLDL, individuals in the other groups were more likely to be male, older, less educated, and smokers. In Group HRC+HLDL, the proportion of Hui individuals was the smallest, while that of Uyghur individuals was the largest relative to other groups. Participants in the HLDL groups exhibited higher BMI and WC values and a greater propensity for hypertension compared to those in NLDL groups. Furthermore, when comparing NRC groups with HRC groups, there was a notable increase in prevalences of HUA, elevated sTG and sUA levels, as well as a heightened likelihood of concurrent DM. Subjects within Group HRC+HLDL had the highest sUA levels. The prevalence rates of hyperuricemia across the four groups—NRC+NLDL, NRC+HLDL, HRC+NLDL, and HRC+HLDL—were found to be 6.8%, 12.7%, 16.4%, and 19.8%, respectively.
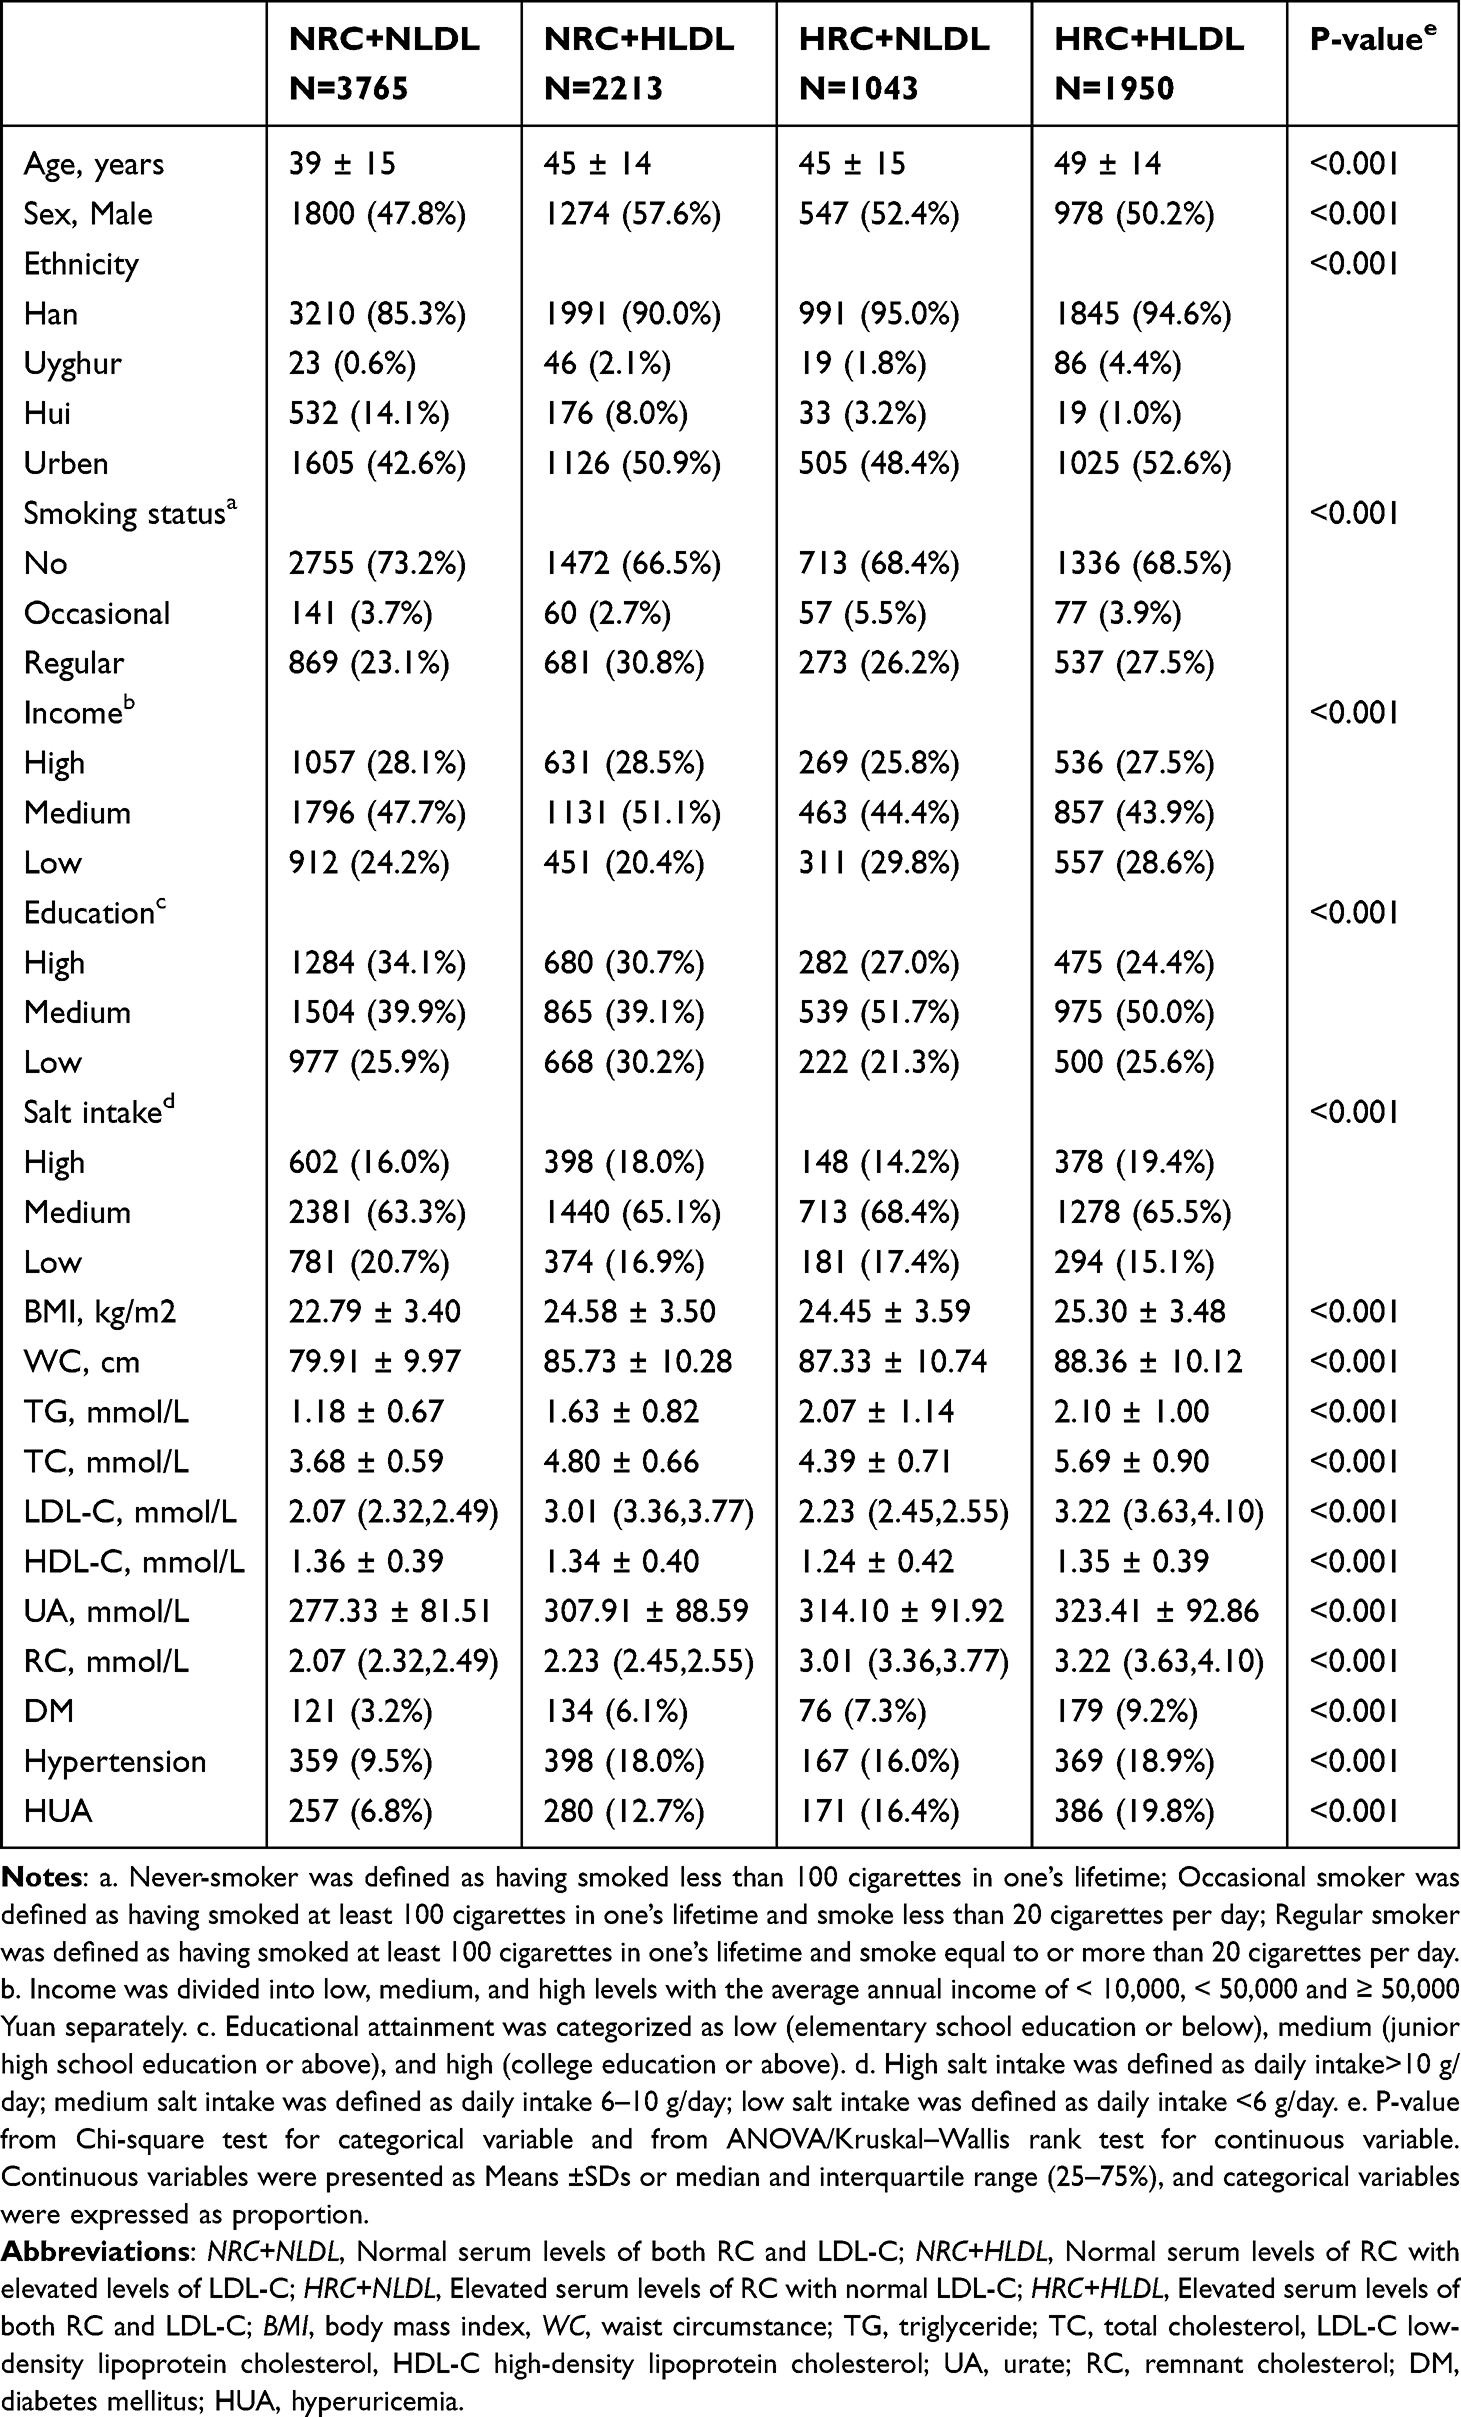 |
Table 1 The Basic Characteristics of Studied Participants (n=8971) |
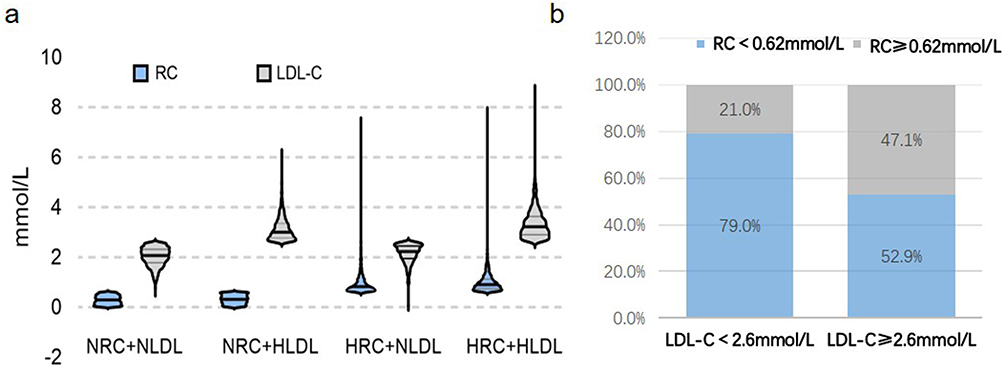 |
Figure 2 The distribution of LDL-C and RC by the discordant/concordant groups. (a) The box plot of the different LDL-C and RC levels. (b) The relative proportions of the discordant/concordant groups. Abbreviations: RC, remnant cholesterol; LDL-C low-density lipoprotein cholesterol; NRC+NLDL Normal serum levels of both RC and LDL-C; NRC+HLDL Normal serum levels of RC with elevated levels of LDL-C; HRC+NLDL Elevated serum levels of RC with normal LDL-C; HRC+HLDL Elevated serum levels of both RC and LDL-C. |
Associations of the Different Phenotypes of RC/LDL-C and HUA
Univariate analysis revealed significant associations between HUA and several factors including sex, ethnicity, BMI, WC, education attainments, income levels, smoking, DM, hypertension, and the different phenotypes of RC/LDL-C (Supplementary Material Table 3). As is shown in Table 2, multivariate modeling adjusted for age, sex, ethnicity, BMI, WC, educational attainments, income levels, smoking status, DM, and hypertension indicated that participants belonging to Group NRC+HLDL, Group HRC+NLDL, and Group HRC+HLDL experienced an increased risk for hyperuricemia by 37%, 96%, and 120% respectively (OR: 1.37, 95% CI: 1.13–1.66 for NRC+HDL; OR: 1.96, 95% CI: 1.57–2.45 for Group HRC+NLDL; OR: 2.20, 95% CI: 1.82–2.65 for HRC+HDL) relative to Group NRC+NLDL. In model IV adjusted for sTG levels, the other groups continued to demonstrate an elevated risk for hyperuricemia, with the most pronounced increase seen in Group HRC+HDL and higher risks also noted in Group HRC+NDL, consistent with findings from other models.
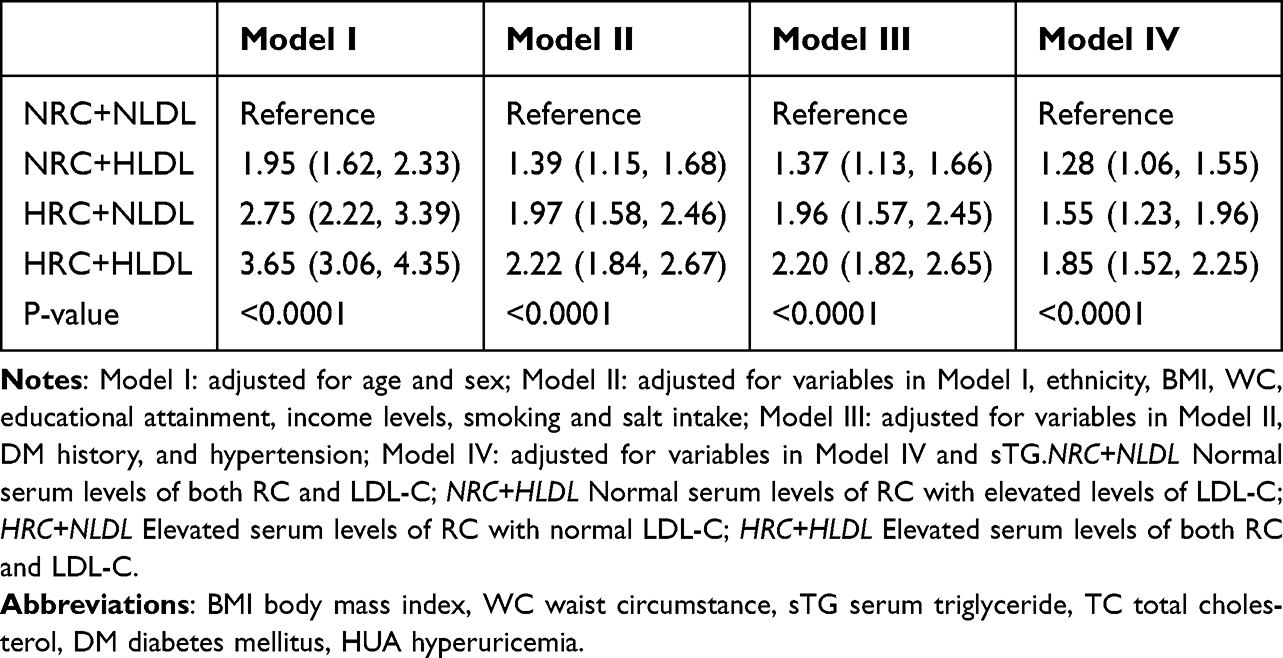 |
Table 2 The Associations Between Discordant/Concordant Groups and HUA |
Sensitivity and Subgroup Analysis
In the sensitivity analysis, we used stricter clinical indicators to evaluate the relationship between inconsistent/consistent groups and HUA, with the cut-off value of LDL-C (1.80 mmol/L). After adjusting the variables in model III and IV, we found that compared with the HLDL groups, the HRC groups were more closely related to HUA, among which Group HRC+NLDL was most closely related to HUA (OR: 2.89, 95% CI: 1.59–5.19 in model III; OR: 2.19, 95% CI: 1.21–3.99), as is shown in Table 3. In the subgroup analysis, tests for interaction were significant concerning gender and hypertriglyceridemia (p for interaction < 0.05) (Figure 3). Among females, the effects of discordance and concordance between RC and LDL-C on HUA were more pronounced. Compared to the Group NRC+NLDL, individuals in the Group NRC+HLDL exhibited an increased risk by 160%, while those in the Group HRC+NLDL showed an increased risk by 597%; furthermore, individuals in the Group HRC+HLDL experienced a staggering 749% increase in their risk for hyperuricemia (OR: 2.60, 95% CI: 1.25–5.43 for NRC+HLDL; OR: 6.97, 95% CI: 3.49–13.94 for HRC+NLDL; OR: 8.49, 95% CI: 4.60–15.66 for HRC+HLDL).
 |
Table 3 The Correlation Between Discordant/Concordant Groups (LDL-C 1.8) and HUA |
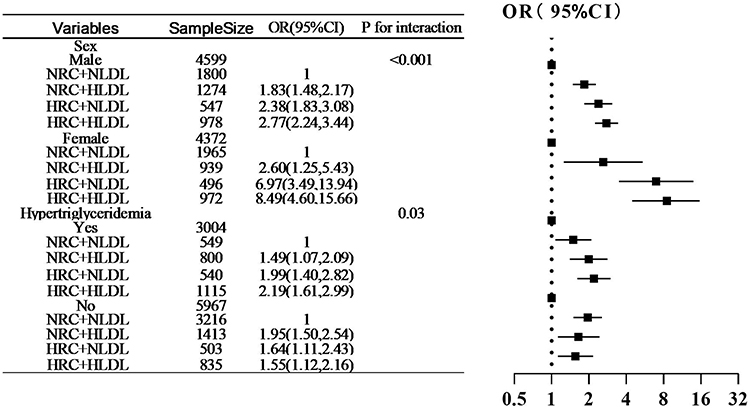 |
Figure 3 Subgroup analyses stratified by patient characteristics. Note: OR odds ratio, CI Confidence interval, NRC+NLDL Normal serum levels of both RC and LDL-C; NRC+HLDL Normal serum levels of RC with elevated levels of LDL-C; HRC+NLDL Elevated serum levels of RC with normal LDL-C; HRC+HLDL Elevated serum levels of both RC and LDL-C. |
Mediation Analysis
In our analysis utilizing the Process plug-in within SPSS alongside Sobel’s test to examine potential mediating effects on the relationship between RC and HUA, we identified significant indirect effects attributable to BMI and WC. Specifically, BMI and WC mediated 20.27% and 6.67% of this association respectively, as is illustrated in Figure 4.
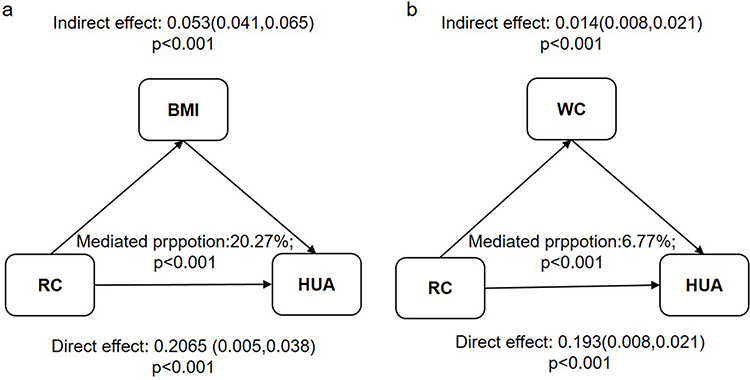 |
Figure 4 Mediation analysis of the association between RC and HUA. (a) Analyses of the mediation by BMI. (b) Analyses of the mediation by WC. Abbreviations: RC remnant cholesterol, HUA hyperuricemia, BMI body mass index, WC waist circumference. |
Discussion
The present study revealed that distinct lipid phenotypes, derived from concordant or discordant levels of LDL-C and RC, were differentially associated with the risk of HUA. The HRC+NLDL phenotype conferred greater risk than the NRC+HLDL phenotype, suggesting RC may play a more significant role than LDL-C in HUA pathogenesis. Furthermore, Individuals exhibiting consistently elevated levels of both RC and LDL-C demonstrated the highest risk for hyperuricemia, suggesting a synergistic effect of this two factors. Stratified analyses indicated notable gender disparities, with a markedly stronger association between RC and HUA observed in females.
RC refers to the cholesterol content of the TRLs that consist of VLDL in the fasting state and chylomicron remnants in the non-fasting state.24 Highlighted in recent lipid management, RC has been demonstrated to be more strongly associated with incident Cardiovascular Disease than LDL-C.14 Evidence also suggested that elevated RC not only predicted cardiovascular disease risk but also correlated with metabolic disorders and hypertension.13,15,25
To date, several epidemiological studies have explored the relationship between RC and HUA. Zhou et al analyzed data from the NHANES 2013 to 2020, demonstrating that elevated RC was independently associated with HUA. This association was particularly pronounced among females, individuals under 50 years of age, and those without diabetes.17 Longitudinal study derived from the China Health and Retirement Longitudinal Study (CHARLS) confirmed that high levels of RC served as an independent risk factor for hyperuricemia, potentially mediated by inflammation and hypertension.26 Another study observed a significant correlation between RC increases and HUA in hypertensive patients, partially mediated by BMI.19 Consistent with these findings, our study confirmed a significant association between elevated RC and increased HUA risk. Our innovative approach, categorizing participants by RC/LDL-C discordance/concordance and employing sensitivity analyses, further substantiated that RC’s impact on HUA surpasses that of LDL-C. Notably, this study is the first to include WC in mediation analysis, suggesting abdominal obesity as a potential biological mechanism linking RC to HUA.
Additionally, our findings indicated that females exhibit heightened susceptibility to HUA from elevated RC exposure, aligning with prior research.17 However, the precise mechanisms underlying these sex differences remain inadequately explored. Factors such as dietary structure variations and hormonal influences on blood lipid profiles may contribute to an increased susceptibility among females for developing HUA.
Direct mechanistic research on RC’s effects on uric acid metabolism is currently lacking. However, observed interactions at various levels—including inflammation, oxidative stress, and renal excretion—suggest several plausible pathways.
Firstly, RC is highly atherogenic—partly due to its ability to efficiently penetrate vascular endothelium and accumulate within arterial walls. In contrast to LDL-C, RC significantly contributes to systemic inflammation.11,27 An analysis of European Prospective Investigation into Cancer and Nutrition (EPIC)-Norfolk study showed that each 1 mmol/L increase in RC was associated with a 73% elevation in high-sensitivity C-reactive protein (hs-CRP).28 Another investigation found that elevated RC correlated with increased white blood cell counts and hs-CRP levels, indicating a frequent pro-inflammatory state.13 Chronic systemic low-grade inflammation may adversely affect renal function and hinder uric acid excretion.29
Secondly, RC are enriched in oxidized phospholipids and free cholesterol, both of which exhibit intrinsic pro-oxidative properties.30 In metabolic disorders like hypertriglyceridemia and nonalcoholic fatty liver disease, hepatic fatty acid oxidation may induce hypoxia-inducible factor 1-alpha, which transcriptionally activates xanthine dehydrogenase and cytoplasmic 5’-nucleotidase II within the uric acid synthesis pathway, thereby promoting hepatic uric acid production.31,32 Moreover, insulin resistance (IR) may act as both a mediator and an amplifier. RC and IR share a complex, intertwined relationship. Previous studies reported their correlation,33,34 and Lin et al demonstrated that IR mediation as a potential explanation for RC’s closer association with diabetes.13 Additionally, IR was suggested to be a well-established risk factor for HUA. IR can enhance the activity of sodium-hydrogen exchanger 3 in renal proximal tubular epithelial cells and activate urate transporter 1, resulting in increased reabsorption of uric acid.35 Although our study did not directly analyze the role of IR concerning RC and HUA, the observed mediation effects of BMI and WC indirectly suggest its potential significance.
Finally, excessive RC accumulation within the kidney may induce lipotoxicity, mitochondrial dysfunction, and endoplasmic reticulum stress—factors that can impair uric acid excretion.36 Animal study indicated that podocytes—crucial for maintaining glomerular filtration barrier integrity—were primary targets for excess cholesterol exposure within the glomerulus.37 Elevated RC levels have been proved independently linked to a decreased estimated glomerular filtration rate and an increased susceptibility of kidney dysfunction, which may consequently result in reduced uric acid excretion.38
Study Strengths and Limitations
Our study is the first, and currently the only one, to analyze the relationships between the LDL-C and RC concordant/discordant groups and hyperuricemia using large-scale survey data from China. The multivariable logistic regression model was adjusted for numerous potentially influencing covariates, including sex, age, ethnicity, income level, educational attainment, smoking status, BMI, WC, sTG levels, and comorbidities. This comprehensive adjustment enhances the reliability of our results. However, several limitations must be acknowledged. Firstly, the cross-sectional design of this study precludes any causal inference regarding lipid phenotypes and hyperuricemia. Additionally, reliance on self-reported data for lifestyle factors and past medical history may introduce bias that could affect observed associations. Besides, the interpretation of uric acid levels in this study was challenging due to the high prevalence of conditions like hypertension and diabetes, and the use of concomitant medications (eg, diuretics for hypertension, SGLT2 inhibitors for DM) that can alter uric acid, making it difficult to isolate the primary effect. Finally, although we accounted for most relevant confounders in our analysis, we did not measure serum creatinine levels to evaluate renal function; this omission may impact result accuracy due to the kidneys’ critical role in uric acid clearance.
Conclusions
In conclusion, our study demonstrates that discordance between LDL-C and RC is associated with hyperuricemia in the general population. RC exhibits a stronger association with HUA than LDL-C, a relationship partially mediated by both BMI and WC. Furthermore, this association is more pronounced in females, suggesting greater susceptibility to RC-related hyperuricemia. Future prospective studies are warranted to confirm the causal relationship between RC and hyperuricemia and to explore potential interventions targeting RC reduction.
Data Sharing Statement
Due to the sensitive nature of the personal health data collected for this study, the underlying raw data are not publicly available in accordance with ethical approvals and data protection regulations. De-identified data may be made available to qualified researchers upon reasonable request for the purpose of replicating the study findings. Requests should be directed to the corresponding author (email) and will require a signed data access agreement outlining the terms of use, confidentiality, and data security.
Ethical Approval
This study was approved by the Ethics Committee of the General Hospital of NingXia Medical University (KYLL-20240172). All procedures performed involving human participants were in accordance with the ethical standards and with the 1964 Helsinki declaration and its later amendments.
Acknowledgments
We give thanks to staff and all the participants in this survey for their valuable contributions.
Author Contributions
Xixuan Lu: Conceptualization, Methodology, Formal analysis, Funding acquisition, Writing – original draft; Haiyan Liang: Conceptualization, Writing – review and editing, Methodology; Xiaoli Zhou: Data curation, Writing – review and editing; Yuemei Wu: Data curation, Methodology, Writing – review and editing; Hong Lei: Writing –review and editing, Data curation; Liping Sha: Conceptualization, Supervision, Writing – review and editing. All authors took part in drafting, revising or critically reviewing the article; gave final approval of the version to be published; have agreed on the journal to which the article has been submitted; and agree to be accountable for all aspects of the work.
Funding
This work is supported by the Key Research and Development Project of Ningxia (Talent Introduction Project) (2023BSB03057).
Disclosure
The authors declare that they have no competing interests.
References
1. Borghi C, Agabiti-Rosei E, Johnson RJ, et al. Hyperuricaemia and gout in cardiovascular, metabolic and kidney disease. Eur J Internal Med. 2020;80:1–11. doi:10.1016/j.ejim.2020.07.006
2. Chen-Xu M, Yokose C, Rai SK, Pillinger MH, Choi HK. Contemporary prevalence of gout and hyperuricemia in the united states and decadal trends: the national health and nutrition examination survey, 2007-2016. Arthritis Rheumatol. 2019;71(6):991–999. doi:10.1002/art.40807
3. Zhang M, Zhu X, Wu J, et al. Prevalence of hyperuricemia among chinese adults: findings from two nationally representative cross-sectional surveys in 2015-16 and 2018-19. Front Immunol. 2021;12:791983. doi:10.3389/fimmu.2021.791983
4. Yuan S, Zhang ZW, Li ZL. Antacids’ side effect hyperuricaemia could be alleviated by long-term aerobic exercise via accelerating ATP turnover rate. Biomed Pharmacothe. 2018;99:18–24. doi:10.1016/j.biopha.2018.01.052
5. Deng F, Wang Q, Wen X, et al. Association between body mass index and serum uric acid: mediation analysis involving liver enzymes indicators. BMC Public Health. 2024;24(1):3007. doi:10.1186/s12889-024-20457-1
6. Kim YK, Yang YM. An analysis of the associations of high-sensitivity C-reactive protein and uric acid with metabolic syndrome components in Korean adults by sex: a cross-sectional study using the Korea national health and nutrition examination survey 2016-2018. BMC Endocr Disord. 2023;23(1):163. doi:10.1186/s12902-023-01417-z
7. Zhang Y, Zhang M, Yu X, et al. Association of hypertension and hypertriglyceridemia on incident hyperuricemia: an 8-year prospective cohort study. J Transl Med. 2020;18(1):409. doi:10.1186/s12967-020-02590-8
8. Fang Y, Mei W, Wang C, et al. Dyslipidemia and hyperuricemia: a cross-sectional study of residents in Wuhu, China. BMC Endocr Disord. 2024;24(1):2. doi:10.1186/s12902-023-01528-7
9. Xu J, Peng H, Ma Q, et al. Associations of non-high density lipoprotein cholesterol and traditional blood lipid profiles with hyperuricemia among middle-aged and elderly Chinese people: a community-based cross-sectional study. Lipids Health Dis. 2014;13:117. doi:10.1186/1476-511X-13-117
10. Peng TC, Wang CC, Kao TW, et al. Relationship between hyperuricemia and lipid profiles in US adults. Biomed Res. Int. 2015;2015:127596. doi:10.1155/2015/127596
11. Varbo A, Benn M, Tybjærg-Hansen A, Nordestgaard BG. Elevated remnant cholesterol causes both low-grade inflammation and ischemic heart disease, whereas elevated low-density lipoprotein cholesterol causes ischemic heart disease without inflammation. Circulation. 2013;128(12):1298–1309. doi:10.1161/CIRCULATIONAHA.113.003008
12. Varbo A, Freiberg JJ, Nordestgaard BG. Extreme nonfasting remnant cholesterol vs extreme LDL cholesterol as contributors to cardiovascular disease and all-cause mortality in 90000 individuals from the general population. Clin. Chem. 2015;61(3):533–543. doi:10.1373/clinchem.2014.234146
13. Hu X, Liu Q, Guo X, et al. The role of remnant cholesterol beyond low-density lipoprotein cholesterol in diabetes mellitus. Cardiovasc. Diabetol. 2022;21(1):117. doi:10.1186/s12933-022-01554-0
14. Castañer O, Pintó X, Subirana I, et al. Remnant Cholesterol, Not LDL cholesterol, is associated with incident cardiovascular disease. J Am Coll Cardiol. 2020;76(23):2712–2724. doi:10.1016/j.jacc.2020.10.008
15. Cheng Y, Zhang Q, Li H, et al. Remnant cholesterol, stronger than triglycerides, is associated with incident non-alcoholic fatty liver disease. Front Endocrinol. 2023;14:1098078. doi:10.3389/fendo.2023.1098078
16. Wu Y, Wei Q, Li H, et al. Association of remnant cholesterol with hypertension, type 2 diabetes, and their coexistence: the mediating role of inflammation-related indicators. Lipids Health Dis. 2023;22(1):158. doi:10.1186/s12944-023-01915-y
17. Zhou X, Weng X, Xu J, Wang W. Correlation between remnant cholesterol and hyperuricemia in American adults. Lipids Health Dis. 2024;23(1):176. doi:10.1186/s12944-024-02167-0
18. Wang Z, Wu M, Yan H, et al. Association between remnant cholesterol and risk of hyperuricemia: a cross-sectional study. Hormone Metab Res. 2024;56(12):882–889. doi:10.1055/a-2299-2914
19. Zhou W, Wang T, Zhu L, et al. Associations of body mass index and remnant cholesterol with hyperuricemia in patients with hypertension. BMC Endocr Disord. 2025;25(1):73. doi:10.1186/s12902-025-01902-7
20. Nordestgaard BG, Varbo A. Triglycerides and cardiovascular disease. Lancet. 2014;384(9943):626–635. doi:10.1016/S0140-6736(14)61177-6
21. Mach F, Baigent C, Catapano AL, et al. ESC/EAS Guidelines for the management of dyslipidaemias: lipid modification to reduce cardiovascular risk. Eur Heart J. 2020;41(1):111–188. doi:10.1093/eurheartj/ehz455
22. Piao W, Zhao L, Yang Y, et al. The prevalence of hyperuricemia and its correlates among adults in China: results from CNHS 2015-2017. Nutrients. 2022;14(19):4095. doi:10.3390/nu14194095
23. Grundy SM, Stone NJ, Bailey AL, et al. AHA/ACC/AACVPR/AAPA/ABC/ACPM/ADA/AGS/APhA/ASPC/NLA/PCNA guideline on the management of blood cholesterol: a report of the American College of Cardiology/American Heart Association Task Force on clinical practice guidelines. J Am Coll Cardiol. 2019;73(24):e285–e350. doi:10.1016/j.jacc.2018.11.003
24. Jørgensen AB, Frikke-Schmidt R, West AS, Grande P, Nordestgaard BG, Tybjærg-Hansen A. Genetically elevated non-fasting triglycerides and calculated remnant cholesterol as causal risk factors for myocardial infarction. Eur Heart J. 2013;34(24):1826–1833. doi:10.1093/eurheartj/ehs431
25. Shi L, Zhang D, Ju J, et al. Remnant cholesterol associates with hypertension beyond low-density lipoprotein cholesterol among the general US adult population. Front Endocrinol. 2023;14:1260764. doi:10.3389/fendo.2023.1260764
26. Ma J, Xu F, Zhang Y. Remnant cholesterol elevates hyperuricemia risk in the middle aged and elderly Chinese: a longitudinal study. Sci Rep. 2024;14(1):24616. doi:10.1038/s41598-024-75951-8
27. Nordestgaard BG. Triglyceride-rich lipoproteins and atherosclerotic cardiovascular disease: new insights from epidemiology, genetics, and biology. Circulation Res. 2016;118(4):547–563. doi:10.1161/CIRCRESAHA.115.306249
28. Kraaijenhof JM, Kerkvliet MJ, Nurmohamed NS, et al. The role of systemic inflammation in remnant cholesterol associated cardiovascular risk: insights from the EPIC-Norfolk study. Eur. J. Prev. Cardiol. 2025. doi:10.1093/eurjpc/zwaf037
29. Maiuolo J, Oppedisano F, Gratteri S, Muscoli C, Mollace V. Regulation of uric acid metabolism and excretion. Int J Cardiol. 2016;213:8–14. doi:10.1016/j.ijcard.2015.08.109
30. Ginsberg HN, Packard CJ, Chapman MJ, et al. Triglyceride-rich lipoproteins and their remnants: metabolic insights, role in atherosclerotic cardiovascular disease, and emerging therapeutic strategies-a consensus statement from the European Atherosclerosis Society. Eur Heart J. 2021;42(47):4791–4806. doi:10.1093/eurheartj/ehab551
31. Choi YJ, Shin HS, Choi HS, et al. Uric acid induces fat accumulation via generation of endoplasmic reticulum stress and SREBP-1c activation in hepatocytes. Lab investigat. 2014;94(10):1114–1125. doi:10.1038/labinvest.2014.98
32. Huang L, He X, Peng W, et al. Hyperuricemia induces liver injury by upregulating HIF-1α and inhibiting arginine biosynthesis pathway in mouse liver and human L02 hepatocytes. Biochem. Biophys. Res. Commun. 2022;617(Pt 2):55–61. doi:10.1016/j.bbrc.2022.05.096
33. Ohnishi H, Saitoh S, Takagi S, et al. Relationship between insulin-resistance and remnant-like particle cholesterol. Atherosclerosis. 2002;164(1):167–170. doi:10.1016/S0021-9150(02)00057-6
34. Funada J, Sekiya M, Otani T, Watanabe K, Sato M, Akutsu H. The close relationship between postprandial remnant metabolism and insulin resistance. Atherosclerosis. 2004;172(1):151–154. doi:10.1016/j.atherosclerosis.2003.09.016
35. Facchini F, Chen YD, Hollenbeck CB, Reaven GM. Relationship between resistance to insulin-mediated glucose uptake, urinary uric acid clearance, and plasma uric acid concentration. JAMA. 1991;266(21):3008–3011. doi:10.1001/jama.1991.03470210076036
36. Song Y, Liu J, Zhao K, Gao L, Zhao J. Cholesterol-induced toxicity: an integrated view of the role of cholesterol in multiple diseases. Cell Metab. 2021;33(10):1911–1925. doi:10.1016/j.cmet.2021.09.001
37. Ducasa GM, Mitrofanova A, Mallela SK, et al. ATP-binding cassette A1 deficiency causes cardiolipin-driven mitochondrial dysfunction in podocytes. J Clin Invest. 2019;129(8):3387–3400. doi:10.1172/JCI125316
38. Yan P, Xu Y, Miao Y, et al. Association of remnant cholesterol with chronic kidney disease in middle-aged and elderly Chinese: a population-based study. Acta diabetologica. 2021;58(12):1615–1625. doi:10.1007/s00592-021-01765-z
 © 2025 The Author(s). This work is published and licensed by Dove Medical Press Limited. The
full terms of this license are available at https://www.dovepress.com/terms
and incorporate the Creative Commons Attribution
- Non Commercial (unported, 4.0) License.
By accessing the work you hereby accept the Terms. Non-commercial uses of the work are permitted
without any further permission from Dove Medical Press Limited, provided the work is properly
attributed. For permission for commercial use of this work, please see paragraphs 4.2 and 5 of our Terms.
© 2025 The Author(s). This work is published and licensed by Dove Medical Press Limited. The
full terms of this license are available at https://www.dovepress.com/terms
and incorporate the Creative Commons Attribution
- Non Commercial (unported, 4.0) License.
By accessing the work you hereby accept the Terms. Non-commercial uses of the work are permitted
without any further permission from Dove Medical Press Limited, provided the work is properly
attributed. For permission for commercial use of this work, please see paragraphs 4.2 and 5 of our Terms.