Back to Archived Journals » Open Access Journal of Sports Medicine » Volume 7
Reliability and concurrent validity between two-dimensional and three-dimensional evaluations of knee valgus during drop jumps
Authors Ortiz A ![]() , Rosario-Canales M, Rodríguez A, Seda A, Figueroa C, Venegas-Ríos H
, Rosario-Canales M, Rodríguez A, Seda A, Figueroa C, Venegas-Ríos H
Received 10 November 2015
Accepted for publication 11 March 2016
Published 27 May 2016 Volume 2016:7 Pages 65—73
DOI https://doi.org/10.2147/OAJSM.S100242
Checked for plagiarism Yes
Review by Single anonymous peer review
Peer reviewer comments 4
Editor who approved publication: Prof. Dr. Andreas Imhoff
Alexis Ortiz1, Martin Rosario-Canales2,3, Alejandro Rodríguez3, Alexie Seda3, Carla Figueroa3, Heidi L Venegas-Ríos4
1School of Physical Therapy, Texas Woman’s University, Houston, TX, 2Department of Anatomy & Neurobiology, 3Department of Physical Therapy, University of Puerto Rico, Medical Sciences Campus, San Juan, PR, 4School of Nutrition & Food Sciences, Texas Woman’s University, Houston, TX, USA
Purpose: The aim of this study was to establish the concurrent validity and reliability of four different two-dimensional (2D) video-based techniques for quantifying frontal plane knee kinematics during a 40 cm double-legged drop jump.
Participants and methods: A convenience sample of 16 healthy participants (nine males and seven females; age: [mean ± standard deviation] 25.5±2 years; body mass index: 24.33±2.98 kg/m2) participated in this investigation. A total of five trials during a 40 cm drop jump maneuver with a countermovement jump were used as the functional task. Four knee valgus measures, such as two different frontal plane projection angle measures, knee-to-ankle separation ratio (KASR), and knee separation distance (KSD), were measured using 2D and three-dimensional (3D) systems. To generalize to the greater population of possible evaluators, the testers performing the biomechanical analyses were three novice physical therapists. Intra- and intertester intraclass correlation coefficients (ICCs) were estimated for 2D analysis variables. ICCs were estimated for all measures between systems to determine concurrent validity of the 2D system.
Results: All four 2D measures showed good to excellent reliability (ICC: 0.89–0.99). KASR and KSD showed excellent correlation (ICC: 0.96; 95% CI: 0.82–0.98 and ICC: 0.94; 95% CI: 0.90–0.96, respectively) with the 3D system, while both methods of frontal plane projection angle showed poor to moderate correlation (ICC: 0–0.57) with the 3D system.
Conclusion: 2D KASR and KSD measures are cost effective, reliable, and highly correlated with the same measures using 3D techniques for the evaluation of knee valgus.
Keywords: Dartfish, Vicon, motion analysis, correlation
Introduction
Knee injuries have one of the highest incidences among lower extremity injuries, with anterior cruciate ligament (ACL) and patellofemoral pain syndrome being the most common among individuals participating in sports and recreational activities.1 The ACL is the most frequently injured ligament of the knee, with ∼300,000 new cases per year in the USA.2 Patellofemoral pain syndrome is one of the most common lower extremity musculoskeletal disorders, affecting between 15% and 45% of the active adult population.3,4 Prevention of these disorders is essential. The mechanisms and risk factors associated with both disorders have been widely investigated, with the greatest risk factors being abnormal joint biomechanics, deficient neuromuscular control, and malalignment of the lower extremity.5 Dynamic knee valgus (DKV) is described as altered hip and knee kinematics in the frontal and transverse planes during weight-bearing activities.6,7 DKV encompasses a movement pattern characterized by excessive femoral adduction, femoral internal rotation, knee abduction, and external tibial rotation.8–11 An excessive DKV during bilateral or unilateral landing activities and during the stance phase of gait has been reported to be associated with ACL injuries9–11and patellofemoral joint injuries.7
Three-dimensional (3D) motion analysis is considered as the gold standard to measure and identify potential mechanisms and risk factors for knee injuries during functional tasks.12 Hewett et al9 reported that knee abduction angles quantified with 3D motion analysis techniques at the beginning of the athletic season predict ACL injury risk in female athletes with high sensitivity (78%) and specificity (73%). One of the most frequently used testing tasks for the assessment of DKV is a drop vertical jump (DVJ) due to its high within-session reliability values for kinematic (intraclass correlation coefficient [ICC] =0.93–0.99) and kinetic (ICC =0.66–0.93) variables.13 Nonetheless, 3D camera motion analysis systems have several disadvantages, such as substantial financial investment to acquire all the necessary equipment, lack of portability, large space requirement for placement of the equipment, detailed preparation of the subject, time-consuming data collection and data analysis, and advanced technical skills and knowledge to manage the computer software.14 Therefore, all these factors make this technology difficult to use as an injury-prevention screening tool in the daily clinical practice or on the sports field.
The use of two-dimensional (2D) motion analysis video systems could help in closing the gap between laboratory measures and the athlete by allowing testing in the athlete’s playing field. Frontal plane knee motions can quantify DKV using 2D motion analysis video systems.7,10–12,15 Recently, new studies have proposed 2D motion analysis methods to screen for DKV. Mizner et al16 have recommended the frontal plane projection angle (FPPA; r2=0.15) and the knee-to-ankle separation ratio (KASR; r2=0.35) as a potential proxy instead of 3D motion kinematics for assessing DKV.16 Willson and Davis7 reported a correlation between the FPPA and hip adduction (r=0.32–0.38) and knee external rotation (r=0.48–0.55) during a single-leg squat, concluding that the FPPA during single-leg squats may be a useful clinical measure for identifying DKV. Given the concern of a constant relationship among 2D DKV and 3D measures in the frontal plane, McLean et al17 compared frontal plane kinematics between 2D and 3D systems during a side step (r2=0.58) and a side jump (r2=0.64) in collegiate basketball players, reporting good consistency among systems. Recently, another method to measure FPPA using a 2D analysis system (Dartfish™, Dartfish Inc., Fribourg, Switzerland) has been developed and recommended.18 This new method differs from the original method in that the fulcrum of the angle is set at the ankle joint instead of the knee, eliminating the need for markers at the anterior superior iliac spine (ASIS).18 Other 2D measures used to identify DKV during functional tasks are the KASR and the knee separation distance (KSD). The KASR has been recommended as the best method of screening athletes at risk for knee injury,16 while the KSD measures have been identified as being a good predictor of knee abduction angles during functional tasks.12
If the 2D measures of frontal plane kinematics, such as the FPPA, KASR, and KSD, correlate with the 3D camera motion capture measures, their use as a cost-effective injury-prevention screening tool in everyday clinical practice and sports settings is warranted. Therefore, the purposes of this study were as follows: 1) to establish the interrater and intrarater reliabilities for each of the 2D measures and 2) to correlate different 2D motion analysis techniques for quantifying FPPA, KASR, and KSD against 3D camera motion capture measures during a double-legged 40 cm drop jump. It was hypothesized that all 2D measures would exhibit good to excellent (ICC ≥0.80) interrater and intrarater reliabilities and that the correlation between 2D and 3D measures would be good to excellent (ICC ≥0.80).
Participants and methods
Participants
Sixteen healthy physically active participants from the collegiate community (nine males and seven females; age: [mean ± standard deviation] 25.5±2 years; height: 1.68±0.1 m; mass: 68.59±11.76 kg; body mass index: 24.33±2.98 kg/m2; leg dominance: 81% right and 19% left) volunteered to participate in this study. They reported to the biomechanics research laboratory for a single testing session after signing an informed consent form. The Institutional Review Board of University of Puerto Rico approved this study. Inclusion criteria comprised of 1) age range from 21 years to 30 years and 2) self-reported capacity of performing jumps with two legs. Exclusion criteria included 1) any neuromusculoskeletal conditions affecting walking or jumping, 2) back or lower extremity pain or surgery, 3) injuries to the back and lower limbs in the past 6 months, and 4) self-reported pregnancy.
Testing procedures
Male participants were required to wear only shorts (mid-thigh level), low ankle socks, and low ankle tennis shoes. Female participants were required to wear a sport bra, shorts (mid-thigh level), low ankle socks, and low ankle tennis shoes. Participants were allowed their preferred tennis shoes to prevent any pain at landing that could alter their landing mechanics. Participants were required to use the same tennis shoes in both sessions. After informed consent procedures, anthropometric measurements for each subject according to Vicon™ (Vicon Motion Systems Inc., Denver, CO, USA) plug-in-gait model followed.19,20 Anthropometric measures included height (cm), weight (kg), distance between ASIS (mm), and bilateral knee width (mm), ankle width (mm), and leg length (mm). We measured weight and height using a calibrated scale and stadiometer, while joint width and leg length were measured in supine with an anthropometer (Lafayette Instrument Co., Lafayette, IN, USA) and measuring tape, respectively. Each subject practiced the DVJ three times to familiarize themselves with the testing procedures. After practice trials, we placed 15 retroreflective markers on participants based on Vicon plug-in-gait model. Markers were placed at the second sacral vertebra (between posterior superior iliac spines) and bilaterally at ASISs, lateral femoral epicondyles, mid-thigh (between lateral femoral epicondyles and greater trochanters), lateral malleoli, mid-shank (between lateral femoral epicondyles and lateral malleoli), posterior calcaneal tuberosity, and second metatarsal phalangeal joint. Each subject performed seven measured trials of the DVJ with ≥1 minute of rest between trials. The purpose of measuring seven trials was that previous research has reported that five trials are needed for reliable measurements for knee valgus.21 Therefore, in case there were instrumentation issues requiring the elimination of trials, collecting seven trials allowed us to gather sufficient trials to acquire the five good ones needed for analyses. The specific procedure performed for the DVJ has been described elsewhere.21,22 Briefly, each subject stood on the 40 cm platform with arms across their chest waiting for the verbal command to jump. After receiving the verbal command to jump, participants dropped from the platform when they felt ready to do so. At landing, participants spent the minimum amount of time in contact with the floor by performing a maximal vertical jump, attempting to touch the ceiling of the laboratory.
Instrumentation
The instruments used in this study were a 3D Vicon™ motion analysis system (Vicon Motion Systems Inc.; 120 Hz sampling rate) and a 30 Hz commercial camcorder time synchronized by a trigger mechanism. Before any data collection sessions, we calibrated the equipment, following recommendations provided by the manufacturer. After space calibration, a static trial with the participant standing in a T-position followed. The camcorders were located in a standardized position and height for every subject; 1.82 m in front (perpendicular) and 2.43 m to the side of the landing area to get a direct view of frontal (front view) and sagittal plane (side view) knee motions. A 435.9 mm × 368.8 mm pressure mat (Tekscan Inc., Boston, MA, USA) was located in front of the drop box with the purpose of serving as a reference object for the 2D video analysis system. For two of the 2D methods (KSD and KASR), where distance measures were needed, a standard distance is required to serve as reference for the Dartfish™ software.
Data reduction
3D data
We integrated all the data using Vicon Nexus 1.7™ software (Vicon Motion Systems Inc.). Frontal plane projection angles and distance between femoral epicondyles and lateral malleoli landmarks were derived from the trajectory of retroreflective markers using a second-order Butterworth filtering process in order to obtain the outcome measures of FPPA, KASR, and KSD. Knee and shank motions’ first, second, and third rotations were defined in the sagittal, frontal, and transverse planes, respectively. Pelvis-to-thigh (hip joint), thigh-to-shank (knee), and shank-to-foot (ankle) local frame unit vectors served as the local reference frames using Euler angle calculations. We recorded FPPA, KASR, and KSD at peak knee flexion during the first landing immediately after stepping off from the drop box. In order to extract data for the KSD, such distance was obtained on the following two different time frames: first, during initial contact of both feet and, second, when peak knee flexion on the sagittal plane was observed. We defined initial contact in the 2D and 3D systems as the first frame in which ground contact was observed. We considered peak knee flexion for both systems as the maximum angle between the thigh and shank segments during the ground contact phase. In Vicon Nexus 3D motion analysis system, FPPA, KASR, and KSD measures were acquired using the functions “projected angles” and “distance between” and selecting the desired segments and retroreflective markers. For the FPPA, we considered the angulation between the thigh and shank segments. For the KASR and KSD, we considered the markers at the lateral femoral epicondyles and lateral malleoli. Once we introduced this function, the system automatically calculated the projected angle or distance between the selected markers, based on the subject’s anthropometric measurements, subject’s calibration, and system calibration (global coordinate system).
2D data
We imported data recorded at 30 Hz with the commercial camcorder to Dartfish™ Pro Suite Software (Dartfish Inc., Switzerland) for conversion to still images. Dartfish™ software obtained all four outcome measures: methods 1 and 2 of FPPA, KASR, and KSD. Three different members of the research team calculated all Dartfish™ measurements on two different occasions separated by 1 week. Both times, each tester performed the entire process for all trials, from establishing reference points (initial contact and peak knee flexion) to the calculation of outcomes of interest. Each research member was blinded to measures of the other two members. Testers were novice Dartfish™ users and underwent a 4-week training to use the software. Dartfish™ software calculated FPPAs using two different techniques.
FPPA – method 1
We established FPPA as the angulation exhibited by the subject in Figure 1A.7 The body landmarks used as referenced for this angulation were the ASIS, mid-patella, and midpoint between both malleoli (medial and lateral) at the distal tibia. Another important landmark identified was a midpoint in the thigh, placed in a straight line connecting the ASIS with the mid-patella. This landmark was used in those trials where the ASIS could not be identified due to excessive trunk flexion at landing. We obtained this measure when the subject reached peak knee flexion during the ground contact phase. For the 2D video system, we defined peak knee flexion as the one frame before the subject started to increase knee extension in order to perform the maximum vertical jump. In the 3D system, FPPA was determined by the angulation of the thigh and shank segments by valgus values indicated by knee joint moving medially.
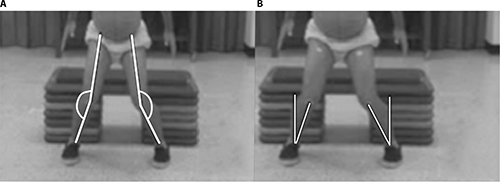 | Figure 1 Frontal plane projection angles. Notes: (A) Method 1 established as the angulation exhibited by a line across ASIS, mid-patella, and the midpoint between both malleoli at the distal tibia. Vertical line represents zero degrees with counterclockwise movements of the lower fulcrum (knee to ankle line), representing valgus alignment for the left leg and clockwise movement for the right leg. (B) Method 2 established as the angulation exhibited by mid-patella and midpoint between both ankle malleoli. Motion started at zero in the vertical position with mid-patella to ankle fulcrum, representing valgus while moving clockwise for the right leg and counterclockwise for the left leg. Abbreviation: ASIS, anterior superior iliac spine. |
FPPA – method 2
We established FPPA as the angulation exhibited by the subject in Figure 1B.18 The body landmarks used as reference for this angulation were mid-patella and midpoint between both ankle malleoli. Similar to method 1, we took this measure at peak knee flexion during ground contact. The difference between these two measures was that the fulcrum point of the angle was set at the ankle joint (midpoint between medial and lateral malleoli). By default, the Dartfish™ software establishes a reference vertical line going from the top of the screen (0°). Therefore, we placed the first side of the angle as a perpendicular line and the second side of the angle on the mid-patella resulting in the desired frontal plane projection angle. In the 3D system, the FPPA angle was established similarly to method 1.
KASR
The KASR was determined using both systems (2D and 3D) by measuring the horizontal distance between the retroreflective markers positioned on each lateral femoral epicondyle, and horizontal distance between the retroreflective markers positioned on each lateral ankle malleoli (Figure 2).16 Then, the KASR was defined as the ratio of distance between lateral femoral epicondyles (knee) and lateral malleoli (ankle) (KASR = knee/ankle) during peak knee flexion. A ratio of 1.0 represented knees directly on top of ankles. A ratio <1.0 represented knees medial to ankles (valgus) and >1.0, represented that knees were lateral to ankles (varus).
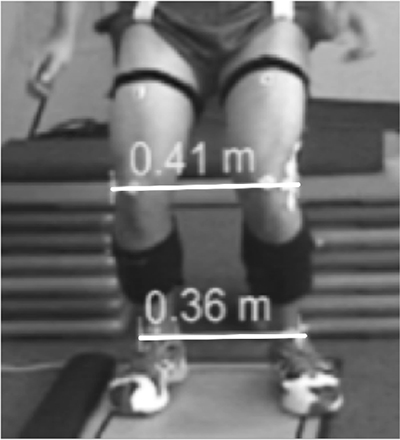 | Figure 2 KASR defined as the ratio of distance between lateral femoral epicondyles (knee) and lateral malleoli (ankle) (KASR = knee/ankle) during peak knee flexion. Abbreviation: KASR, knee-to-ankle separation ratio. |
KSD
We quantified the KSD using both systems as the distance (in meters) between the right and left lateral femoral epicondyles markers during the two different times of the landing phase.12,23 First measurement was during the initial contact phase (Figure 3A), and the second when the subject reached maximal peak knee flexion during the ground contact phase (Figure 3B). Finally, the KSD was expressed as the difference between lateral femoral epicondyles during peak knee flexion (d2) and initial contact (d1) (KSD = d2 – d1). Negative and positive values denoted valgus and varus alignments, respectively.
 | Figure 3 KSD quantified as the distance (in meters) between the right and left lateral femoral epicondyle markers between initial contact phase (A) and peak knee flexion (B). Abbreviation: KSD, knee separation distance. |
Statistical analysis
Data were analyzed using SPSS for Windows, Version 16.0 (SPSS Inc., Chicago, IL, USA). Two-way mixed and two-way random analysis of variance (ANOVA) models were conducted to estimate variance due to participants’ effect and rater, time, or system effects and to determine ICCs depending on which reliability measure was evaluated. We calculated intrarater and interrater reliabilities for each of the four 2D outcome measures. ANOVA two-way mixed effects models ICC (3, 1) with random participants’ effects and fixed time of measurement effects provided estimations for ICC for intrarater reliability as these represented the only two times of interest. We also calculated the standard error of measurement with their respective 95% confidence interval for the intrarater reliability values. In contrast, ANOVA two-way random effects’ models (ICC [2, 1]), where both participants’ effects and raters’ effects were considered as random in order to generalize results to a larger population of potential raters provided estimations for ICC for interrater reliability. We used Portney and Watkins’s24 criteria for the evaluation of reliability as follows: ≥0.75 good, 0.50–0.74 moderate, 0.26–0.50 fair, and ≤0.25 poor.
For the correlations between both methods of 2D and 3D FPPA measures, the average of the first three consecutive trials of the DVJ was chosen for analysis. For the correlations between 3D and 2D measures of KASR and KSD, we chose the first four consecutive trials of the DVJ for analysis. The difference in the number of trials between tasks was due to the highly instrumented nature of this study where missing data were bound to occur. Therefore, we considered the maximum number of trials that were completed in a consecutive manner and common to all participants. ANOVA two-way mixed effects models ICC (3, 1), with random participants’ effects and fixed systems’ effects, as these represented the only two systems of interest, provided estimations for the correlation between 3D and 2D measures. These ICC measures established the correlation of the 2D measures of FPPA, KASR, and KSD. We considered a 5% significance level to estimate CIs for all intrarater and interrater reliability coefficients as well as for correlation coefficients. The same Portney and Watkins’s24 criteria for the evaluation of correlations were used.
Results
All data met normality assumptions according to Shapiro–Wilk test. Mean values for each of the 2D and 3D outcome measures are presented in Table 1. ICC values for intrarater reliability, interrater reliability, and correlation between 2D and 3D variables for each of the outcomes measures are presented in Tables 2 and 3.
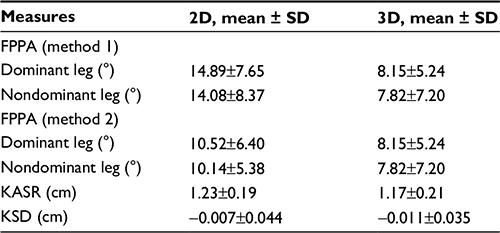 | Table 1 Mean values for 2D and 3D variables during drop jumps Notes: For the KASR, values >1 denote varus, and values <1 denote valgus. For the KSD, positive values represent varus, and negative values represent valgus. Abbreviation: 2D, two-dimensional; 3D, three-dimensional; FPPA, frontal plane projection angle; KASR, knee-to-ankle separation ratio; KSD, knee separation distance; SD, standard deviation. |
 | Table 2 Intrarater reliability of 2D FPPA, KASR, and KSD measures during drop jumps Abbreviation: 2D, two-dimensional; FPPA, frontal plane projection angle; ICC, intraclass correlation coefficient; KASR, knee-to-ankle separation ratio; KSD, knee separation distance; SEM, standard error of measurement; CI, confidence interval. |
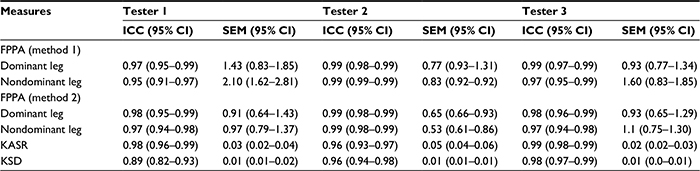
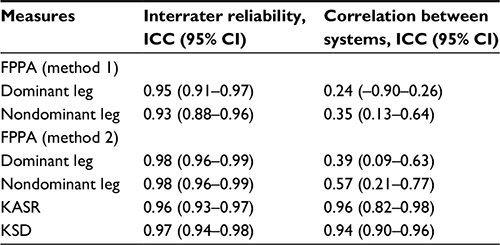 | Table 3 Interrater reliability for Dartfish™ measures and correlation between 2D and 3D FPPA, KASR, and KSD variables Notes: Correlations of 2D and 3D values were estimated using tester 2, given this tester was the one with less variability. Abbreviation: 2D, two-dimensional; 3D, three-dimensional; FPPA, frontal plane projection angle; ICC, intraclass correlation coefficient; KASR, knee-to-ankle separation ratio; KSD, knee separation distance; CI, confidence interval. |
FPPA – method 1
ICC for 2D measures showed good-to-excellent intrarater and interrater reliabilities for both dominant and nondominant legs with values ≥0.95 for the intrarater reliability (Table 2) and ≥0.93 for the interrater reliability (Table 3). The correlation between this method and 3D measures demonstrated poor to fair correlation (Table 3).
FPPA – method 2
Similar to the FPPA method 1, ICCs for this method showed excellent intrarater (ICCs >0.95; Table 2) and interrater (ICCs >0.98; Table 3) reliabilities for both legs. This method demonstrated fair to moderate correlation with 3D FPPA measures (<0.57; Table 3).
KASR
This measure showed an excellent intrarater (ICC >0.96; Table 2) and interrater (ICC >0.96) reliabilities as well as an excellent correlation (ICC =0.96) with 3D measures (Table 3).
KSD
The KSD measure showed a good-to-excellent intrarater reliability (ICC >0.89; Table 2), interrater reliability (ICC >0.97) and correlation (ICC =0.94) with 3D measures (Table 3).
Discussion
The main objective of this study was to evaluate four different 2D techniques for the analysis of frontal plane knee kinematics. In order to perform this, we compared all four 2D measures used in this study with their corresponding 3D counterparts for both dominant and nondominant legs. All four 2D techniques have been used previously to determine their ability to quantify and predict DKV during dynamic tasks for potential use in clinical screening. Nevertheless, not all of them have been compared with 3D measures in order to confirm their validity. FPPAs, KASR, and KSD have been reported to be promising 2D video-based techniques for such analyses.12,16–18
3D measures of knee valgus and 2D measures of FPPA have been used to identify an increased knee valgus in multiple populations. As reported in the literature, high knee abduction moments and knee valgus joint angles during landing activities increase the risk for ACL injuries in female athletes with high sensitivity and specificity.25 The vast majority of studies have used FPPA only testing the dominant leg.15–17 In contrast, our study focused on testing the nondominant leg in addition to the dominant leg to observe any variation between legs when validated against the 3D system. By having both legs present with reliable data, investigators can rest assured any comparison between legs is accurate.
Our results indicated that both 2D techniques of FPPA (methods 1 and 2) demonstrated excellent intrarater (Table 2) and interrater (Table 3) reliabilities for both dominant and nondominant legs with ICC values ranging from 0.95 to 0.99. Our reliability results are comparable with previously reported intrarater (ICC =0.95) and interrater (ICC =0.89) reliability values where method 1 for estimating FPPA has been used during a DVJ.16 The literature has not yet established ICC values for interrater and intrarater reliabilities for method 2 of FPPA. To the best of our knowledge, this is the first study to investigate the reliability and validity of such a technique. The advantage of this technique is that it does not require confounding markers or reference points above the knee joint, making the assessment faster and more accurate as evidenced by smaller 95% CIs and standard error of measurement and greater correlation with the 3D system.
We found a poor-to-moderate correlation, for both legs, when we compared both 2D techniques of estimating FPPA against 3D measures. Our results of poor to moderate correlation between 2D and 3D measures are in agreement with other investigations in which correlations between 2D frontal plane projection angles and 3D projection angles during single-leg squats, single-leg jumps, and DVJ tasks were also poor to fair (r≤0.39).7,16 An explanation for poor-to-moderate correlation values between the 2D and 3D FPPAs found in this study is that the measures of FPPA have been significantly associated with transverse plane kinematics at the knee and hip.7 Willson and Davis7 reported fair correlations (r≤0.38) between 3D tibiofemoral valgus (KAA) and FPPA during single-leg squats and single-leg landings, whereas correlations between FPPA and peak tibiofemoral internal rotation were moderate (r≤0.55). Therefore, we hypothesized that our correlation values between 2D and 3D FPPAs could be due to the influence of transverse plane motions on the FPPA measure lacking the ability to detect the movements that are actually occurring within the lower extremity.
As previously mentioned, this is the first study using the alternative method of FPPA described by Glass et al18 where the fulcrum of the angle is placed on the ankle joint instead of the knee. Our results showed great similarity between both FPPA methods, although mean values for the second method were much closer to the 3D mean values, resulting in greater correlations. A possible explanation is that the influence of transverse plane motion is less in this measure, since it is only taking into consideration movement on the knee and ankle joints, thus discarding the influence of rotation excursion of the hip. Thus, when mean values of both 2D and 3D FPPAs were compared, the 2D values were always higher (∼7° for method 1 and ∼3° for method 2) when compared to the 3D values. We consider that 2D measures of FPPA tend to be overestimated, since they cannot differentiate movement on the transverse plane from the frontal plane.
Regarding the other two 2D outcome measures, the literature reports that the KASR explains 39.4% of the variance for knee abduction moments, which is higher than the variance explained by the FPPA (35%).16 Furthermore, the KSD explains 53% of the variance for the knee abduction angle after having taken into consideration the stance width.12 The KASR is a measure proposed by Mizner et al,16 which is a modification of the KSD proposed by Noyes et al.26 Several factors could have influenced the differences in 2D measures and its correlations with 3D measures between Mizner’s study and this investigation (∼7° difference for FPPA and ∼0.47 cm for KASR). In the study by Mizner et al,16 the concurrent validity and reliability of the KASR were established using only one DVJ trial per subject, whereas the current study used the average of four trials per subject, thereby decreasing the variability of individuals’ jumps. Another reason for the discrepancy between our results was the use of force plates to quantify kinetics. In the investigation by Mizner et al, they asked participants to land with each foot in individual force plates, while we did not restrict the landing mechanics of the participants. We hypothesized that asking participants to land in this manner places the ankles in an already wider position than the knees, predisposing to knee valgus. When we compare our values with another investigation performed by MacDonald et al,27 which did not use force plates, the difference is no >5° for FPPA and 0.19 cm for KASR. Therefore, we recommend that individuals being tested using these measures should not be restricted in the way they land to get a true representation of their landing mechanics.
Our results from the KASR and KSD measures showed good to excellent intrarater (Table 2) and interrater (Table 3) reliabilities as well as an excellent correlation with 3D measures (Table 3). Our reliability results from the KASR concur with those reported by other investigators in which ICC values for interrater (ICC =0.92) and intrarater (ICC = 0.97) reliabilities have been high.16 Our correlation values between the 2D KASR values are greater than those reported in the literature.16 The main reason for this discrepancy is that we correlated the KASR between systems, while Mizner et al correlated KASR against 3D knee abduction angles. As previously stated, 2D measures lack the ability to consider segment rotations. Therefore, the lower correlation values are to be expected due to the nature of greater accuracy of the 3D system. The KSD is another method that has been previously used to identify DKV.28 This method has been reported as adequate as an outcome measure for the assessment to knee injury predisposition and effectiveness after neuromuscular training.26 Although KSD has been reported to explain 97% of hip joint frontal angles and 52% knee valgus variances during a drop jump,12 its concurrent validity and reliability have not been established. Our results from the KSD measure showed excellent intrarater reliability (ICC >89; Table 1) and interrater reliability (ICC =97; Table 2) with excellent concurrent validity (ICC =94) with a 3D system (Table 3). The ability to visually detect knee valgus in 2D without highly instrumented equipment can help clinicians to identify those athletes at risk for lower extremity injuries.10,11 Therefore, given the high reliability and adequate validity of these measures compared to 3D analyses, we highly recommend them for injury risk field-based assessment.
This study does have limitations. Thus, we must evaluate and interpret outcomes in light of these limitations. Our primary purpose for this study was to establish the reliability of previously developed 2D measures for the assessment of knee valgus and to correlate such measurements with measurements taken with a 3D motion analysis system. The main difficulty or limitation encountered throughout the analysis process was the natural biomechanical variability exhibited by each subject when performing the DVJ task. Some of the participants (n=3) tended to excessively flex their trunk during the landing portion of the task, covering the markers of the ASIS with their body. In some cases, the period during which the markers were covered was sufficient to make the 2D and 3D reconstructions of the trial impossible. This was due to the inability to identify the ASIS markers, making the trial unusable. The use of the pressure mat to identify the landing area could have affected the normal landing mechanics used by each subject to perform the DVJ task, as they had intended to land in the desired space. We considered this as a random error, as it was constant throughout the entire study. However, it may become a factor if mean values for each of the outcome measures are later compared against other studies. Given the inherent inability for 2D motion analysis to measure transverse plane motions, there is no way to determine the rotational components occurring at the hip and knee during valgus measures performed with 2D systems. Finally, there is a discrepancy in the clinical assessment of the KASR and KSD in both systems. Based on our 2D and 3D results of the KASR, our participants were not exhibiting valgus, while, based on the results from the KSD, they presented a minimal amount of valgus. We hypothesized the main reason for this discrepancy is the dynamic nature of the measurement. The KASR takes into consideration a single point in time (peak knee flexion) to assess DKV. Meanwhile, KSD is the combination of the time of initial contact and peak knee flexion, resulting in a value that takes into consideration the trajectory of the knee during the stance phase of the landing maneuver. Therefore, we need to be aware of these differences at the time of making a clinical decision, given that 2D methods are not the gold standard to determine predisposition to knee injuries.
Conclusion
All four 2D video-based techniques evaluated during this study have the potential to be used as a cost-effective initial screening process alternative for expensive 3D analysis system in the assessment of frontal plane knee kinematics during a DVJ. Of the four 2D techniques, the KASR and KSD showed more promising results to be used as the preferred methods to measure frontal plane knee kinematics. The results of this study indicate that the KASR and KSD are reliable and more highly correlated with 2D measures of frontal plane knee kinematics when compared to 3D measures. Our results support the current knowledge that FPPA measures are reliable, although their validity when compared to the same measure in 3D systems is questionable.
Acknowledgment
This article was published with support from Texas Woman’s University Libraries’ Open Access Fund.
Disclosure
The authors report no conflicts of interest in this work.
References
Murphy DF, Connolly DA, Beynnon BD. Risk factors for lower extremity injury: a review of the literature. Br J Sports Med. 2003;37(1):13–29. | ||
McLean SG, Beaulieu ML. Complex integrative morphological and mechanical contributions to ACL injury risk. Exerc Sport Sci Rev. 2010;38(4):192–200. | ||
Lindberg U, Lysholm J, Gillquist J. The correlation between arthroscopic findings and the patellofemoral pain syndrome. Arthroscopy. 1986;2(2):103–107. | ||
Boling M, Padua D, Marshall S, Guskiewicz K, Pyne S, Beutler A. Gender differences in the incidence and prevalence of patellofemoral pain syndrome. Scand J Med Sci Sports. 2010;20(5):725–730. | ||
Nagano Y, Fukano M, Itagaki K, Li S, Miyakawa S, Fukubayashi T. Influence of lower limb clinical physical measurements of female athletes on knee motion during continuous jump testing. Open J Sports Med. 2010;4:134–139. | ||
Earl JE, Monteiro SK, Snyder KR. Differences in lower extremity kinematics between a bilateral drop-vertical jump and a single-leg step-down. J Orthop Sports Phys Ther. 2007;37(5):245–252. | ||
Willson JD, Davis IS. Utility of the frontal plane projection angle in females with patellofemoral pain. J Orthop Sports Phys Ther. 2008;38(10):606–615. | ||
Alentorn-Geli E, Myer GD, Silvers HJ, et al. Prevention of non-contact anterior cruciate ligament injuries in soccer players. Part 1: mechanisms of injury and underlying risk factors. Knee Surg Sports Traumatol Arthrosc. 2009;17(7):705–729. | ||
Hewett TE, Myer GD, Ford KR, et al. Biomechanical measures of neuromuscular control and valgus loading of the knee predict anterior cruciate ligament injury risk in female athletes: a prospective study. Am J Sports Med. 2005;33(4):492–501. | ||
Mauntel TC, Frank BS, Begalle RL, Blackburn JT, Padua DA. Kinematic differences between those with and without medial knee displacement during a single-leg squat. J Appl Biomech. 2014;30(6):707–712. | ||
Myer GD, Ford KR, Brent JL, Hewett TE. An integrated approach to change the outcome part I: neuromuscular screening methods to identify high ACL injury risk athletes. J Strength Cond Res. 2012;26(8):2265–2271. | ||
Sigward SM, Havens KL, Powers CM. Knee separation distance and lower extremity kinematics during a drop land: implications for clinical screening. J Athl Train. 2011;46(5):471–475. | ||
Ford KR, Myer GD, Hewett TE. Reliability of landing 3D motion analysis: implications for longitudinal analyses. Med Sci Sports Exerc. 2007;39(11):2021–2028. | ||
Myklebust G, Engebretsen L, Braekken IH, Skjolberg A, Olsen OE, Bahr R. Prevention of anterior cruciate ligament injuries in female team handball players: a prospective intervention study over three seasons. Clin J Sport Med. 2003;13(2):71–78. | ||
Sigward SM, Ota S, Powers CM. Predictors of frontal plane knee excursion during a drop land in young female soccer players. J Orthop Sports Phys Ther. 2008;38(11):661–667. | ||
Mizner RL, Chmielewski TL, Toepke JJ, Tofte KB. Comparison of 2-dimensional measurement techniques for predicting knee angle and moment during a drop vertical jump. Clin J Sport Med. 2012;22(3):221–227. | ||
McLean SG, Walker K, Ford KR, Myer GD, Hewett TE, van den Bogert AJ. Evaluation of a two dimensional analysis method as a screening and evaluation tool for anterior cruciate ligament injury. Br J Sports Med. 2005;39(6):355–362. | ||
Glass RM, Priest EM, Hayward C. Developing a Diagnostic Tool to Measure Valgus Collapse in College Aged Females. Michigan: Spring Arbor University in Michigan; 2008. | ||
Kadaba MP, Ramakrishnan HK, Wootten ME. Measurement of lower extremity kinematics during level walking. J Orthop Res. 1990;8(3):383–392. | ||
Vicon.Motion.Systems. Plug-in-Gait: Product Guide-Foundational Notes. Denver, CO, USA: Vicon Motion Systems; 2010. | ||
Ortiz A, Olson S, Libby CL, Kwon YH, Trudelle-Jackson E. Kinematic and kinetic reliability of two jumping and landing physical performance tasks in young adult women. N Am J Sports Phys Ther. 2007;2(2):104–112. | ||
Ortiz A, Olson S, Libby CL, et al. Landing mechanics between noninjured women and women with anterior cruciate ligament reconstruction during 2 jump tasks. Am J Sports Med. 2008;36(1):149–157. | ||
Ortiz A, Capo-Lugo CE, Venegas-Rios HL. Biomechanical deficiencies in women with semitendinosus-gracilis anterior cruciate ligament reconstruction during drop jumps. PM R. 2014;6(12):1097–1106. | ||
Portney LG, Watkins MP. Foundations of Clinical Research: Applications to Practice. 3rd ed. (revised ed.). Upper Saddle River, NJ: Pearson/Prentice Hall; 2015. | ||
Myer GD, Ford KR, Khoury J, Succop P, Hewett TE. Clinical correlates to laboratory measures for use in non-contact anterior cruciate ligament injury risk prediction algorithm. Clin Biomech (Bristol, Avon). 2010;25(7):693–699. | ||
Noyes FR, Barber-Westin SD, Fleckenstein C, Walsh C, West J. The drop-jump screening test: difference in lower limb control by gender and effect of neuromuscular training in female athletes. Am J Sports Med. 2005;33(2):197–207. | ||
MacDonald K, Whittaker J, Baltrich J. Frontal knee angle during single leg squat and vertical drop jump: a comparison of youth athletes with and without a history of knee injury. Paper presented at: International Olympic CommitteeWorld Conference on Prevention of Injury & Illness in Sport; 2014; Monaco. | ||
Barber-Westin SD, Galloway M, Noyes FR, Corbett G, Walsh C. Assessment of lower limb neuromuscular control in prepubescent athletes. Am J Sports Med. 2005;33(12):1853–1860. |
 © 2016 The Author(s). This work is published and licensed by Dove Medical Press Limited. The
full terms of this license are available at https://www.dovepress.com/terms
and incorporate the Creative Commons Attribution
- Non Commercial (unported, 3.0) License.
By accessing the work you hereby accept the Terms. Non-commercial uses of the work are permitted
without any further permission from Dove Medical Press Limited, provided the work is properly
attributed. For permission for commercial use of this work, please see paragraphs 4.2 and 5 of our Terms.
© 2016 The Author(s). This work is published and licensed by Dove Medical Press Limited. The
full terms of this license are available at https://www.dovepress.com/terms
and incorporate the Creative Commons Attribution
- Non Commercial (unported, 3.0) License.
By accessing the work you hereby accept the Terms. Non-commercial uses of the work are permitted
without any further permission from Dove Medical Press Limited, provided the work is properly
attributed. For permission for commercial use of this work, please see paragraphs 4.2 and 5 of our Terms.